
桂林-阳朔地区DEM地形特征与岩性相关性分析及分类研究
|
陈霄燕(1994-),女,内蒙古赤峰人,硕士生,主要从事遥感与地理信息系统方面的研究。E-mail: xychen17@mails.jlu.edu.cn |
收稿日期: 2019-07-27
要求修回日期: 2019-10-31
网络出版日期: 2019-12-25
基金资助
中国地质调查局地质调查项目(3R114Z184423)
版权
Correlation Analysis and Classification of DEM Topographic Features and Lithology in Guilin-Yangshuo, China
Received date: 2019-07-27
Request revised date: 2019-10-31
Online published: 2019-12-25
Supported by
Geological Survey Projects of China Geological Survey(3R114Z184423)
Copyright
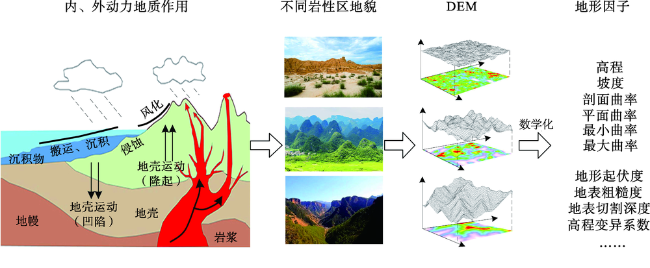
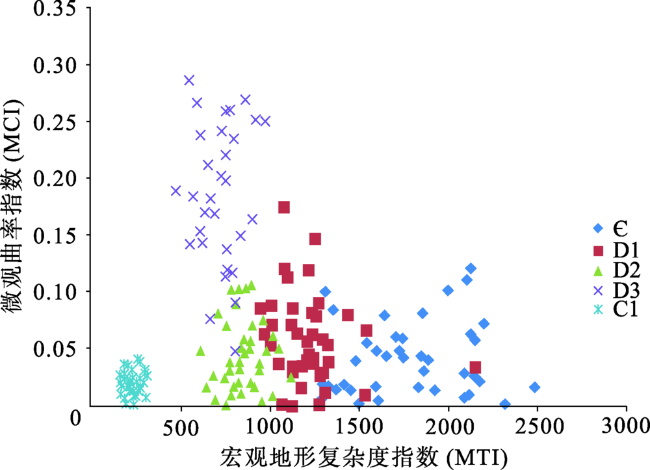
地形地貌是岩性解译的重要信息,地形因子作为描述DEM数字曲面几何特征的定量指标参数,可用来定量化表达不同岩性所在地区地形地貌特征。本文以桂林-阳朔地区为研究区,研究地形因子数学、地质意义,建立岩性与地形因子组合间的定量关联,进而实现岩石类型划分。本文基于ASTERGDEM提取坡度、起伏度等12个地形因子,在分析各个地形因子地质意义基础上,通过聚类分析及方差分析的多元统计分析方法,研究各岩性地形因子特性及其关联性,建立研究区岩性之间的定量差异;此外,利用因子分析方法研究岩性分类过程中的主导因素,确定适宜岩性分类方法以实现定量化岩性分类。实验结果表明:不同岩性、不同地形地貌的地形因子(组合)之间具有显著差异,基于因子分析得到的宏观地形复杂度指数(MTI)以及微观曲率指数(MCI)对岩石类型的分类精度达77.36%。研究表明,地形复杂度等地形因子可用于岩性分类,采用因子分析方法可获取反映地形地貌宏观、微观特征的定量指标,且岩性分类效果良好。
陈霄燕 , 潘军 , 邢立新 , 蒋立军 , 孙也涵 , 仲伟敬 , 范博文 . 桂林-阳朔地区DEM地形特征与岩性相关性分析及分类研究[J]. 地球信息科学学报, 2019 , 21(12) : 1867 -1876 . DOI: 10.12082/dqxxkx.2019.190402
Topographic and geomorphological features are important for remote sensing lithologic interpretation, but there still lacks quantitative analysis of the geological correlation between topography and lithology. Digital Elevation Model (DEM) is a digital representation and simulation of topographic and geomorphological features in space. Topographic factors derived from DEM can describe the characteristics of concave and convex changes of different topographic slopes and undulations, thus quantitatively describing the characteristics of different topographic and geomorphological features. This paper focuses on studying the mathematical and geological significance of topographic factors, by establishing the quantitative correlation between lithology and topographic factors combination for classifying rock types. Based on ASTER GDEM data, this paper extracted 12 topographic factors, such as slope, profile curvature, maximum curvature, topographic relief, and elevation coefficient of variation. Based on analysis of the geological significance of each topographic factor, the characteristics and correlation of each lithologic topographic factor were studied by cluster analysis and variance analysis, and the quantitative difference between lithologies in the study area was established. In addition, the factor analysis method was used to study the dominant factors in the process of lithological classification, and to determine the appropriate lithological classification method and achieve quantitative lithological classification. Quantitative research was carried out on the two basic issues: whether topographic factors can be used for lithologic classification and how to use topographic factors to identify lithology. Experimental results show: (1) There was a significant correlation between lithology and topographic factors and the topographic factors of different lithologies could be distinguished significantly. (2) There were significant differences among the topographic factors (combinations) of different lithology and topography. The macro-topographic complexity index (MTI) and micro-curvature index (MCI) based on factor analysis had a relatively high classification accuracy of 77.36% for the rock types in the study area, highly consistent with the actual lithologic types. Our findings suggest that topographic factors such as slope and topographic complexity can be used for lithological classification, and that factor analysis can be used to obtain quantitative indicators reflecting macro-topographic complexity and micro-topographic curvature characteristics. This study can serve as a methodological reference for quantitative classification of lithology.
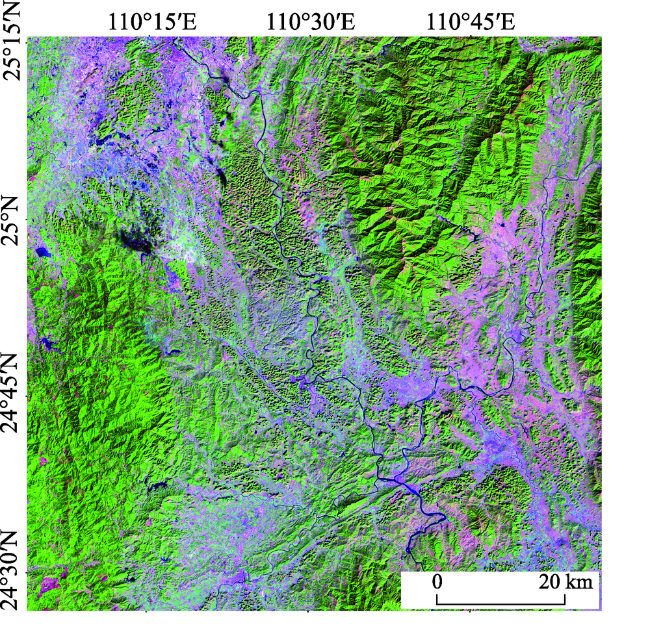
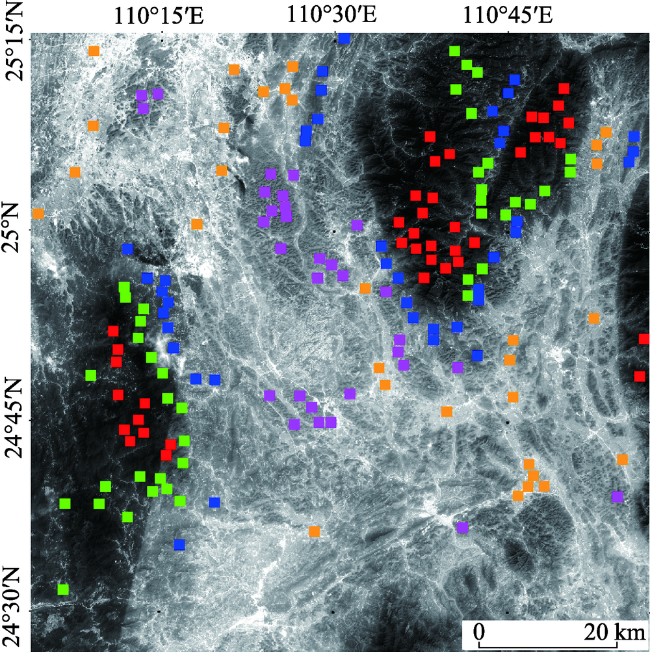
图2 广西桂林-阳朔地区Landsat8遥感影像注:RGB为波段7、5、4。 Fig. 2 Remote sensing image for the Guilin-Yangshuo Region |
| 空间范围 | 名称 | 定义 | 地质意义 |
|---|---|---|---|
| 微观 | 高程 | 地面点沿铅垂线到大地水准面的距离 | 反映该点岩石地层的剥蚀程度 |
| 坡度 | 曲面一点P的法线方向与天顶方向Z之间的夹角 | 与该点岩石地层产状密切相关 | |
| 剖面曲率 | 过地面点P的法矢量且与该点坡度平行的法截面与地形曲面相交的曲线在该点的曲率 | 反映该点在坡度方向上的凹凸、弯曲情况及岩性破碎程度,抗风化能力 | |
| 水平曲率 | 过p点等高线的曲率 | 反映该点所在地面等高线的弯曲程度及岩性破碎程度,抗风化能力 | |
| 纵向曲率 | 沿下坡方向的坡度变化率 | 反映该点在坡度方向上弯曲、变化情况及岩性破碎程度,抗风化能力 | |
| 横向曲率 | 与下坡方向垂直的方向上的坡度变化率 | 反映该点在坡度垂直方向上的弯曲、变化情况及岩性破碎程度,抗风化能力 | |
| 最大/最小曲率 | 计算得到整体曲率的最大值/最小值 | 在整体上反映地面越弯曲程度及岩性抗风化能力,并可以用来识别山脊和山谷 | |
| 宏观 | 地形起伏度 | 区域内的最大高程和最小高程之差 | 反映该地岩性抗风化能力 |
| 地表切割深度 | 区域内高程平均值和最小高程之差 | 反映地表被侵蚀切割情况,岩石透水性及抗风化能力 | |
| 高程变异系数 | 区域内高程的标准差与均值之比 | 反映地表破碎程度,及岩性抗风化能力 | |
| 地表粗糙度 | 区域地形表面积和投影面积之比 | 反映地表光洁程度、地形复杂程度及岩石坚硬程度,及透水性强弱 |
表2 各岩性遥感影像及DEM影像特征对照Tab. 2 Contrast of five types of lithologic remote sensing images and DEM images in the study area |
| 岩性 | 遥感影像 | DEM影像 |
|---|---|---|
| Є(寒武系杂砂岩、页岩) | 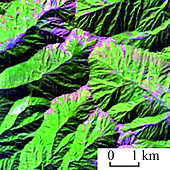 | 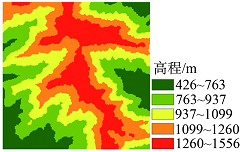 |
| D1(泥盆系砂岩、页岩、砾岩及碳酸盐岩) | 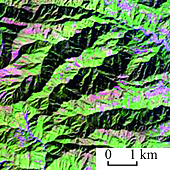 | 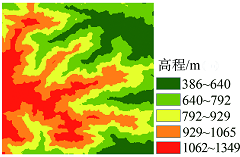 |
| D2(泥盆系碳酸盐岩、砂岩、页岩夹赤铁矿) | 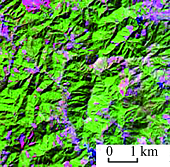 | 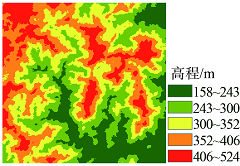 |
| D3(泥盆系碳酸盐岩、硅质岩夹锰矿) |  | 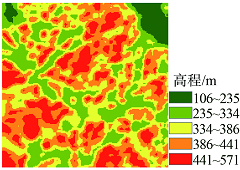 |
| C1(石炭系碳酸盐岩、砂岩、页岩、 硅质岩夹煤及锰矿) |  | 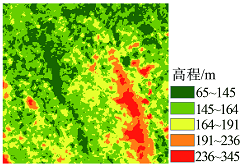 |
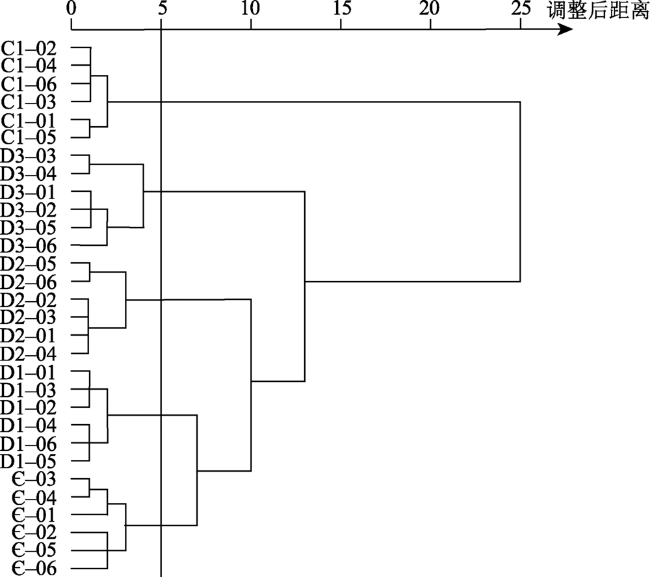
表3 可分性度量结果Tab. 3 Separability of lithologies in each clustering process |
| 类别数目 | 可分性度量值F | Fα(α=0.01) | Fα(α=0.05) | Fα(α=0.1) |
|---|---|---|---|---|
| 5 | 5.182 | 4.18 | 2.76 | 2.08 |
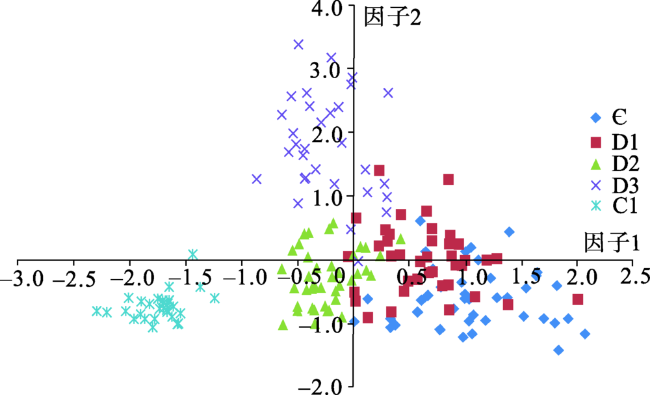
表4 由代表性样品所计算的因子负载矩阵[35]Tab. 4 Rotating component matrix |
| 因子/变量(地形因子) | 1.000 | 2.000 | 3.000 | 4.000 | 5.000 | 6.000 | 7.000 | 8.000 | 9.000 | 10.000 | 11.000 | 12.000 | 公因子方差 |
|---|---|---|---|---|---|---|---|---|---|---|---|---|---|
| X1高程 | 0.911 | -0.120 | -0.269 | 0.074 | 0.108 | -0.070 | -0.035 | 0.245 | 0.007 | -0.002 | 0.000 | 0.000 | 1.000 |
| X2坡度 | 0.846 | 0.228 | 0.253 | 0.148 | 0.167 | 0.276 | 0.091 | 0.014 | 0.185 | -0.003 | 0.000 | 0.000 | 1.000 |
| X3剖面曲率 | -0.008 | 0.988 | 0.113 | 0.062 | 0.009 | 0.052 | -0.001 | 0.000 | 0.008 | 0.004 | -0.059 | 0.000 | 1.000 |
| X4水平曲率 | -0.278 | -0.001 | -0.137 | -0.084 | -0.945 | -0.053 | -0.004 | -0.002 | -0.003 | 0.000 | 0.000 | 0.000 | 1.000 |
| X5纵向曲率 | 0.007 | 0.988 | 0.115 | 0.066 | 0.005 | 0.072 | 0.021 | -0.005 | 0.007 | -0.001 | 0.029 | -0.004 | 1.000 |
| X6横向曲率 | 0.007 | 0.988 | 0.115 | 0.067 | 0.004 | 0.073 | 0.021 | -0.005 | 0.007 | -0.002 | 0.030 | 0.004 | 1.000 |
| X7最小曲率 | 0.563 | 0.343 | 0.331 | 0.248 | 0.140 | 0.612 | 0.001 | -0.008 | -0.002 | 0.001 | 0.000 | 0.000 | 1.000 |
| X8最大曲率 | 0.183 | 0.125 | 0.061 | 0.967 | 0.079 | 0.074 | 0.006 | 0.001 | 0.003 | 0.000 | 0.000 | 0.000 | 1.000 |
| X9地形起伏度 | 0.933 | -0.067 | 0.261 | 0.085 | 0.151 | 0.044 | -0.038 | -0.100 | -0.038 | 0.114 | 0.000 | 0.000 | 1.000 |
| X10地表切割深度 | 0.956 | -0.126 | 0.116 | 0.077 | 0.141 | 0.027 | -0.088 | -0.081 | -0.081 | -0.097 | 0.001 | 0.000 | 1.000 |
| X11高程变异系数 | 0.215 | 0.270 | 0.916 | 0.070 | 0.154 | 0.112 | 0.011 | -0.012 | 0.004 | 0.001 | 0.000 | 0.000 | 1.000 |
| X12地表粗糙度 | 0.826 | 0.258 | 0.227 | 0.136 | 0.104 | 0.317 | 0.261 | -0.029 | 0.032 | -0.001 | 0.001 | 0.000 | 1.000 |
| 方差贡献 | 5.775 | 3.311 | 0.950 | 0.843 | 0.673 | 0.263 | 0.078 | 0.059 | 0.023 | 0.020 | 0.005 | 0.000 | 12.000 |
表5 基于岩性地形特征指数的岩性样本分类混淆矩阵Tab. 5 Confusion matrix of lithologic sample classification based on the lithologic topographic index |
| 分类类型 | 实际类型 | 分类类 型总和 | ||||
|---|---|---|---|---|---|---|
| Є | D1 | D2 | D3 | C1 | ||
| Є | 21 | 4 | 0 | 0 | 0 | 25 |
| D1 | 2 | 19 | 4 | 0 | 0 | 25 |
| D2 | 0 | 1 | 13 | 11 | 0 | 25 |
| D3 | 0 | 0 | 1 | 14 | 1 | 16 |
| C1 | 0 | 0 | 0 | 0 | 15 | 15 |
| 实际类型总和 | 23 | 24 | 18 | 25 | 16 | 106 |
| [1] |
田淑芳, 詹骞 . 遥感地质学(第二版)[M]. 北京: 地质出版社, 2014.
[
|
| [2] |
|
| [3] |
曾昭璇 . 岩石地形学[M]. 北京: 地质出版社, 1960.
[
|
| [4] |
朱亮璞 . 遥感地质学(第二版)[M]. 北京: 地质出版社, 2013.
[
|
| [5] |
宋坤 . 遥感岩性解译在荞麦地水文地质环境调查中的应用[C]. 第十五届全国数学地质与地学信息学术研讨会论文集.长沙, 2016.
[
|
| [6] |
|
| [7] |
张瑞丝, 曹汇, 曾敏 , 等. 基于ASTER光谱特征的科技廊带岩性填图——以新疆塔什库尔干地区为例[J]. 岩石学报, 2016,32(12):3835-3846.
[
|
| [8] |
|
| [9] |
|
| [10] |
|
| [11] |
帅爽, 张志, 王少军 , 等. 基于多元参照光谱的SAM岩性划分方法[J]. 地球信息科学学报, 2016,18(1):133-140.
[
|
| [12] |
张志, 管志超, 王少军 . 结合实测光谱的ASTER TIR数据岩性划分与构造样式分析——以新疆阿克苏蓝片岩为例[J]. 吉林大学学报(地球科学版), 2018,48(1):334-342.
[
|
| [13] |
刘昌振, 舒红, 张志 , 等. 基于多尺度分割的高分遥感图像变异函数纹理提取和分类[J]. 国土资源遥感, 2015,27(4):47-53.
[
|
| [14] |
|
| [15] |
|
| [16] |
|
| [17] |
邬健健 . 基于分形与空间分析理论的遥感岩性提取——以陕西宝鸡黄土区为例[D]. 西安:长安大学, 2018.
[
|
| [18] |
|
| [19] |
|
| [20] |
汤国安, 李发源, 刘学军 . 数字高程模型教程[M]. 北京: 科学出版社, 2010.
[
|
| [21] |
|
| [22] |
|
| [23] |
俞乐 . 多源遥感信息快速处理与岩性信息自动提取方法研究[D]. 杭州:浙江大学, 2010.
[
|
| [24] |
|
| [25] |
王婷, 潘军, 蒋立军 , 等. 基于DEM的地形因子分析与岩性分类[J]. 国土资源遥感, 2018,30(2):234-240.
[
|
| [26] |
姜莎莎, 李培军 . 基于ASTER图像和地形因子的岩性单元分类——以新疆木垒地区为例[J]. 地球信息科学学报, 2011,13(6):825-83.
[
|
| [27] |
翁金桃, 罗贵荣 . 桂林-阳朔一带峰林石山的形态类型及其岩性控制[J]. 中国岩溶, 1986,5(2):141-146.
[
|
| [28] |
马丽芳 . 中国地质图集[M]. 北京: 地质出版社, 2002.
[
|
| [29] |
康晓伟, 冯钟葵 . ASTER GDEM数据介绍与程序读取[J]. 遥感信息, 2011,36(6):69-72.
[
|
| [30] |
邓书斌 . ENVI遥感图像处理方法[M]. 北京: 高等教育出版社, 2014.
[
|
| [31] |
|
| [32] |
李志林, 朱庆 . 数字高程模型[M]. 武汉: 武汉大学出版社, 2001.
[
|
| [33] |
纪宏金, 时艳香, 陆继龙 . 地球化学数据统计分析[M]. 长春: 吉林大学出版社, 2014.
[
|
| [34] |
王学仁 . 地质数据的多变量统计分析[M]. 北京: 科学出版社, 1982.
[
|
| [35] |
|
| [36] |
于一凡 . 高温目标物理参量短波红外遥感反演[D]. 长春:吉林大学, 2017.
[
|
| [37] |
|
| [38] |
|
| [39] |
|
/
| 〈 |
|
〉 |