
CA-Markov与LCM模型的黄河三角洲湿地变化模拟比较
|
陈柯欣(1994-),女,辽宁营口人,硕士生,主要从事湿地遥感和应用研究。E-mail: 457261689@qq.com |
收稿日期: 2018-12-13
要求修回日期: 2019-05-27
网络出版日期: 2019-12-25
基金资助
国家重点研发计划专项(2017YFC0505901)
版权
Comparison of the CA-Markov and LCM Models in Simulating Wetland Change in the Yellow River Delta
Received date: 2018-12-13
Request revised date: 2019-05-27
Online published: 2019-12-25
Supported by
National Key Research and Development Program of China(2017YFC0505901)
Copyright
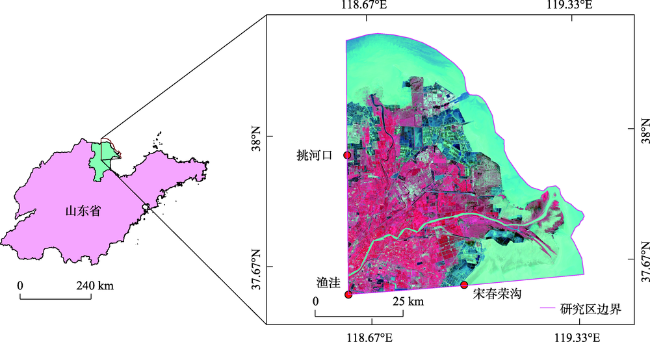
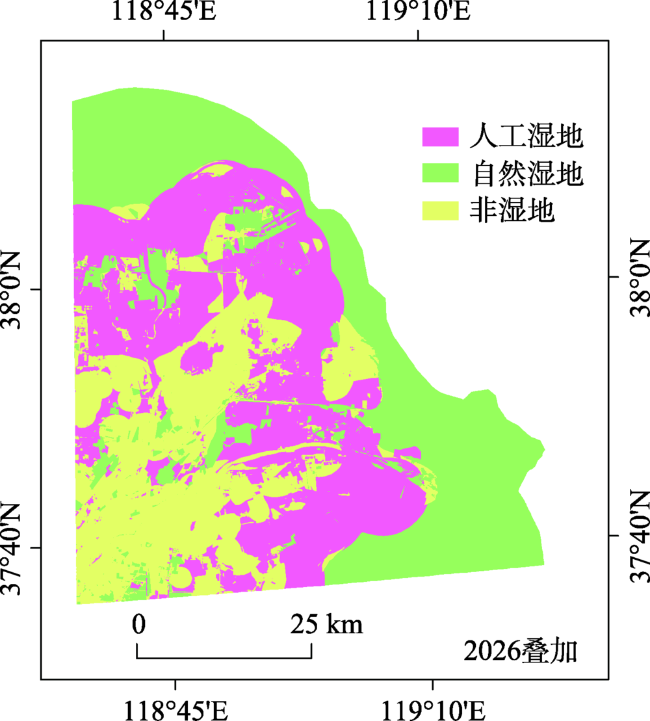
为了了解黄河三角洲湿地景观类型演变最优模拟模型以及景观的变化趋势,本文采用1996、2006、2016年3期黄河三角洲分类影像,分别利用CA-Markov、LCM、2种模型叠加开展变化模拟。研究发现:① 在相同驱动力因子影响下,空间模拟上LCM比CA-Markov好,数量模拟上,CA-Markov比LCM更贴合,对于变化较大研究区,综合2种模型优势来模拟该湿地变化最佳;② 对于较强的人为、自然灾害干扰,会对模拟精度有影响。在LCM模型中,驱动力相同情况下,生成适宜性图像的转移子模型数量越多,模拟精度越高。对于CA-Markov模型,比例误差系数适宜的设置对数量模拟的精度也有提升;③ 在保持2006-2016年的变化趋势下,综合2种模型模拟的2026年自然湿地面积1252.69 km 2,人工湿地面积1265.00 km 2,非湿地面积924.51 km 2。从2026年黄河三角洲模拟的结果可看出,自然、非湿地的面积减少,人工湿地大量的增加并不断向浅海区域扩张。通过对黄河三角洲湿地变化进行预测分析,可为湿地资源的合理有效利用与管理等提供科学依据。
关键词: 湿地; 模拟; 黄河三角洲; CA-Markov模型; LCM模型
陈柯欣 , 丛丕福 , 卢伟志 , 曲丽梅 . CA-Markov与LCM模型的黄河三角洲湿地变化模拟比较[J]. 地球信息科学学报, 2019 , 21(12) : 1903 -1910 . DOI: 10.12082/dqxxkx.2019.180660
The aim of this paper is to select the optimization model of the region and understand the future quantity and spatial variation trend of the wetland landscape types in the Yellow River Delta. We used the classified maps of the three periods of 1996, 2006 and 2016, of which the 1996 and 2006 maps were modeled for predicting 2016; we then compared the classified and simulated maps of 2016 to assess the model performances. The best model were used to take the classified 2006 and 2016 maps to simulate the landscape of the Yellow River Delta in 2026. We found that: ① For the simulation of the landscape types of the Yellow River Delta, under the influence of the same driving force factors, the LCM (Land Change Modeler) model performed better than the CA-Markov model in terms of spatial error, while CA-Markov was more suitable for the actual wetland change trend modeling than the LCM model in terms of numerical error. For the areas of larger landscape changes, the advantages of the two models should be combined to best simulate the change trend of wetlands. ② The interference of some human factors and the impact of natural disasters on the landscape types cannot be considered the model, it would cause some interference to simulation accuracy. For the LCM model, the number of transition sub-models had an effect on the simulation results with the same driving force factor, the more transition sub-models were used to generate suitable images, the higher the simulation accuracy. For CA-Markov model, the setting of proportional error coefficient was suitable for improving the accuracy of numerical simulation. ③ Assuming the continuation of the landscape dynamics trend during 2006-2016, and by simulation via combining the two simulation methods up to year 2026, the simulated natural wetlands area was 1252.69 km 2, the human-made wetlands area was 1265.00 km 2, and the non-wetlands area was 924.51 km 2. The simulated results suggest that natural wetlands and non-wetlands area will likely reduce, and human-made wetlands area will increase and expand to even shallow sea areas. Our findings can provide a scientific basis for the rational layout planning of the regional development space and the rational and effective utilization and management of wetland resources.
Key words: wetland; simulation; Yellow River Delta; CA-Markov model; Land Change Modeler
表2 MLP模型中转移子模型的数量Tab. 2 Number of transition sub-models in the MLP model |
| 过程 | 转移子模型 数量 | 数量 误差 | 空间 误差 | 整体精度 验证/% |
|---|---|---|---|---|
| LCM第一组 | 1 | 0.15 | 0.20 | 44.48 |
| LCM第二组 | 6 | 0.15 | 0.15 | 52.07 |
注:空间误差Allocation disagreement(grid cell level)等于 K(m)-M(m)。K(m)是参考图和修改的比较图之间的一致性; M(m)是参考图和未修改的比较图之间的一致性。 |
| [1] |
汪小钦, 王钦敏, 刘高焕 , 等. 黄河三角洲土地利用/土地覆被区域分异[J]. 自然资源学报, 2006,21(2):165-171.
[
|
| [2] |
王红, 宫鹏, 刘高焕 . 黄河三角洲土地利用/土地覆盖变化研究现状与展望[J]. 自然资源学报, 2004,19(1):110-118.
[
|
| [3] |
国务院办公厅. 《湿地保护修复制度方案》[J]. 给水排水, 2017,53(2):134.
[ The General Office of the State Council. The wetland protection and restoration system program[J]. Water & Wastewater Engineering, 2017,53(2):134. ]
|
| [4] |
|
| [5] |
胡胜杰, 牛振国, 张海英 , 等. 中国潜在湿地分布的模拟[J]. 科学通报, 2015,60(33):3251-3262.
[
|
| [6] |
|
| [7] |
|
| [8] |
|
| [9] |
|
| [10] |
杨丽桃 . 福州城区土地利用变化LCM模型构建与模拟[D]. 福州:福建农林大学, 2012.
[
|
| [11] |
彭峰 . 基于RS和GIS的银川市土地利用/土地覆盖变化研究[D]. 兰州:兰州大学, 2011.
[
|
| [12] |
魏辽生 . 基于IDRISI-LCM模型的土地利用变化与预测研究—以庄河市为例[D]. 大连:辽宁师范大学, 2015.
[
|
| [13] |
刘世梁, 安南南, 尹艺洁 , 等. 广西滨海区域景观格局分析及土地利用变化预测[J]. 生态学报, 2017,37(18):5915-5923.
[
|
| [14] |
|
| [15] |
山东黄河三角洲国家级自然保护区管理局. 山东黄河三角洲国家级自然保护区详细规划[M]. 北京: 中国林业出版社, 2016.
[ Shandong Yellow River Delta National Nature Reserve Administration. Detailed Planning of Shandong Yellow River Delta National Nature Reserve (2014-2020)[M]. Beijing: China Forestry Publishing House, 2016. ]
|
| [16] |
吕宪国 . 湿地生态系统保护与管理[M]. 北京: 化学工业出版社, 2004.
[
|
| [17] |
|
| [18] |
井云清, 张飞, 张月 . 基于CA-Markov模型的艾比湖湿地自然保护区土地利用/覆被变化及预测[J]. 应用生态学报, 2016,27(11):3649-3658.
[
|
| [19] |
|
| [20] |
|
/
| 〈 |
|
〉 |


