
基于GF-3和Landsat 8遥感数据的土壤水分反演研究
|
雷志斌(1995-),男,云南昭通人,硕士生,研究方向为定量遥感及农业遥感。E-mail: 1529418402@qq.com |
收稿日期: 2019-03-13
要求修回日期: 2019-08-19
网络出版日期: 2019-12-25
基金资助
海南省财政科技计划项目(ZDYF2018231)
四川省科技计划项目(2018JZ0054)
高分辨率对地观测系统重大专项(30-Y20A07-9003-17/18)
国家高分辨率对地观测重大科技专项项目(05-Y30B01-9001-19/20-1)
版权
Soil Moisture Retrieval Study based on GF-3 and Landsat8 Remote Sensing Data
Received date: 2019-03-13
Request revised date: 2019-08-19
Online published: 2019-12-25
Supported by
Finance Science and Technology Project of Hainan Province(ZDYF2018231)
Sichuan Province Science and Technology Program(2018JZ0054)
Major Special Project the China High Resolution Earth Observation System(30-Y20A07-9003-17/18)
the Major Projects of High Resolution Earth Observation Systems of National Science and Technology(05-Y30B01-9001-19/20-1)
Copyright
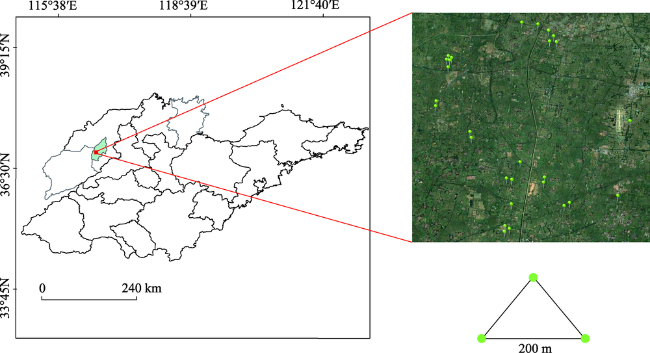
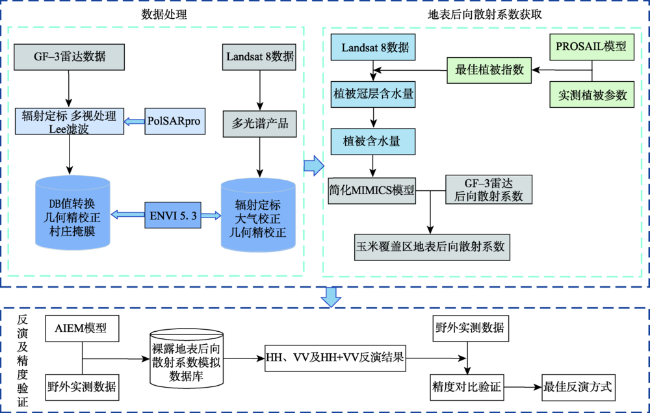
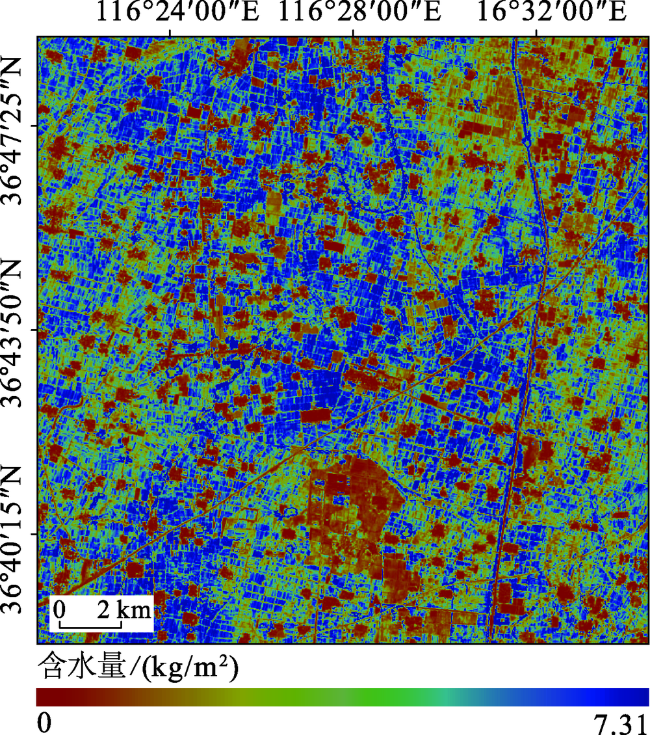
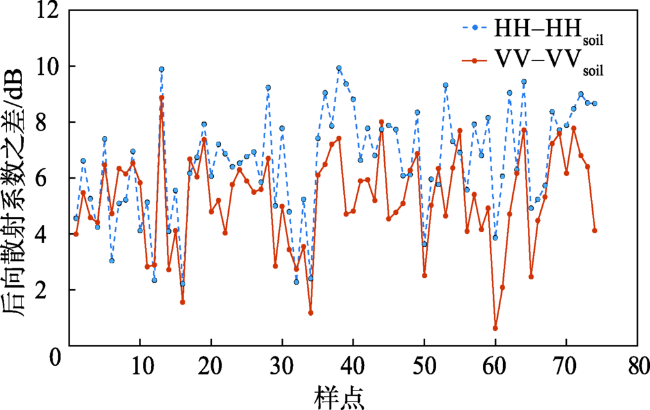
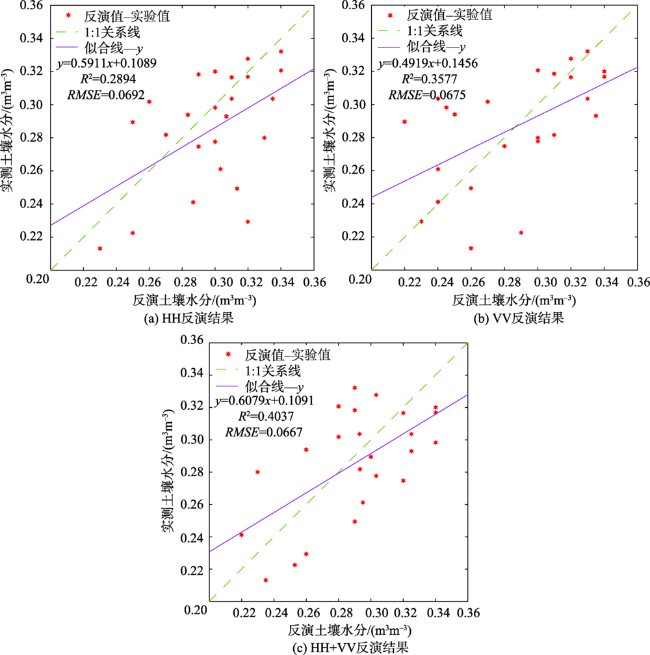
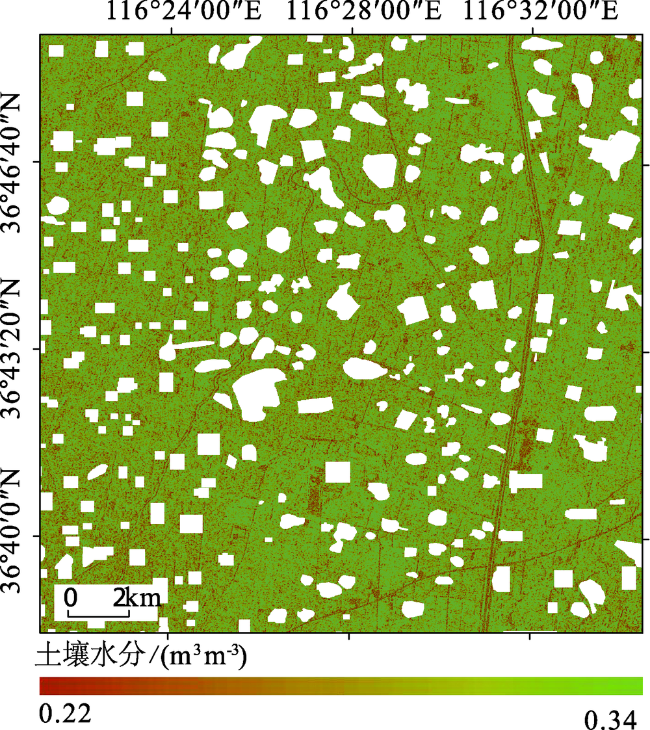
基于我国首颗全极化雷达卫星高分三号(GF-3)和Landsat8数据,研究浓密植被覆盖地表土壤水分反演方法。为了提高浓密植被覆盖地表土壤水分反演精度,首先利用PROSAIL模型、实测植被参数及Landsat8光学数据分析了8种植被指数与植被冠层含水量的相关性,从中优选出归一化差异水指数(NDWI5)用于反演植被冠层含水量,并通过分析植被含水量和植被冠层含水量的关系,构建植被含水量模型;然后结合植被含水量反演模型和简化MIMICS模型校正了植被对雷达后向散射系数的影响,最后基于AIEM建立裸土后向散射系数模拟数据集,发展一种主动微波和光学数据协同反演浓密植被覆盖地表土壤水分模型,并以山东省禹城市为研究区,实现了玉米覆盖下HH、VV和HH+VV 3种模式土壤水分反演。实验结果表明: ① NDWI5为最佳植被指数,对于去除植被影响有较好效果;② 基于此方法,利用GF-3和Landsat8卫星数据反演得到的土壤水分具有较高的精度;③ 相比HH和VV两种极化模式,HH+VV双通道模式对土壤水分反演结果更好,决定系数(R²)为0.4037,均方根误差(RMSE)为0.0667 m 3m -3。
雷志斌 , 孟庆岩 , 田淑芳 , 张琳琳 , 马建威 . 基于GF-3和Landsat 8遥感数据的土壤水分反演研究[J]. 地球信息科学学报, 2019 , 21(12) : 1965 -1976 . DOI: 10.12082/dqxxkx.2019.190115
As an important component of soil, soil moisture plays an important role in crop growth. The GaoFen-3(GF-3) satellite, as the first C-band full-polarization Synthetic-Aperture Radar (SAR) satellite of China, provides a valuable data source for soil moisture monitoring. In this study, a soil moisture retrieval algorithm was developed over densely-vegetated areas based on GF-3 and Landsat8 data. To improve the accuracy of the soil moisture retrieval, this paper firstly analyzed the correlation between eight vegetation indices and Vegetation Canopy Water Content (VCWC) based on the PROSAIL model, measured vegetation parameters and the Landsat8 optical data. The Normalized Difference Water Index (NDWI5), which was identified as the optimal index from these indexes, was used to obtain the VCWC. The inversion model of Vegetation Water Content (VWC) was established by analyzing the relationship between measured VWC and the VCWC. Secondly, the model was integrated with simplified Michigan Microwave Canopy Scattering (MIMICS) model to correct the effects of vegetation on the radar backscattering coefficient. Finally, the backscattering coefficient simulation dataset of bare soil was established based on the Advanced Integrated Equation Model (AIEM) for developing the soil moisture retrieval model over densely-vegetated areas by combining active microwave and optical remote sensing data. The soil moisture retrieval algorithm was validated in a region of corn in Yucheng city, Shandong province, with soil moisture retrievals obtained at HH, VV and HH+VV combination, respectively. Results show: ① NDWI5 had the best fit with measured VCWC values among the eight vegetation indices, with the coefficient of determination (R 2) reaching 0.7433, and the Root Mean Square Error (RMSE) being 0.5146 kg/m 2. Thus, it was adopted to correct the effects of vegetation. ② The proposed algorithm based on GF-3 and Landsat8 satellite data performed well in soil moisture retrieval that resulted in improved accuracy in soil moisture monitoring. ③ Compared with the HH and VV polarization, the HH+VV dual-channel mode exhibited the highest accuracy, with a R 2 of 0.4037 and a RMSE of 0.0667 m 3m -3, followed by the HH polarization (R 2=0.2894, RMSE=0.0692 m 3m -3) and the VV polarization (R 2=0.3577, RMSE=0.0675 m 3m -3). Our findings suggest that the proposed algorithm has good potential for operationally estimating soil moisture from the new GF-3 satellite data with high accuracy.
表1 GF-3卫星全极化条带1(QPS1)Tab. 1 Fully polarized strip 1(QPS1) of the GF-3 satellite |
| 工作模式 | 入射角/° | 视数 | 分辨率/m | 幅宽/km | 极化方式 | |
|---|---|---|---|---|---|---|
| 方位向 | 距离向 | |||||
| 全极化条带1(QPS1) | 42.4° | 1x1 | 8 | 8 | 25 | 全极化(HH HV VH VV) |
表2 植被指数计算公式Tab. 2 Formulas used to calculate the vegetation indices |
| 名称 | 公式 | 参考文献 |
|---|---|---|
| 简单比值指数 | [17] | |
| 水胁迫指数 | [18] | |
| 归一化差异水 指数 | [19] | |
| 归一化差异水 指数 | - | |
| 归一化植被指数 | [20] | |
| 归一化多波段 干旱指数 | [21] | |
| 四波段干旱 指数 | [22] | |
| 增强植被指数 | [23] |
表3 PROSAIL模型参数Tab. 3 PROSAIL model parameters |
| 参数名称 | 范围 | 步进 |
|---|---|---|
| 等效水厚度/(g/cm2) | 0.05~0.25 | 0.02 |
| 叶绿素含量/(μg/cm2) | 25~75 | 10 |
| 叶面积指数 | 1~7 | 1 |
| 干物质含量/(g/cm2) | 0.01~0.011 | 0.01 |
| 叶片结构 | 2.5 | |
| 土壤系数 | 1 | |
| 太阳天顶角/° | 65 | |
| 观测天顶角/° | 42.4 | |
| 平均叶倾角/° | 50 | |
表4 AIEM模型参数Tab. 4 AIEM model parameters |
| 参数名称 | 范围 | 步进 |
|---|---|---|
| 土壤水分/(m3m-3) | 0.22~0.34 | 0.005 |
| 均方根高度/cm | 0.4~2.8 | 0.1 |
| 相关长度/cm | 5~25 | 1 |
| 入射角/° | 20~60 | 1 |
| 极化方式 | HH、VV | |
| 频率/GHZ | 5.4 | |
| 土壤容重/(g/cm3) | 1.29 | |
| 地表温度/℃ | 29 | |
| 沙土、黏土/% | 32、26 | |
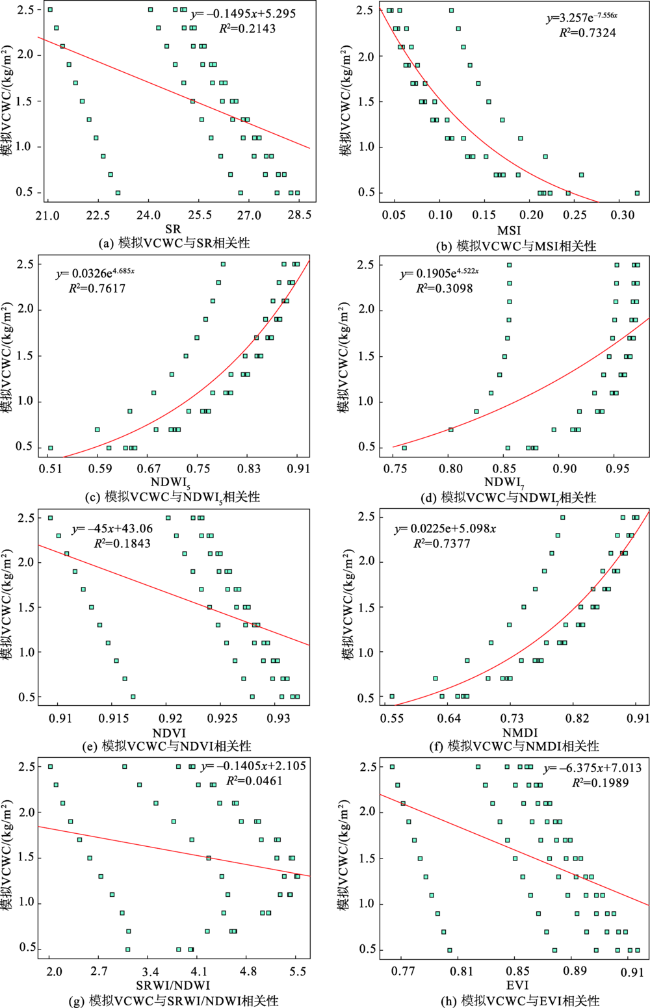
图3 PROSAIL模型植被指数与模拟植被冠层含水量相关性Fig. 3 Relationship between vegetation indices from the PROSAIL model and simulated vegetation canopy water content |
表5 PROSAIL模型植被指数拟合精度Tab. 5 Fitting accuracy of each vegetation index from the PROSAIL model |
| 植被指数 | 拟合公式 | R2 | RMSE/(kg/m2) |
|---|---|---|---|
| SR | y=-0.1495x+5.295 | 0.2143 | 0.5711 |
| MSI | y=3.257e-7.556x | 0.7324 | 0.3323 |
| NDWI5 | y=0.0326e4.685x | 0.7617 | 0.3135 |
| NDWI7 | y=0.1905e4.522x | 0.3098 | 0. 5526 |
| NDVI | y=-45x+43.06 | 0.1843 | 0.5832 |
| NMDI | y=0.0225e5.098x | 0.7377 | 0.3289 |
| SRWI/NDWI | y=-0.1405x+2.105 | 0.0461 | 0.6273 |
| EVI | y=-6.375x+7.013 | 0.1989 | 0.5749 |
注:y为模拟植被冠层含水量,x为植被指数。 |
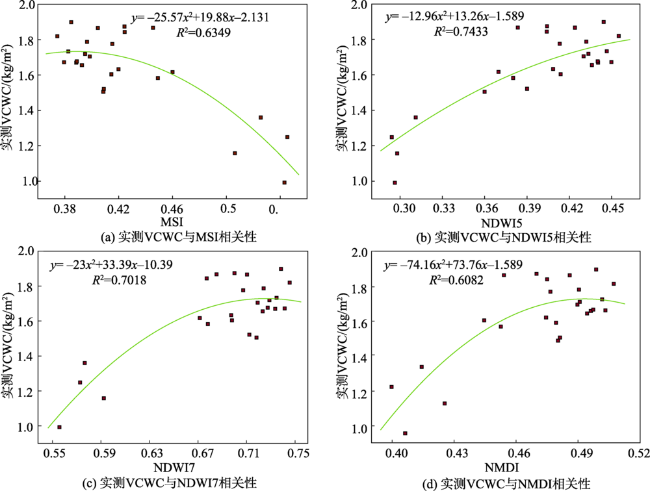
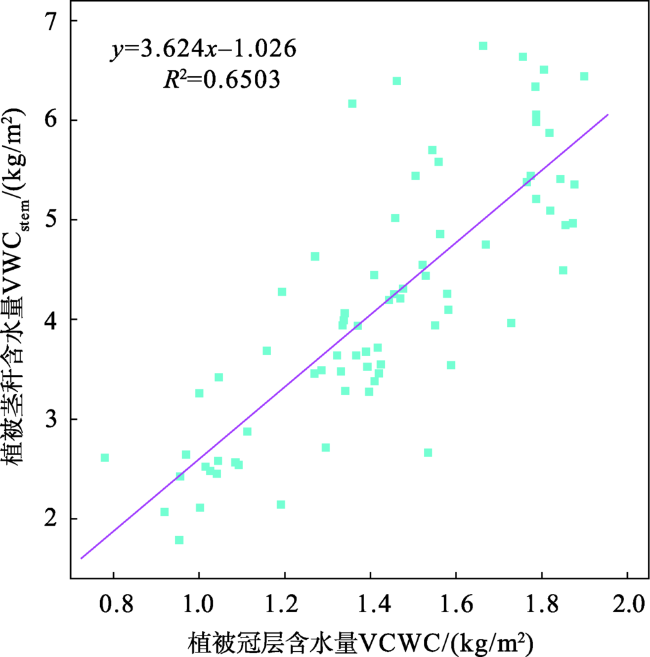
图4 Landsat8植被指数与实测植被冠层含水量相关性Fig. 4 Relationship between vegetation indices from Landsat8 data and measured vegetation canopy water content |
表6 Landsat8植被指数拟合精度Tab. 6 Fitting accuracy of each vegetation index from Landsat8 data |
| 植被指数 | 拟合公式 | R2 | RMSE/(kg/m2) |
|---|---|---|---|
| MSI | y=-25.57x2+19.88x-2.131 | 0.6349 | 0.6637 |
| NDWI5 | y=-12.96x2+13.26x-1.589 | 0.7433 | 0.5146 |
| NDWI7 | y=-23x2+33.39x-10.39 | 0.7018 | 0.5521 |
| NMDI | y=-74.16x2+73.16x-16.31 | 0.6082 | 0.6982 |
注:y为实测植被冠层含水量,x为植被指数。 |
| [1] |
贾艳昌, 谢谟文, 姜红涛 , 等. 全球36 km格网土壤水分逐日估算[J]. 地球信息科学学报, 2017,19(6):854-860.
[
|
| [2] |
王安琪, 施建成, 阿多 , 等. 光学信息分解被动微波土壤湿度方法[J]. 地球信息科学学报, 2012,14(5):652-657.
[
|
| [3] |
|
| [4] |
|
| [5] |
|
| [6] |
|
| [7] |
|
| [8] |
|
| [9] |
余凡, 赵英时 . ASAR和TM数据协同反演植被覆盖地表土壤水分的新方法[J]. 中国科学:地球科学, 2011,41(4):532-540.
[
|
| [10] |
|
| [11] |
孔金玲, 李菁菁, 甄珮珮 , 等. 微波与光学遥感协同反演旱区地表土壤水分研究[J]. 地球信息科学学报, 2016,18(6):857-863.
[
|
| [12] |
中国资源卫星应用中心[EB/OL].( http://www.cresda.com/CN/.
[China centre for resources satellite data and application[EB/OL]. ( http://www.cresda.com/CN/).]
|
| [13] |
美国地质调查局[EB/OL].( https://earthexplorer.usgs.gov/).
[ United states geological survey[EB/OL].( https://earthexplorer.usgs.gov/). ]
|
| [14] |
陈鲁皖, 韩玲, 王文娟 , 等. 地表组合粗糙度不确定性引起的SAR反演土壤水分的不确定性分析[J]. 地球信息科学学报, 2018,20(1):108-118.
[
|
| [15] |
|
| [16] |
|
| [17] |
|
| [18] |
|
| [19] |
|
| [20] |
|
| [21] |
|
| [22] |
张佳华, 许云, 姚凤梅 , 等. 植被含水量光学遥感估算方法研究进展[J]. 中国科学:技术科学, 2010,40(10):1121-1129.
[
|
| [23] |
|
| [24] |
|
| [25] |
|
| [26] |
|
| [27] |
|
| [28] |
|
| [29] |
蒋金豹, 张玲, 崔希民 , 等. 植被覆盖区土壤水分反演研究——以北京市为例[J]. 国土资源遥感, 2014,26(2):27-32.
[
|
| [30] |
|
| [31] |
王春梅, 余涛, 孟庆岩 , 等. 基于全极化雷达数据反演夏玉米覆盖农田表层土壤含水量[J]. 水资源与水工程学报, 2014,25(2):29-34.
[
|
/
| 〈 |
|
〉 |