
基于地理神经网络加权回归的中国PM2.5浓度空间分布估算方法
收稿日期: 2019-09-22
要求修回日期: 2019-10-27
网络出版日期: 2020-04-08
基金资助
国家自然科学基金项目(41871287)
国家自然科学基金项目(41701436)
国家重点研发计划项目(2018YFB0505000)
中央高校基本科研业务费专项资金(2019QNA3013)
版权
Estimating Ground-Level PM2.5 Concentrations Across China Using Geographically Neural Network Weighted Regression
Received date: 2019-09-22
Request revised date: 2019-10-27
Online published: 2020-04-08
Supported by
National Natural Science Foundation of China(41871287)
National Natural Science Foundation of China(41701436)
National Key Research and Development Program of China(2018YFB0505000)
Fundamental Research Funds for the Central Universities(2019QNA3013)
Copyright
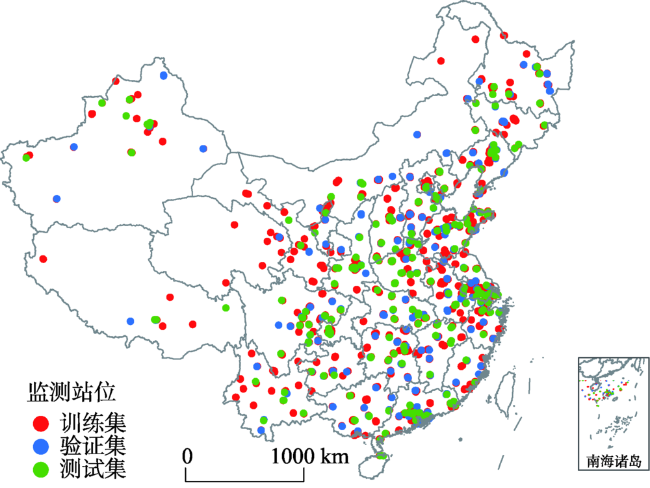
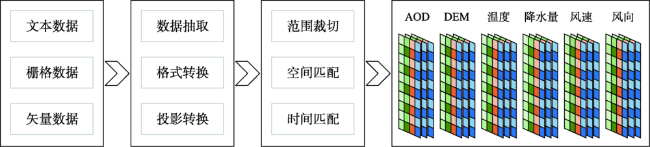
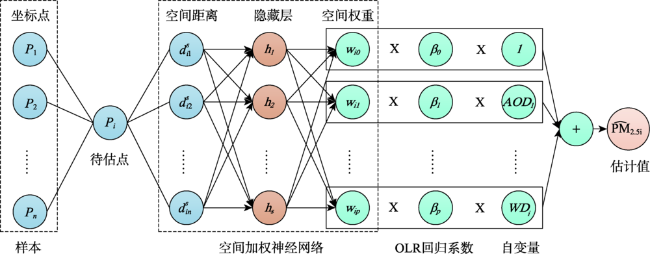
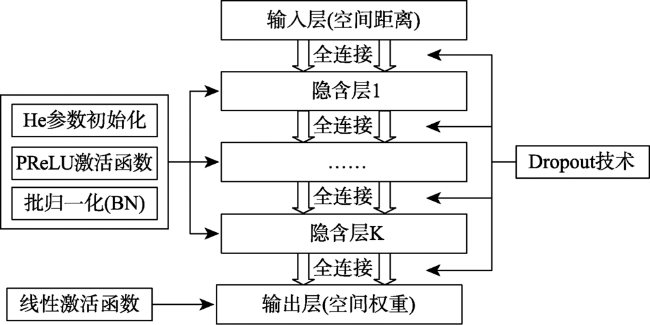
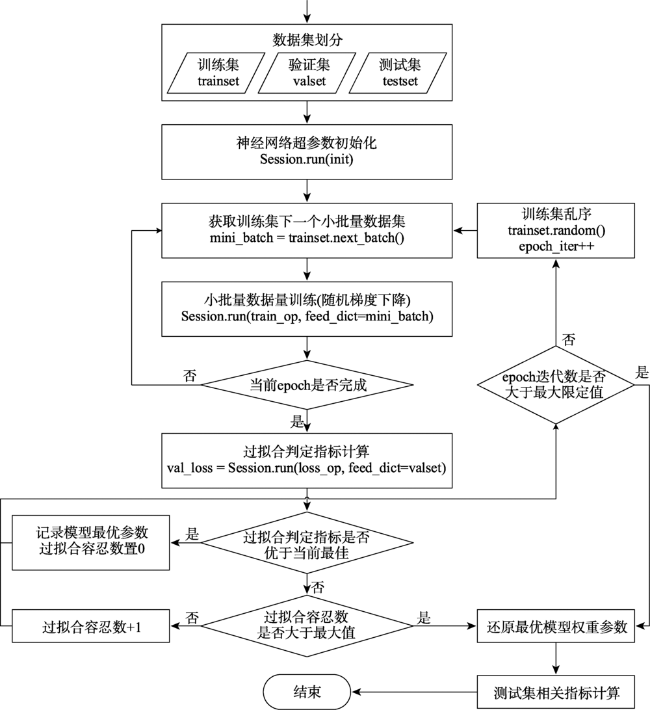
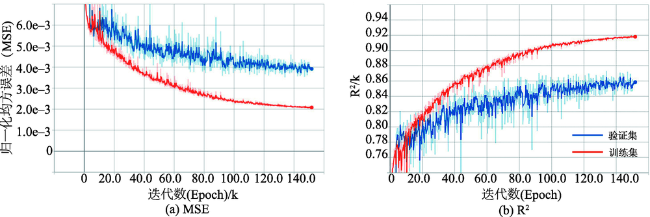
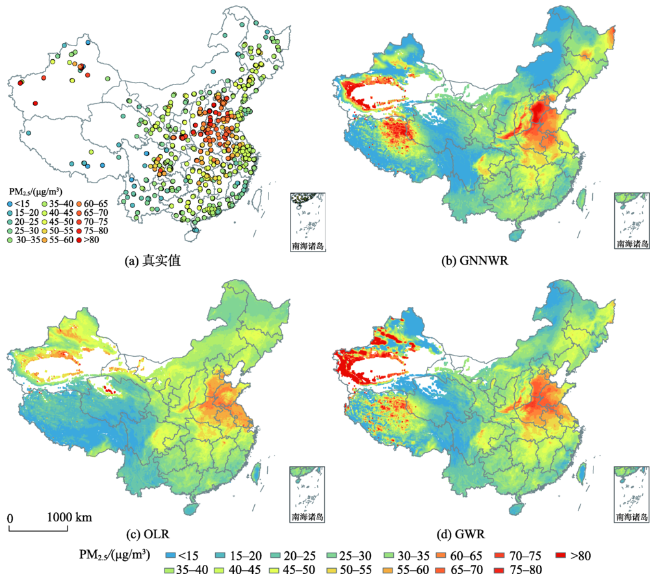
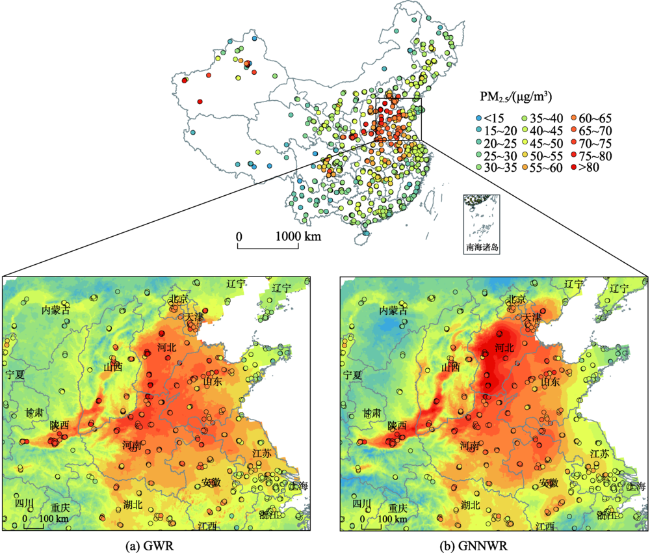
中国空气污染问题日益严重,为获得连续的PM2.5浓度空间分布,现有研究建立了多种基于统计回归的PM2.5估算模型。然而,由于PM2.5回归关系显著的空间非平稳性和复杂的非线性特征,如何实现高精度、高合理性的PM2.5浓度空间大面估计仍然面临挑战,尤其在地形变化复杂、覆盖范围广阔的中国地区更为突出。本文引入了一种将普通线性回归(OLR)和神经网络结合的地理神经网络加权回归(GNNWR)模型,通过集成遥感数据、气象数据和地理信息数据建立了基于GNNWR的PM2.5浓度空间估算方法。文章以中国2017年PM2.5年平均浓度估算为例,开展了该模型与OLR、地理加权回归(GWR)的比较实验。实验结果表明,基于GNNWR的PM2.浓度估算性能指标均明显优于OLR和GWR,且预测精度显著高于GWR。此外,GNNWR获得的PM2.5浓度空间分布也更为合理,较为细致地刻画了中国地区PM2.5浓度的局部空间变化和细节层次。

杜震洪 , 吴森森 , 王中一 , 汪愿愿 , 张丰 , 刘仁义 . 基于地理神经网络加权回归的中国PM2.5浓度空间分布估算方法[J]. 地球信息科学学报, 2020 , 22(1) : 122 -135 . DOI: 10.12082/dqxxkx.2020.190533
China is becoming one of the most air-polluted countries and is experiencing severe PM2.5 pollution. To acquire spatially continuous PM2.5 estimates, numerous statistical methods have been developed through the integration of ground-level measurements and satellite-based observations. The estimation of PM2.5 concentrations in China is characterized by significant spatial nonstationarity and complex nonlinearity due to the complicated terrain variability and wide geographical scope. Mapping the PM2.5 distributions across China with high accuracy and reasonable details is still challenging. Superior satellite-based PM2.5 estimation models need to be developed. Taking advantage of a newly proposed Geographically Neural Network Weighted Regression (GNNWR) model that simultaneously accounts for spatial nonstationarity and complex nonlinearity, we developed a satellite-based GNNWR model to obtain spatially continuous PM2.5 estimates in China. To comprehensively assess the predictive power of the GNNWR model, the widely used Ordinary Linear Regression (OLR) and Geographically Weighted Regression (GWR) models were also carried out for performance comparison. Experimental results demonstrated that the GNNWR model performed considerably better than the OLR and GWR models in terms of multiple statistical indicators, including coefficient of determination (R 2), Root Mean Square Error (RMSE), Mean Absolute Error (MAE), and Mean Absolute Percentage Error (MAPE). Most notably, the fitting accuracy of GNNWR was slightly better than GWR, but its prediction ability was much superior to GWR since the predictive R 2of GWR was significantly improved from 0.683 to 0.831 and the RMSE value was considerably reduced from 9.359 to 6.837. Moreover, the mapped PM2.5 distributions derived from the GNNWR model presented more reasonable and finer details at a higher accuracy than the other models. Although the spatial trends estimated by GWR and GNNWR models were quite consistent, the estimates of the GNNWR model were more accurate and reasonable since its values were much closer to the ground monitoring observations than those of the GWR model, especially for areas with high PM2.5 concentrations, such as Hebei Province and southern Shaanxi Province. In addition, thanks to the excellent learning ability of the neural network, the spatial variations in GNNWR estimates were more sophisticated and displayed a richer hierarchical structure of local changes than that of GWR estimates, which better described the varying details of the PM2.5 across China. In summary, the GNNWR model is a reliable method to effectively estimate PM2.5 concentrations and can also be used to model various air pollution parameters.
表1 实验数据信息与来源Tab. 1 Data sources and description |
| 数据类型 | 数据名称 | 变量名称 | 时间分辨率 | 空间分辨率 | 数据来源 |
|---|---|---|---|---|---|
| 站点 | PM2.5监测站点 | PM2.5 | h | - | 中国国家气象局 |
| 遥感 | 气溶胶 | AOD | d | 3 km、10 km | LAADS |
| 气象 | 2 m温度 | TEMP | h | 0.5° | ERA5 hourly data |
| 降水量 | TP | h | 0.5° | ERA5 hourly data | |
| 10 m风速 | WS | h | 0.5° | ERA5 hourly data | |
| 10 m风向 | WD | h | 0.5° | ERA5 hourly data | |
| 地理 | 地形 | DEM | - | 1弧分 | NOAA |
表2 GWR模型设置Tab. 2 Settings of GWR models |
| 模型 名称 | 带宽优化 准则 | 核函数 | |
|---|---|---|---|
| 类型 | 结构 | ||
| GWR-AFG | AICc | 固定型 | Gaussian |
| GWR-AAB | AICc | 适应型 | Bi-square |
表4 2017年中国年平均PM2.5与自变量因子的相关性分析与描述性统计分析Tab. 4 Exploratory analysis and descriptive statistics of the experimental dataset across China in 2017 |
| 变量 | PM2.5/ | AOD | DEM | 温度/ | 降水量/ | 风速/ | 风向/° |
|---|---|---|---|---|---|---|---|
| 相关系数 | - | 0.564 | -0.345 | 0.135 | -0.234 | -0.373 | -0.461 |
| 显著性水平 | - | 0.001 | 0.001 | 0.001 | 0.001 | 0.001 | 0.001 |
| 方差膨胀因子 | - | 3.005 | 1.636 | 4.639 | 2.107 | 2.357 | 4.184 |
| 平均值 | 46.07 | 0.540 | 393.460 | 288.000 | 8.95E-05 | 7.080 | 147.990 |
| 标准差 | 15.56 | 0.180 | 658.460 | 5.170 | 4.82E-05 | 0.940 | 43.150 |
| 最小值 | 8.34 | 0.070 | -5.250 | 271.810 | 1.06E-06 | 4.430 | 80.110 |
| 最大值 | 103.89 | 1.140 | 4539.960 | 297.720 | 2.34E-04 | 11.500 | 236.040 |
表5 OLR,GWR和GNNWR模型的PM2.5拟合和预测结果Tab. 5 Fitting and prediction performances of the PM2.5 estimates for the OLR, GWR, and GNNWR models |
| 模型 | 训练集(拟合精度) | 测试集(预测精度) | ||||||||||
|---|---|---|---|---|---|---|---|---|---|---|---|---|
| R2 | RMSE | MAE | MAPE/% | AICc | F1 | p-value | R2 | RMSE | MAE | MAPE/% | ||
| OLR | 0.517 | 10.578 | 8.132 | 20.2 | 7579.202 | - | - | 0.477 | 12.023 | 8.838 | 19.7 | |
| GWR-AFG | 0.759 | 7.478 | 5.797 | 14.5 | 6999.491 | 0.538 | 0.010 | 0.683 | 9.359 | 6.963 | 16.1 | |
| GWR-AAB | 0.898 | 4.860 | 3.478 | 8.7 | 6673.537 | 0.297 | 0.010 | 0.675 | 9.484 | 5.423 | 12.6 | |
| GNNWR | 0.914 | 4.452 | 3.235 | 7.9 | 5833.002 | 0.137 | 0.010 | 0.831 | 6.837 | 4.688 | 11.0 | |
表6 GNNWR模型自变量回归系数的空间非平稳性检验Tab. 6 Spatial nonstationarity diagnosis of each variable in the GNNWR model |
| 变量 | GWR-AFG | GWR-AAB | GNNWR | |||||
|---|---|---|---|---|---|---|---|---|
| F2 | p-value | F2 | p-value | F2 | p-value | |||
| 常量项 | 2407.9 | 0.001 | 1269.1 | 0.001 | 590.5 | 0.001 | ||
| AOD | 1379.7 | 0.001 | 1199.4 | 0.001 | 243.7 | 0.001 | ||
| DEM | 1983.9 | 0.001 | 1272.2 | 0.001 | 146.7 | 0.001 | ||
| 温度 | 3783.7 | 0.001 | 1229.6 | 0.001 | 127.7 | 0.001 | ||
| 降水量 | 1237.4 | 0.001 | 1170.1 | 0.001 | 214.7 | 0.001 | ||
| 风速 | 1626.0 | 0.001 | 1016.2 | 0.001 | 159.0 | 0.001 | ||
| 风向 | 2379.8 | 0.001 | 1081.6 | 0.001 | 73.6 | 0.001 | ||
| [1] |
中华人民共和国生态环境部. 2017中国生态环境状况公报[P]. 北京: 2018.
[ Ministry of Ecological Environment of the People's Republic of China, Ecological Environment Bulletin of China in 2017[P]. Beijing: 2018. ]
|
| [2] |
|
| [3] |
|
| [4] |
|
| [5] |
蒲强, 邹滨, 翟亮 , 等. 集成多源遥感数据的PM2.5浓度空间分布制图[J]. 地球信息科学学报, 2016,18(12):1717-1724.
[
|
| [6] |
|
| [7] |
|
| [8] |
|
| [9] |
|
| [10] |
李啸天, 吴绍华, 徐于月 , 等. 江苏省PM2.5质量浓度的时空变化格局模拟[J]. 环境监测管理与技术, 2017,29(2):16-20.
[
|
| [11] |
邹雨轩, 吴志峰, 曹峥 . 耦合土地利用回归与人口加权模型的PM2.5暴露风险评估[J]. 地球信息科学学报, 2019,21(7):1018-1028.
[
|
| [12] |
|
| [13] |
|
| [14] |
|
| [15] |
|
| [16] |
|
| [17] |
|
| [18] |
|
| [19] |
赵阳阳, 刘纪平, 杨毅 , 等. 一种协同时空地理加权回归PM2.5浓度估算方法[J]. 测绘科学, 2016,41(12):172-178.
[
|
| [20] |
|
| [21] |
|
| [22] |
|
| [23] |
|
| [24] |
|
| [25] |
|
| [26] |
|
| [27] |
|
| [28] |
|
| [29] |
符海月, 张祎婷 . 时间尺度重构EEMD-GRNN改进模型预测PM2.5的研究[J]. 地球信息科学学报, 2019,21(7):1132-1142.
[
|
| [30] |
吴森森 . 地理时空神经网络加权回归理论与方法研究[D]. 杭州:浙江大学, 2018.
[
|
| [31] |
China National Environmental Monitoring Centre[EB/OL]. http://www.cnemc.cn
|
| [32] |
LAADS DAAC[EB/OL]. https://ladsweb.modaps.eosdis.nasa.gov
|
| [33] |
ETOPO1 Global Relief Model[EB/OL]. https://www.ngdc.noaa.gov/mgg/global/global.html
|
| [34] |
ERA5 hourly data[EB/OL]. https://cds.climate.copernicus.eu
|
| [35] |
|
| [36] |
|
| [37] |
|
| [38] |
|
| [39] |
|
| [40] |
|
| [41] |
|
/
| 〈 |
|
〉 |