
DMSP/OLS稳定夜间灯光影像在中国的分类校正方法
|
曹子阳(1988— ),男,山东济宁人,博士,工程师,主要从事城市遥感、交通遥感应用研究。E-mail: caoziyang@cttic.cn |
收稿日期: 2019-05-24
要求修回日期: 2019-11-02
网络出版日期: 2020-04-13
基金资助
国家重点研发计划项目(2017YFC1405004)
国家重点研发计划项目(2017YFB0503804)
版权
A Method for Classified Correction of Stable DMSP/OLS Nighttime Light Imagery Across China
Received date: 2019-05-24
Request revised date: 2019-11-02
Online published: 2020-04-13
Supported by
National Key Research and Development Program of China(2017YFC1405004)
National Key Research and Development Program of China(2017YFB0503804)
Copyright
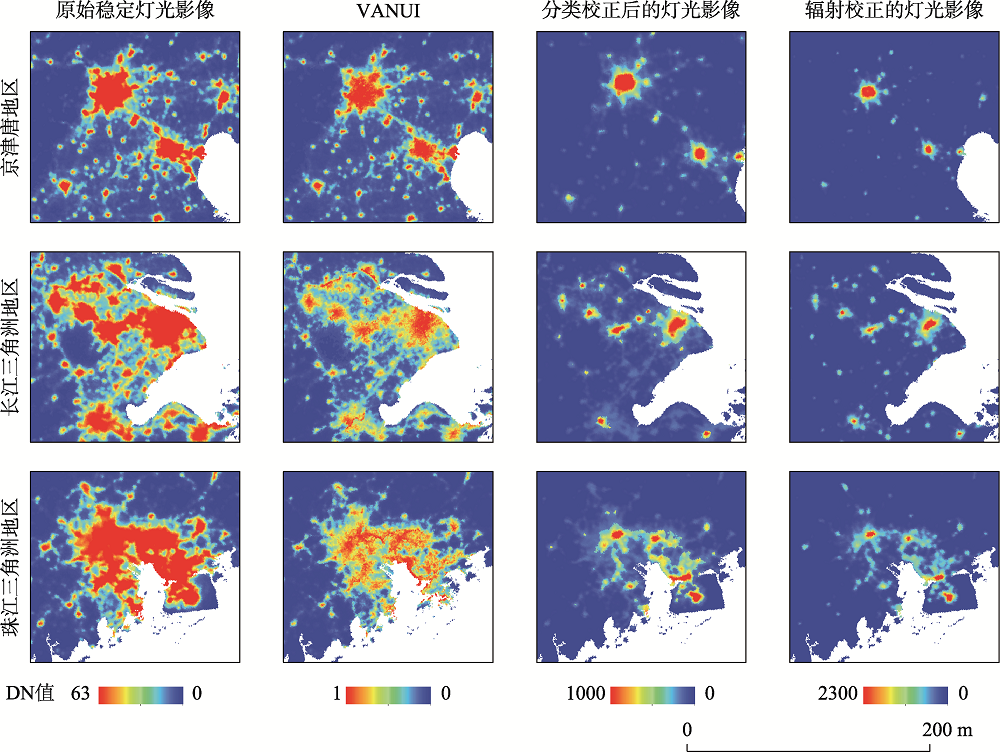
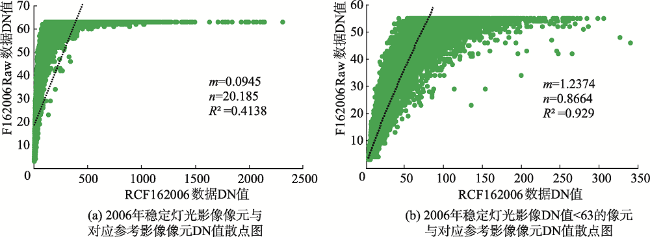
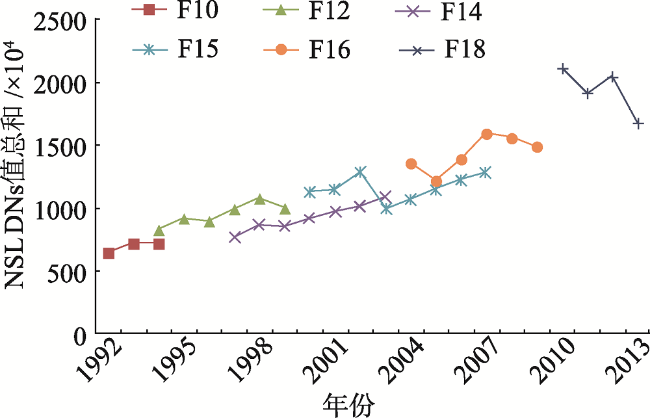
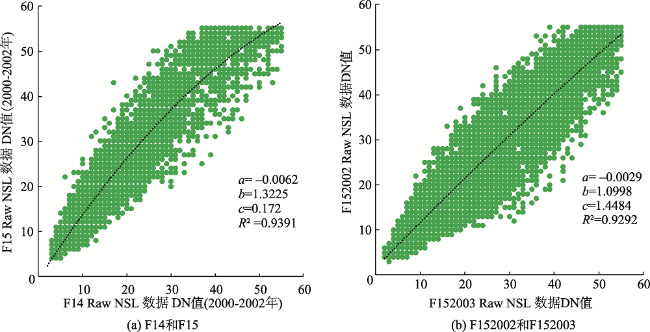
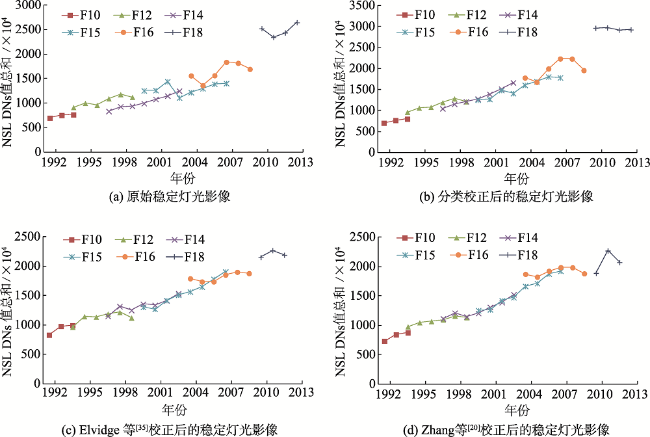
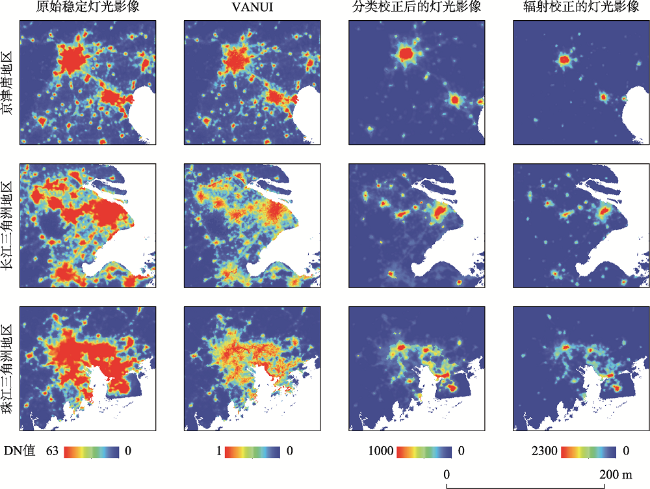
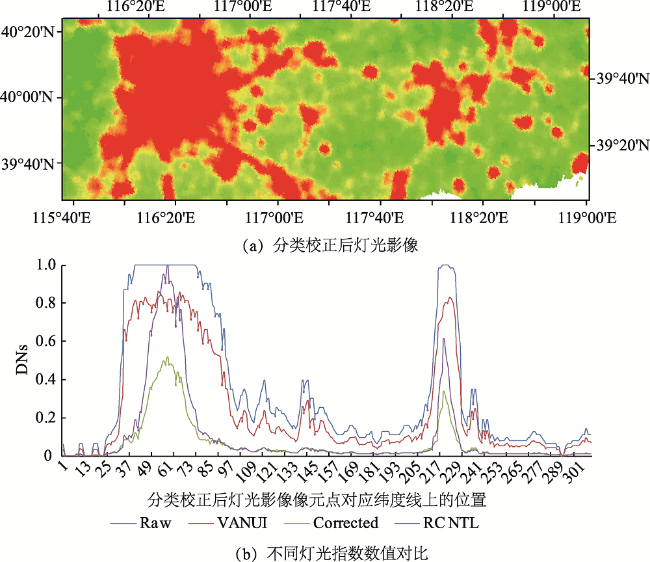
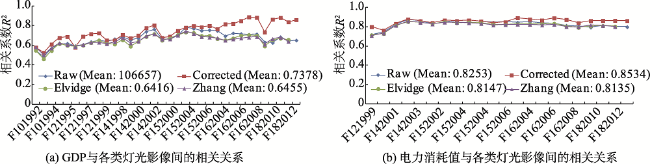
长时间序列DMSP/OLS夜间稳定灯光影像数据集存在饱和像元大量积聚在城市中心区域及影像之间缺少可比性的问题,导致数据集在进行空间分析及时间对比研究时会受到限制。为解决上述2个问题,本文在现有研究的基础上提出了一种基于不变目标区域的中国稳定灯光影像分类校正方法。该方法对数据集中每一期中国区域稳定灯光影像进行了饱和及非饱和像元的分类。对饱和像元,选择北京等5个城市作为不变目标区域,选择不存在饱和像元的辐射校准的灯光影像作为参考,基于不变目标区域的非饱和像元之间的相关关系也同样适用于饱和像元的假设,对饱和像元进行了校正;同时,基于多期辐射校准的灯光影像之间存在的相互校准关系,对饱和校正后的饱和像元进行了相互校准。对于非饱和像元,选择了长沙等13个城市作为不变目标区域;根据稳定灯光影像中非饱和像元DN值总和随时间变化的总体趋势,确定了13期稳定灯光影像作为参考,其他多期影像基于不变目标区域中非饱和像元之间的相关关系进行了相互校准。为验证校正结果的准确性,多种相互校准和饱和校正方法被引入进行比较。本文提出的分类校正方法与另外2种相互校准方法相比对F10、F12和F14卫星影像校准效果更好,另外2种方法对F15和F16卫星影像的校准结果更好,3种方法总体上都实现了对数据集影像的相互校准且使校正后的影像具有了可比性。与经过植被指数校准后的城市夜间灯光指数(The Vegetation Adjusted NTL Urban Index,VANUI)相比,分类校正方法解决了饱和像元聚集于城市中心区域的问题,减弱了像元饱和程度,校正结果更接近辐射校准的灯光影像。此外,在中国城市水平上,分类校正的稳定灯光影像与GDP和电力消耗值的相关关系与其他2种相互校准方法相比也是相对较好的,能更客观合理地反映区域经济发展的差异。
曹子阳 , 吴志峰 , 米素娟 , 阳柯 . DMSP/OLS稳定夜间灯光影像在中国的分类校正方法[J]. 地球信息科学学报, 2020 , 22(2) : 246 -257 . DOI: 10.12082/dqxxkx.2020.190253
Long-time series stable DMSP/OLS nighttime light data lack comparability and include a lot of saturated pixels in the bright cores of urban areas. The two problems have limited applications of the dataset in spatial analysis and temporal comparison. To help address the two problems, this article developed a classified correction method for Stable Nighttime Light (SNL) imagery across China by using invariant regions for calibration. The SNL images are divided into saturated pixels and unsaturated pixels. For saturated pixels, five cities such as Beijing were selected as the invariant regions, and the radiance calibrated nighttime light images (RCNTL) without saturated pixels were selected as the reference. Based on the assumption that the correlation between unsaturated pixels of the invariant regions could also be applied to saturated pixels, the reference images were used to correct saturated pixels of the SNL images. Meanwhile, the saturation corrected saturated pixels were calibrated based on the interclibration relationship between the different RCNTL images. For unsaturated pixels, 13 cities including Changsha were selected as the invariant regions. According to the overall time change trend of the sum of the unsaturated pixel values, the 13 SNL images were determined as the references, and other SNL images were intercalibrated based on the correlation between unsaturated pixels in the invariant regions. To validate the accuracy of the calibration results, a variety of intercalibration and saturation correction methods were adopted for comparison. The classified correction method proposed in this paper was found better for the calibration of F10, F12 and F14 satellite imagery than the other two intercalibration methods. The other two methods had better calibration results for F15 and F16 satellite imagery. The three methods generally achieve intercalibration of the dataset imagery and make the intercalibrated images comparable. Compared with the Vegetation Adjusted NTL Urban Index (VANUI), the saturation correction result of the classified correction method solves the problem that the saturated pixels concentrate in the central area of cities. The result reduces the saturation of the pixels and is a closer fit to the RCNTL images. Besides, the corrected SNL images have relatively good correlations with GDP and power consumption values, and can reflect regional economic development differences more objectively.
表1 中国稳定灯光影像非饱和像元的DN值总和与年份的指数相关系数大于0.9的城市Tab. 1 Chinese cities with the index correlation coefficient between the total DN value of unsaturated pixels in the SNL images and years over 0.9 |
| 城市 | R2 | 城市 | R2 | 城市 | R2 | 城市 | R2 |
|---|---|---|---|---|---|---|---|
| 拉萨市 | 0.9673 | 德宏州 | 0.9347 | 宁波市 | 0.9185 | 台州市 | 0.9103 |
| 延安市 | 0.9580 | 黄山市 | 0.9335 | 迪庆州 | 0.9178 | 梧州市 | 0.9091 |
| 克孜州 | 0.9541 | 甘南州 | 0.9309 | 威海市 | 0.9176 | 苏州市 | 0.9089 |
| 凉山州 | 0.9538 | 临沧市 | 0.9300 | 绍兴市 | 0.9171 | 普洱市 | 0.9088 |
| 怒江州 | 0.9503 | 遂宁市 | 0.9298 | 重庆市 | 0.9169 | 贺州市 | 0.9080 |
| 舟山市 | 0.9469 | 海南州 | 0.9280 | 银川市 | 0.9162 | 南充市 | 0.9078 |
| 金华市 | 0.9434 | 杭州市 | 0.9279 | 资阳市 | 0.9157 | 抚州市 | 0.9071 |
| 长沙市 | 0.9422 | 和田地区 | 0.9271 | 固原市 | 0.9147 | 上饶市 | 0.9068 |
| 喀什地区 | 0.9422 | 保山市 | 0.9261 | 中卫市 | 0.9141 | 西双版纳州 | 0.9068 |
| 成都市 | 0.9392 | 博尔塔拉州 | 0.9246 | 铜仁地区 | 0.9124 | 赣州市 | 0.9060 |
| 文山州 | 0.9385 | 昌都地区 | 0.9242 | 惠州市 | 0.9119 | 嘉兴市 | 0.9043 |
| 石河子市 | 0.9371 | 丽水市 | 0.9220 | 嘉峪关市 | 0.9113 | 河源市 | 0.9017 |
| 西宁市 | 0.9349 | 锡林郭勒盟 | 0.9194 | 永州市 | 0.9111 | 桂林市 | 0.9016 |
| 甘孜州 | 0.9348 | 丽江市 | 0.9190 | 厦门市 | 0.9109 | 酒泉市 | 0.9010 |
表2 稳定灯光影像对应的参考影像Tab. 2 Representative reference images for raw SNL images |
| 辐射校准的 灯光影像 | 混合的稳定 灯光影像 | 待校正稳定 灯光影像 |
|---|---|---|
| F12_1996 | F12_1997 | F10_1992-1994, F12_1994-1999 |
| F12_1999 | F14_1999 | F14_1997-2003 |
| F12-F15_2000 | F15_2000 | F15_2000-2007 a |
| F14-F15_2003 | F15_2003 | |
| F14_2004 | F15_2004 | |
| F16_2006 | F16_2006 | F16_2004-2009 |
| F16_2010 | F18_2010 | F18_2010-2013 b |
| F16_2010-2011 | F18_2010 |
注:a表示F15卫星获取的稳定灯光影像对应的参考影像有3期;b表示F18卫星获取的稳定灯光影像对应的参考影像有2期。 |
表3 每一期稳定灯光影像饱和像元的校正模型参数Tab. 3 Calibration model coefficients for saturated pixels of each stable nighttime light image |
| 稳定灯光影像 | d | e | R2 | 稳定灯光影像 | d | e | R2 |
|---|---|---|---|---|---|---|---|
| F101992 | 1.6058 | 0.7209 | 0.8261 | F152001 | 1.7151 | 0.6638 | 0.8790 |
| F101993 | 1.4223 | 0.7706 | 0.8892 | F152002 | 1.6428 | 0.7099 | 0.8848 |
| F101994 | 1.2326 | 0.8284 | 0.8861 | F152003 | 0.9146 | 0.8068 | 0.9204 |
| F121994 | 1.5814 | 0.8405 | 0.8629 | F152004 | 0.8386 | 0.8766 | 0.9392 |
| F121995 | 1.3788 | 0.8840 | 0.9129 | F152005 | 0.9129 | 0.8569 | 0.9092 |
| F121996 | 1.2844 | 0.8915 | 0.9372 | F152006 | 0.9378 | 0.8610 | 0.9028 |
| F121997 | 1.2981 | 0.9312 | 0.9462 | F152007 | 1.1294 | 0.8048 | 0.8898 |
| F121998 | 1.4016 | 0.9209 | 0.9180 | F162004 | 1.2520 | 0.8496 | 0.9036 |
| F121999 | 1.3058 | 0.9414 | 0.8496 | F162005 | 1.1273 | 0.8424 | 0.9204 |
| F141997 | 1.2187 | 0.7903 | 0.8974 | F162006 | 1.2374 | 0.8664 | 0.9290 |
| F141998 | 1.2622 | 0.7917 | 0.9084 | F162007 | 1.3602 | 0.8881 | 0.9109 |
| F141999 | 1.0184 | 0.8740 | 0.9254 | F162008 | 1.3228 | 0.8969 | 0.8708 |
| F142000 | 1.1412 | 0.8477 | 0.9055 | F162009 | 1.8805 | 0.7539 | 0.8342 |
| F142001 | 1.3947 | 0.8358 | 0.8642 | F182010 | 1.9359 | 0.8480 | 0.8960 |
| F142002 | 1.1143 | 0.9249 | 0.8493 | F182011 | 1.3247 | 0.9173 | 0.8207 |
| F142003 | 1.1901 | 0.9357 | 0.8088 | F182012 | 1.9522 | 0.8100 | 0.8483 |
| F152000 | 1.7378 | 0.6493 | 0.8707 | F182013 | 1.8153 | 0.8430 | 0.7392 |
表4 辐射校准的灯光影像之间的相互校准参数Tab. 4 Coefficients adopted for intercalibration of RC NTL dataset |
| 辐射校准的灯光影像 | C0 | C1 | R2 |
|---|---|---|---|
| F12_1996 | 4.336 | 0.915 | 0.971 |
| F12_1999 | 1.423 | 0.780 | 0.980 |
| F12-F15_2000 | 3.658 | 0.710 | 0.980 |
| F14-F15_2002 | 3.736 | 0.797 | 0.980 |
| F14_2004 | 1.062 | 0.761 | 0.984 |
| F16_2006 | 0.000 | 1.000 | 1.000 |
| F16_2010 | 2.196 | 1.195 | 0.981 |
| F16_2010-2011 | -1.987 | 1.246 | 0.981 |
表5 不连续稳定灯光影像的非饱和像元相互校准系数Tab. 5 Coefficients adopted for intercalibration of unsaturated pixels in discontinuous images |
| 不连续稳定 灯光影像 | a | b | c | R2 |
|---|---|---|---|---|
| F101994 | 0.000 10 | 0.9158 | 0.7429 | 0.9456 |
| F121996 | -0.002 40 | 1.1846 | -0.6158 | 0.9481 |
| F121999 | -0.000 10 | 0.8944 | 0.8090 | 0.9299 |
| F141998 | -0.000 60 | 0.9030 | 0.5025 | 0.9026 |
| F162005 | -0.003 50 | 1.1887 | 0.0175 | 0.9198 |
| F162006 | -0.005 20 | 1.3614 | -1.1588 | 0.9671 |
| F162008 | -0.000 08 | 0.9654 | 0.3562 | 0.9698 |
| F162009 | -0.006 60 | 1.3758 | -1.7220 | 0.8883 |
| F182010 | -0.000 09 | 0.9353 | -0.4345 | 0.8884 |
| F182013 | -0.006 40 | 1.1823 | -0.0691 | 0.8417 |
| [1] |
|
| [2] |
|
| [3] |
|
| [4] |
|
| [5] |
|
| [6] |
|
| [7] |
|
| [8] |
|
| [9] |
ShiK,
|
| [10] |
|
| [11] |
|
| [12] |
|
| [13] |
|
| [14] |
|
| [15] |
|
| [16] |
|
| [17] |
张鹏强, 余旭初, 刘智 , 等. 多时相遥感图像相对辐射校准[J]. 遥感学报, 2006,10:339-344.
[
|
| [18] |
曹子阳, 吴志峰, 匡耀求 , 等. DMSP/OLS夜间灯光影像中国区域的校正及应用[J]. 地球信息科学学报, 2015,17(9):1092-1102.
[
|
| [19] |
|
| [20] |
|
| [21] |
|
| [22] |
|
| [23] |
|
| [24] |
|
| [25] |
|
| [26] |
吴健生, 李双, 张曦文 . 中国DMSP-OLS长时间序列夜间灯光遥感数据饱和校正研究[J]. 遥感学报, 2018,22(4):621-632.
[
|
| [27] |
国家统计局. 中国统计年鉴[M]. 北京: 中国统计出版社,1993-2014.
[
|
| [28] |
国家统计局. 中国城市统计年鉴[M]. 北京: 中国统计出版社, 1993-2014.
[
|
| [29] |
国家统计局. 中国区域经济统计年鉴[M]. 北京: 中国统计出版社, 2000-2014.
[
|
| [30] |
|
| [31] |
|
| [32] |
|
| [33] |
|
| [34] |
|
| [35] |
|
/
| 〈 |
|
〉 |