
车载LiDAR点云中道路绿化带提取与动态分析
|
李鹏鹏(1995— ),男,河南修武人,硕士,研究方向为3S集成与应用。E-mail: 576051721@qq.com |
收稿日期: 2019-04-28
要求修回日期: 2019-09-16
网络出版日期: 2020-04-13
基金资助
国家自然科学基金项目(41771491)
国家自然科学基金项目(41701597)
中国博士后科学基金(2018M642746)
版权
Road Green Belt Extraction and Dynamic Analysis based on Vehicle LiDAR Points Cloud
Received date: 2019-04-28
Request revised date: 2019-09-16
Online published: 2020-04-13
Supported by
National Natural Science Foundation of China(41771491)
National Natural Science Foundation of China(41701597)
China Postdoctoral Science Foundation(2018M642746)
Copyright
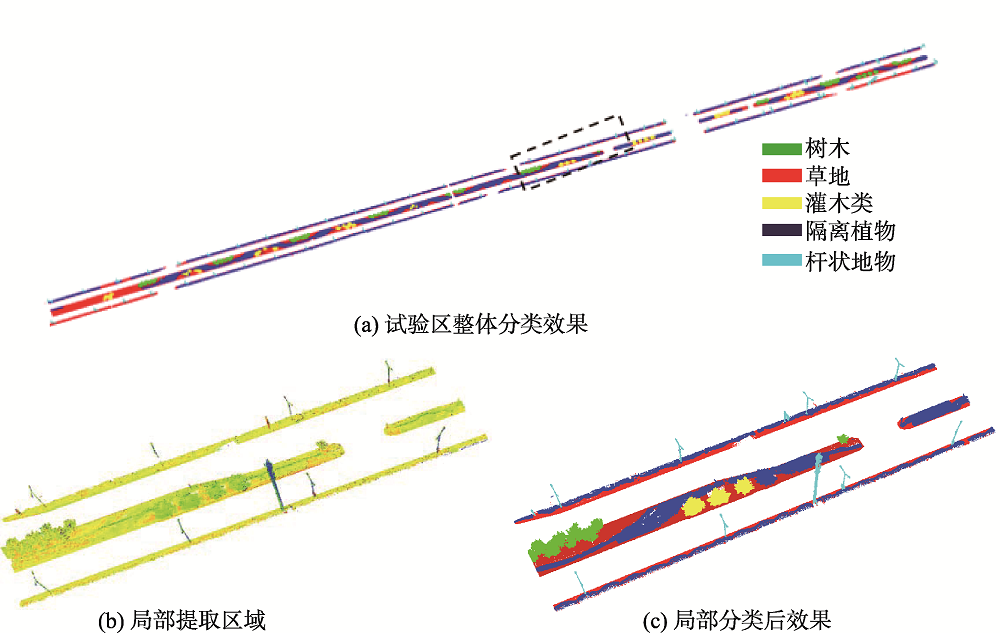
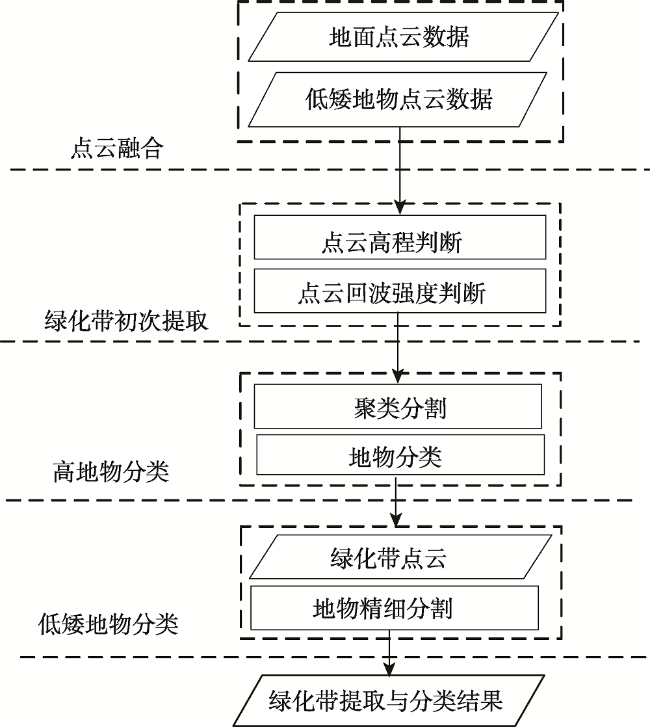
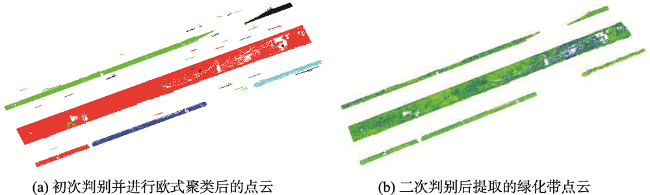
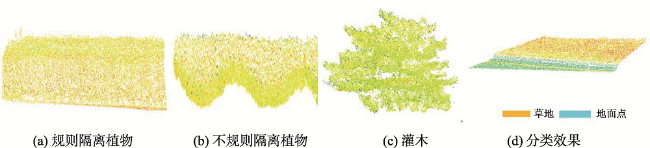
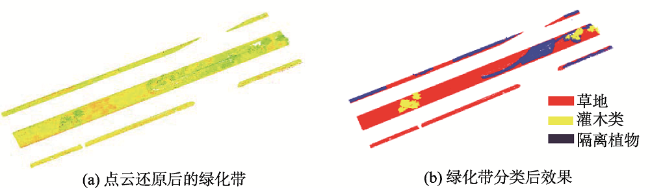
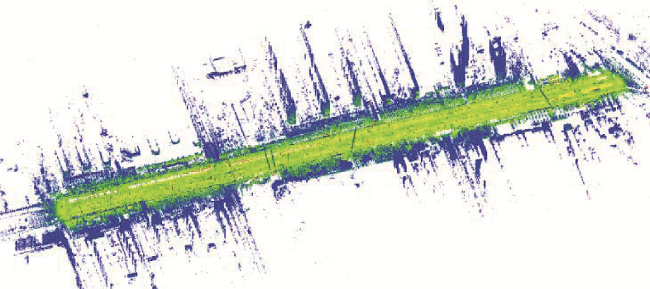
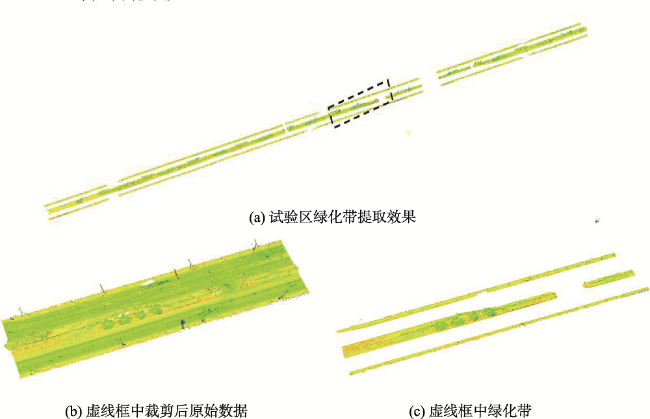
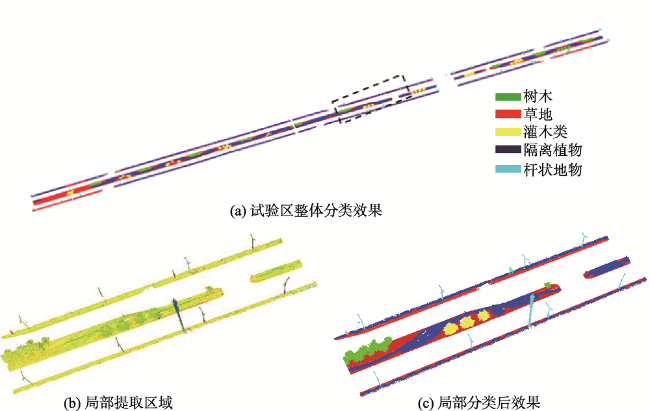
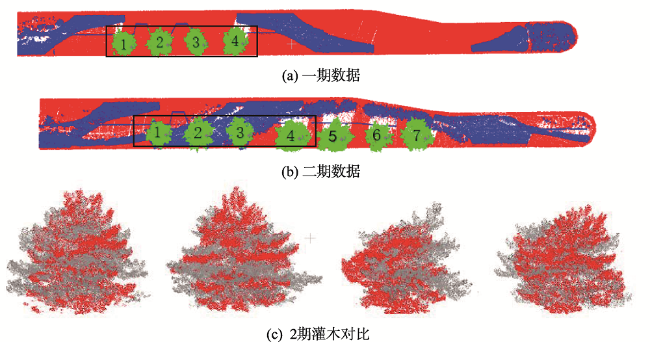
道路绿化带是城市园林绿地系统重要组成部分,具有重要的生态和环境服务功能,道路绿化带信息的精细分类与提取以及绿化带的动态分析对于道路信息化管理具有重要意义。本文提出基于车载LiDAR技术的道路绿化带自动提取与绿植地物精细分类算法。为验证算法有效性,选取北京市丰台区某路段作为实验区域,一期试验数据采集时间为2015年6月,二期试验数据采集时间为2015年9月。将车载LiDAR点云数据作为原始数据,对原始数据进行剪裁分块等预处理,提高算法运行速度。首先对每段道路点云数据进行地面、低矮地物与高地物分类,并将低矮地物与地面点进行组合;然后通过绿化带的点云特性与空间特征,精确提取出每段点云数据中的绿化带,根据所提取的绿化带确定分类范围,利用各类地物点云的特征差别,对绿化带内地物进行详细分类;最后对比同一区域内的多期绿化带数据,从而判断绿化带面积以及绿化带中的各种地物是否发生变化。为验证算法精度,采用人工交互的方式提取绿化带,并对绿化带内各类地物进行人工分类,以此作为参照将人工统计得到的信息与自动提取出的绿化带信息以及各个分类地物信息进行对比,试验区人工提取绿化带总面积为13 027 m 2,自动提取绿化带总面积为12 749 m 2,2组数据相差278 m 2,相对误差为0.02。自动分类算法在试验区场景中杆状地物的探测率为80%,树木的探测率81.81%,灌木探测率为73.91%。对比2期绿化带数据,发现面积缩减量为129.5 m 2,另外新增3株灌木。实验结果说明了本文所述算法的准确性。
李鹏鹏 , 李永强 , 蔡来良 , 董亚涵 , 范辉龙 . 车载LiDAR点云中道路绿化带提取与动态分析[J]. 地球信息科学学报, 2020 , 22(2) : 268 -278 . DOI: 10.12082/dqxxkx.2020.190196
Road green belt is an important part of urban green-land system, which not only can beautify the urban environment, but also has the function of organizing and maintaining urban traffic as well as other eco-environmental services. Fine classification and extraction of road green belt information and the dynamic analysis of green belts are of great significance to road management. Based on the vehicle LiDAR technology, this study proposd a algorithm for automatic extraction and fine classification of road green belts. To verify the effectiveness of the algorithm, a road section of Fengtai District, Beijing was selected as the experimental area. The data collection time of the first and second phase tests were June 2015 and September 2015, respectively. The vehicle LiDAR points cloud data were taking as the original data. To improve the speed of the algorithm, data points within a certain range on both sides of the road were reserved according to the GNSS track line. After removing the distant points cloud data and compressing the data amount, the reserved points cloud was preprocessed by clipping and partitioning. Firstly, ground, low ground features, and high ground features were classified for each section of the road points cloud data, and then low ground features and ground points were combined. Secondly, the green belts in each segment of the points cloud data were extracted according to the points cloud features and spatial characteristics of the green belt, and the extracted green belts were identified twice to improve extraction accuracy. Based on the extracted green belts, the classification scope was determined. Based on the different characteristics of the points clouds of various ground features, the high and low ground features in green belts were classified in detail. Finally, the data of multiple green belts in the same area were compared, so as to determine whether the green belt area and the types and quantities of various ground features in the green belts have changed, which provided data support to the garden and city management departments. To verify the accuracy of the proposed algorithm, the green belts were extracted by means of manual interaction, and all kinds of ground objects in the green belts were manually classified. Using these as reference, the artificial statistical information was compared with the automatically extracted green belts and the information of each classified ground features. The total green belt areas extracted by manual and automatic extraction in the experimental area were 13 027 and 12 749 m 2, respectively, with a difference of 278 m 2 between the two groups of data and a relative error of 0.02. In the scene of the experimental area, the detectivity of pole-like objects, trees, and shrubs by the automatic classification algorithm were 83.52%, 81.81%, and 73.91%, respectively. By comparing the two phases of green belt data, it was found that the area was reduced by 129.5 m 2, and three new shrubs were added. Our experimental findings suggest the high accuracy of the proposed algorithm.
表1 3种典型地物的上下投影示意Tab. 1 Top and bottom projections of three typical features |
| 地物 | 地物点云 | 上部投影示意 | 下部投影示意 |
|---|---|---|---|
| 行道树 |  |  |  |
| 电线杆 |  |  |  |
| 路灯 |  |  |  |
表2 2种方法计算绿化带面积结果对比Tab. 2 Comparing the results of calculating greenbelt area by the two methods |
| 地块编号 | S1/m2 | S2/m2 | S1-S2 | 相对误差 |
|---|---|---|---|---|
| 1 | 811 | 829 | -18 | -0.02 |
| 2 | 1792 | 1883 | -91 | -0.05 |
| 3 | 1350 | 1392 | -42 | -0.03 |
| 4 | 1401 | 1408 | -7 | -0.00 |
| 5 | 1378 | 1418 | -40 | -0.03 |
| 6 | 1335 | 1298 | 37 | 0.03 |
| 7 | 1422 | 1437 | -15 | -0.01 |
| 8 | 1208 | 1221 | -13 | -0.01 |
| 9 | 1526 | 1588 | -62 | -0.04 |
| 10 | 526 | 553 | -27 | -0.05 |
| 总和 | 12 749 | 13 027 | -278 | -0.02 |
表3 各类地物数量比对Tab.3 Comparison of the numbers of various feature types |
| 杆状地物 | 树木 | 灌木 | |
|---|---|---|---|
| 人工判读/个 | 85 | 66 | 46 |
| 算法提取/个 | 71 | 54 | 44 |
| 正确提取数/个 | 71 | 54 | 34 |
| 差值/个 | 14 | 12 | 10 |
| 提取正确率/% | 100 | 100 | 77.27 |
| 提取率/% | 83.52 | 81.81 | 73.91 |
表4 绿化带整体信息对比Tab. 4 Comparison of overall information of the green belts |
| 绿化带 | A(X1, Y1) | B(X2, Y2) | C(X3, Y4) | D(X4, Y4) | 面积/m2 |
|---|---|---|---|---|---|
| 一期数据 | (1.6, -98.8) | (1.6, -107.9) | (1130.7, -106.7) | (130.8, -98.8) | 879.3 |
| 二期数据 | (1.6, -98.9) | (1.6, -107.5) | (110.9, -106.8) | (110.6, -98.6) | 749.8 |
表5 绿化带各地物信息对比Tab. 5 Comparison of physical information in the green belts |
| 面积/m2 | 体积/m3 | 冠幅/m | ||||||
|---|---|---|---|---|---|---|---|---|
| 一期 | 二期 | 一期 | 二期 | 一期 | 二期 | |||
| 草地 | 762.3 | 509.2 | — | — | — | — | ||
| 灌木1 | — | — | 41.20 | 32.00 | 3.30 | 3.14 | ||
| 灌木2 | — | — | 45.50 | 39.70 | 3.54 | 3.68 | ||
| 灌木3 | — | — | 31.80 | 26.70 | 3.52 | 3.53 | ||
| 灌木4 | — | — | 40.65 | 47.70 | 3.82 | 4.26 | ||
表6 绿化带新增地物信息Tab 6 Additional landmark information in the green belts |
| 位置(X, Y) | 体积/m3 | 冠幅/m | |
|---|---|---|---|
| 灌木5 | (123.11, 69.61) | 42.6 | 4.12 |
| 灌木6 | (131.46, 69.51) | 29.9 | 3.44 |
| 灌木7 | (140.02, 69.45) | 39.7 | 4.18 |
| [1] |
陈雷, 张丽微, 杨善云 , 等. 夏冬两季城郊公路绿化带的降噪效果差异分析[J]. 环境工程学报, 2017,11(9):5320-5325.
[
|
| [2] |
张志永, 李全明, 南海龙 , 等. 北京平原地区公路典型绿化带降噪功能初探[J]. 林业科学研究, 2017,30(2):329-334.
[
|
| [3] |
刘潇忆, 牛雅琼, 文星星 , 等. 不同绿化带对城市道路噪声削减的影响[J]. 城市环境与城市生态, 2016,29(6):18-21.
[
|
| [4] |
范丽雅, 刘树华, 刘辉志 , 等. 绿化带对城市大气环境及空气质量的影响[J]. 气候与环境研究, 2006,11(1):85-93.
[
|
| [5] |
王斐, 刘艳红, 冯代丽 , 等. 城市绿地信息提取的研究进展[J]. 中国农学通报, 2017,33(10):67-71.
[
|
| [6] |
张邦俊, 胡芬, 黄有兴 , 等. 绿化带对交通噪声的衰减及对主观反应的影响[J]. 环境污染与防治, 1994,16(1):31-33.
[
|
| [7] |
鲍新雪, 王晓红, 吴丛 , 等. 基于ETM+影像的绿地信息提取方法研究[J]. 测绘工程, 2016,25(10):26-30.
[
|
| [8] |
杨柳, 陈延辉, 岳德鹏 , 等. 无人机遥感影像的城市绿地信息提取[J]. 测绘科学, 2017,42(2):59-64.
[
|
| [9] |
尹艳豹, 唐守正, 郎璞梅 , 等. 多回波机载LiDAR数据提取林地DEM的判别分析方法[J]. 林业科学, 2011,47(12):106-113.
[
|
| [10] |
|
| [11] |
|
| [12] |
余柏蒗, 刘红星, 吴健平 . 一种应用机载LiDAR数据和高分辨率遥感影像提取城市绿地信息的方法[J]. 中国图象图形学报, 2010,15(5):782-789.
[
|
| [13] |
张小飞, 王仰麟, 李正国 , 等. 三维城市景观生态研究[J]. 生态学报, 2007,27(7):2972-2982.
[
|
| [14] |
卢秀山, 李清泉, 冯文灏 , 等. 车载式城市信息采集与三维建模系统[J]. 武汉大学学报·工学版, 2003,36(3):76-80.
[
|
| [15] |
|
| [16] |
|
| [17] |
李海亭, 肖建华, 李艳红 , 等. 机器学习在车载激光点云分类中的应用研究[J]. 华中师范大学学报(自然科学版), 2015,49(3):460-464.
[
|
| [18] |
刘峰, 龚健雅 . 基于3D LiDAR数据的城区植被识别研究[J]. 地理与地理信息科学, 2009,25(6):5-8.
[
|
| [19] |
王昱 . 基于车载LiDAR数据和街景照片的街道美景度评价[D]. 南京:南京大学, 2016.
[
|
| [20] |
赵刚, 杨必胜 . 基于Gradient Boosting的车载LiDAR点云分类[J]. 地理信息世界, 2016,23(3):47-52.
[
|
| [21] |
喻亮 . 基于车载激光扫描数据的地物分类和快速建模技术研究[D]. 武汉:武汉大学, 2011.
[
|
| [22] |
|
| [23] |
李卉, 李德仁, 黄先锋 , 等. 一种渐进加密三角网LIDAR点云滤波的改进算法[J]. 测绘科学, 2009,34(3):39-40.
[
|
| [24] |
|
/
| 〈 |
|
〉 |