
规则格网DEM局地坡面凸凹性精度分析
|
王 春(1975— ),男,博士,教授,宁夏固原人,主要从事DEM数字地形分析与GIS集成应用技术研究。E-mail:wangchun93@126.com |
收稿日期: 2019-05-17
要求修回日期: 2019-08-25
网络出版日期: 2020-05-18
基金资助
国家自然科学基金项目(41571398)
国家自然科学基金项目(41201415)
国家自然科学基金项目(41501445)
安徽省自然科学基金项目(1408085MD77)
安徽省自然科学基金项目(1608085QD77)
版权
Accuracy Assessment of Local Slope Concave-convex Properties based on Multi-scale Gridded DEMs
Received date: 2019-05-17
Request revised date: 2019-08-25
Online published: 2020-05-18
Supported by
National Natural Science Foundation of China(41571398)
National Natural Science Foundation of China(41201415)
National Natural Science Foundation of China(41501445)
Anhui Provincial Natural Science Foundation(1408085MD77)
Anhui Provincial Natural Science Foundation(1608085QD77)
Copyright
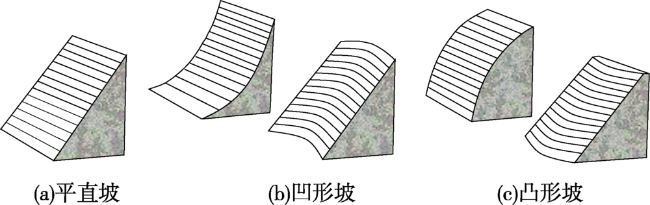
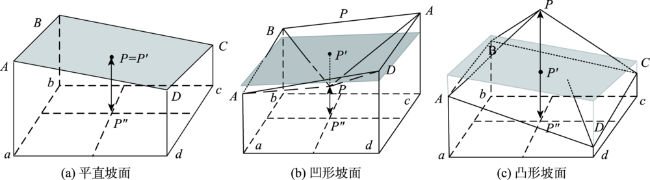
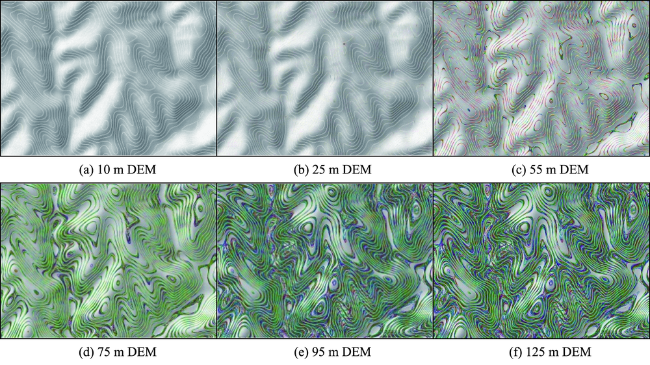
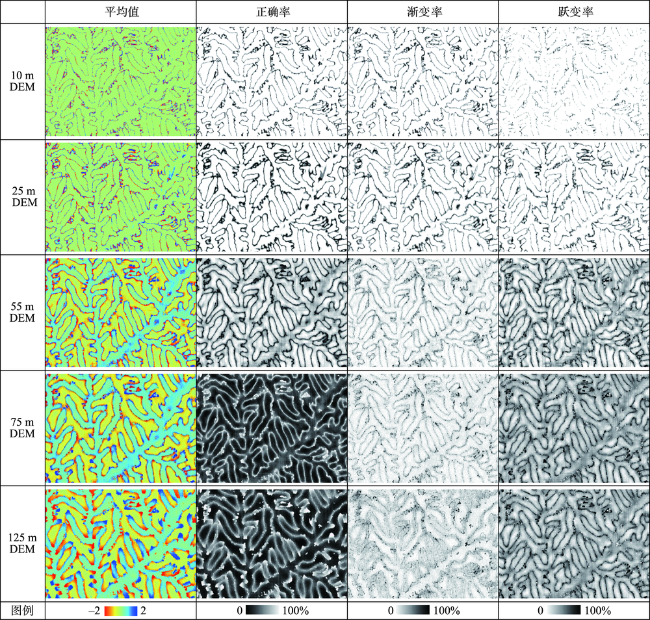
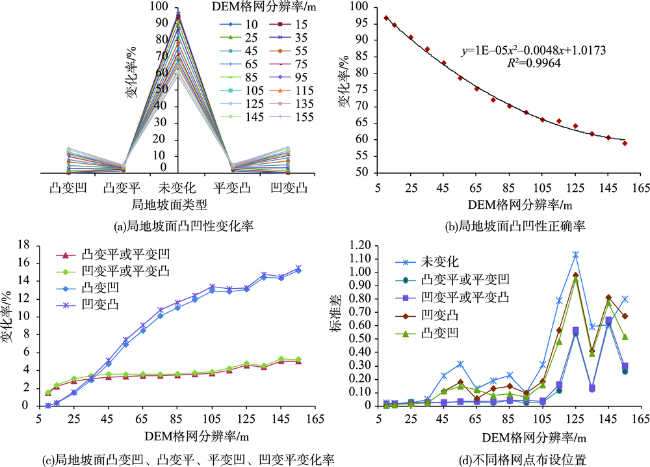
DEM地表形态精度分析理论与方法的建立,对DEM数据的生产和广泛应用具有重要意义。本文从局地坡面形态的凸凹性角度,剖析规则格网DEM格网点位置、格网分辨率对DEM局地坡面凸凹性的影响,以期进一步完善和发展DEM质量分析的理论与方法。论文首先阐述了DEM局地坡面凸凹性的基本概念,研究建立了规则格网DEM的局地坡面凸凹性量化分析方法,并以黄土丘陵5、10、15、25、……、155 m DEM为例,采用比较分析方法研究了局地坡面凸凹性随DEM格网点位置和格网分辨率的变化特征。研究表明:对于本研究中的1:5万DEM,10 m(跃变率≤ 0.3%)是其最佳的格网分辨率阈值,当DEM实际格网分辨率高于该阈值时,实际DEM与最佳格网分辨率DEM具有近乎相同的局地坡面凸凹性,主要在正地形与负地形的过渡区域会发生不同程度的坡面凸凹性变化;当DEM实际格网分辨率低于该阈值时,实际DEM的局地坡面凸凹性,会随着DEM格网点布设位置和DEM格网分辨率发生较大的不确定性变化。

王春 , 徐燕 , 江岭 , 赵明伟 . 规则格网DEM局地坡面凸凹性精度分析[J]. 地球信息科学学报, 2020 , 22(3) : 361 -369 . DOI: 10.12082/dqxxkx.2020.190235
The accuracy of DEMs is the key issue for its quality and various applications. Theoretically, terrain morphology is the basis to derive the topographic information. Therefore, to establish the methodology of DEM's morphologic accuracy can promote the high-quality DEM productions and their widespread applications. Focusing on the cognition of the local slope concave-convex property, this paper analyses the influences of grid point locations and grid cell sizes on this morphological property. As such, this paper arms to further improve and develop the theory and method of DEM quality. At first, this paper introduces the basic concept of terrain morphology accuracy represented by the gridded DEM, consisting of elevation sampling accuracy and elevation relation accuracy of local points, local slope morphology accuracy, regional terrain relation accuracy and global terrain structure accuracy. Herein, the local slope morphology accuracy can be represented by the local slope concave-convex property, including three categories of flat slope, concave slope and convex slope. To quantify the concave-convex property, the error metric is defined using the multi-scale DEMs and several statistic indexes of the error metric are presented. At last, taking loess hill region as the study area and 5、10、15、25、…、155 m DEMs generated by the TIN-based method as the experimental dataset, the comparative method is applied to investigate the characteristics of the local slope concave-convex slope varied with the grid-point location and the grid cell size. The main conclusions of this research are reached as follows: (1) the morphology accuracy of DEMs must be considered in the production of high-quality DEMs. In this study, 10 m size (jumping rate is equal or lesser than 0.3%) is optimal threshold of the grid cell size for 1:50 000 DEMs. (2) When the DEM resolution is higher than the threshold, the DEM has almost the same concave-convex property with the real topography, followed by the less changes in the transition area between the positive and negative terrains. When the resolution of DEM is lower than the threshold, the local slope concave-convex property would have a significant uncertainty changed with the grid-point location and the DEM resolution.
Key words: DEM; local slope; concave-convex; spatial relationship; terrain morphology; loess hill region; error; accuracy
表1 Etax_P值含义Tab. 1 Means of Etax_P |
| Etax_P值 | 代表含义 |
|---|---|
| 2 | 局地坡面形态由原来的凹形坡面变为凸形坡面 |
| 1 | 局地坡面形态由原来的凹形坡面变成平直坡面,或由原来的平直坡面变成凸形坡面 |
| 0 | 局地坡面形态没有变化 |
| -1 | 局地坡面形态由原来的凸形坡面变成平直坡面,或由原来的平直坡面变成凹形坡面 |
| -2 | 局地坡面形态由原来的凸形坡面变为凹形坡面 |
表2 DEM局地坡面形态凸凹性精度指标信息Tab. 2 Concave and convex accuracy indexes of local slope shapes |
| 序号 | 指标名称 | 计算公式 | 指标含义 | 公式编号 |
|---|---|---|---|---|
| 1 | 算数平均值 | 所有检测点凸凹性误差的平均值。主要反映与局地坡面形态凸凹性误差是否存在系统规律。Etax_i含义见表1,n为总检测点个数 | (3) | |
| 2 | 正确率值 | k0是所有检测点中凸凹性未发生改变的坡面个数,n为总检测点个数 | (4) | |
| 3 | 渐变率值 | k1是所有检测点中按照“凸平凹或凹平凸”次序,发生凸变平、平变凹、凹变平或平变凸等变化的坡面个数,n为总检测点个数 | (5) | |
| 4 | 跃变率值 | k2是所有检测点中从“凸平凹或凹平凸”次序,发生凸变凹或凹变凸变化的坡面个数,n为总检测点个数 | (6) |
表3 DEM局地坡面凸凹性精度指标Tab. 3 Concave and convex accuracy indexes of DEM local slope shapes |
| DEM格网 分辨率/m | 正确率/% | 渐变率/% | 跃变率/% | |||||
|---|---|---|---|---|---|---|---|---|
| 凹变平或平变凸 | 凸变平或平变凹 | 合计 | 凹变凸 | 凸变凹 | 合计 | |||
| 10 | 96.81±0.0236 | 1.55±0.0119 | 1.50±0.0178 | 3.05±0.0222 | 0.08±0.0019 | 0.07±0.0024 | 0.14±0.0033 | |
| 15 | 94.66±0.0192 | 2.37±0.0169 | 2.22±0.0165 | 4.58±0.0222 | 0.38±0.0077 | 0.38±0.0079 | 0.76±0.0090 | |
| 25 | 90.88±0.0263 | 3.09±0.0211 | 2.84±0.0308 | 5.93±0.0248 | 1.59±0.0177 | 1.50±0.0185 | 2.98±0.0206 | |
| 35 | 87.41±0.0367 | 3.41±0.0257 | 3.12±0.0218 | 6.53±0.0313 | 3.14±0.0173 | 2.92±0.0215 | 6.06±0.0216 | |
| 45 | 83.42±0.0600 | 3.58±0.0218 | 3.29±0.0255 | 6.87±0.0275 | 5.07±0.0281 | 4.65±0.0392 | 9.72±0.0563 | |
| 55 | 79.42±0.0986 | 3.59±0.0259 | 3.35±0.0272 | 6.94±0.0314 | 7.08±0.0401 | 6.56±0.0937 | 13.63±0.1027 | |
| 65 | 75.43±0.1292 | 3.61±0.0317 | 3.41±0.0298 | 7.02±0.0378 | 9.08±0.0557 | 8.47±0.1200 | 17.55±0.1151 | |
| 75 | 71.96±0.1499 | 3.56±0.0235 | 3.42±0.0197 | 6.99±0.0333 | 10.85±0.0976 | 10.20±0.0613 | 21.05±0.1409 | |
| 85 | 70.14±0.1951 | 3.63±0.0413 | 3.50±0.0383 | 7.12±0.0547 | 11.67±0.1313 | 11.07±0.0563 | 22.74±0.1696 | |
| 95 | 68.62±0.1023 | 3.78±0.0464 | 3.62±0.0264 | 7.40±0.0426 | 12.22±0.0958 | 11.76±0.0690 | 23.98±0.1183 | |
| 105 | 66.18±0.1775 | 3.86±0.0386 | 3.70±0.0305 | 7.56±0.0427 | 13.36±0.1314 | 12.89±0.1080 | 26.26±0.1451 | |
| 115 | 65.57±0.1695 | 4.19±0.0478 | 3.99±0.0495 | 8.18±0.0527 | 13.28±0.1289 | 12.97±0.0820 | 26.25±0.1567 | |
| 125 | 64.68±0.3153 | 4.72±0.0789 | 4.48±0.0634 | 9.20±0.1017 | 13.15±0.2207 | 12.98±0.1479 | 26.12±0.2512 | |
| 135 | 61.91±0.3243 | 4.58±0.0507 | 4.41±0.0509 | 8.99±0.0763 | 14.73±0.2135 | 14.38±0.1222 | 29.11±0.2769 | |
| 145 | 61.05±0.2989 | 5.17±0.0954 | 4.94±0.1247 | 10.11±0.2015 | 14.52±0.1501 | 14.33±0.1521 | 28.85±0.2212 | |
| 155 | 59.29±0.5449 | 5.44±0.1399 | 5.22±0.1362 | 10.65±0.2680 | 15.17±0.2515 | 14.88±0.1730 | 30.05±0.3604 | |
注:表中记录形式为K±m; k为25幅不同格网点布设位置的DEM,其不同类型局地坡面形态凸凹性精度指标的平均数;m为其最大波动范围。 |
| [1] |
胡海, 吴艳兰, 胡鹏 . 数字高程模型精度标准、质量理论和科学观念讨论[J]. 武汉大学学报·信息科学版, 2011,36(6):713-716.
[
|
| [2] |
王春, 刘学军, 汤国安 , 等. 格网DEM地形模拟的形态保真度研究[J]. 武汉大学学报·信息科学版, 2009,34(2):146-149.
[
|
| [3] |
王春, 汤国安, 戴仕宝 , 等. DEM地形描述误差场量化分析研究[J]. 武汉大学学报·信息科学版, 2014,39(9):1074-1079.
[
|
| [4] |
汤国安, 李发源, 刘学军 . 数字高程模型教程[M]. 北京: 科学出版社, 2010.
[
|
| [5] |
李志林, 朱庆 . 数字高程模型[M]. 武汉: 武汉大学出版社, 2000.
[
|
| [6] |
|
| [7] |
|
| [8] |
|
| [9] |
宋向阳, 吴发启 . 几种插值方法在微DEM构建中的应用[J]. 水土保持研究, 2010,17(5):45-50.
[
|
| [10] |
陈传法, 蔡乾广 . DEM快速构建的最小二乘配置法[J]. 武汉大学学报·信息科学版, 2013,38(1):86-89.
[
|
| [11] |
张锦明, 游雄, 万刚 . 径向基函数算法中插值参数对DEM精度的影响[J]. 武汉大学学报·信息科学版, 2013,38(5):608-612.
[
|
| [12] |
张彩霞, 杨勤科, 段建军 . 高分辨率数字高程模型的构建方法[J]. 水利学报, 2006,37(8):1009-1014.
[
|
| [13] |
王春, 江岭, 徐静 , 等. DEM地面形态重构方法的精度差异特征研究[J]. 地理与地理信息科学, 2014,30(4):18-21,26.
[
|
| [14] |
薛凯凯, 熊礼阳, 祝士杰 , 等. 基于DEM的黄土崾岘提取及其地形特征分析[J]. 地球信息科学学报, 2018,20(12):1710-1720.
[
|
| [15] |
王春, 顾留碗, 陶旸 , 等. DEM地形描述误差(Et)计算模型研究[J]. 地球信息科学学报, 2014,16(5):699-706.
[
|
| [16] |
柯正谊, 何建邦, 池天河 . 数字地面模型[M]. 北京: 科学出版社, 1993.
[
|
| [17] |
|
| [18] |
王光霞, 朱长青, 史文中 , 等. 数字高程模型地形描述精度的研究[J]. 测绘学报, 2004,33(2):168-173.
[
|
| [19] |
胡鹏, 杨传勇, 吴艳兰 , 等. 新数字高程模型–理论、方法、标准和应用[M] 北京: 测绘出版社, 2007.
[
|
| [20] |
|
| [21] |
|
| [22] |
王春, 李虎, 杨军生 , 等. 新型格网DEM等高线生成技术与方法[J]. 地球信息科学学报, 2015,17(2):160-165.
[
|
/
| 〈 |
|
〉 |