
面向复杂地形的坡位K-means聚类划分研究
|
高海峰(1995— ),男,江苏盐城人,硕士生,主要从事人工智能算法、空间数据挖掘和并行计算等研究。E-mail:gaohaifeng@hhu.edu.cn |
收稿日期: 2019-07-17
要求修回日期: 2019-09-13
网络出版日期: 2020-05-18
基金资助
云南省重大科技专项——新能源(2013ZB006)
国家自然科学基金项目(41071347)
版权
K-means Classifier for Automatic Slope Position Detection in Mountainous Areas
Received date: 2019-07-17
Request revised date: 2019-09-13
Online published: 2020-05-18
Supported by
Major Science and Technology Projects of Yunnan Province: New Energy(2013ZB006)
National Natural Science Foundation of China(41071347)
Copyright
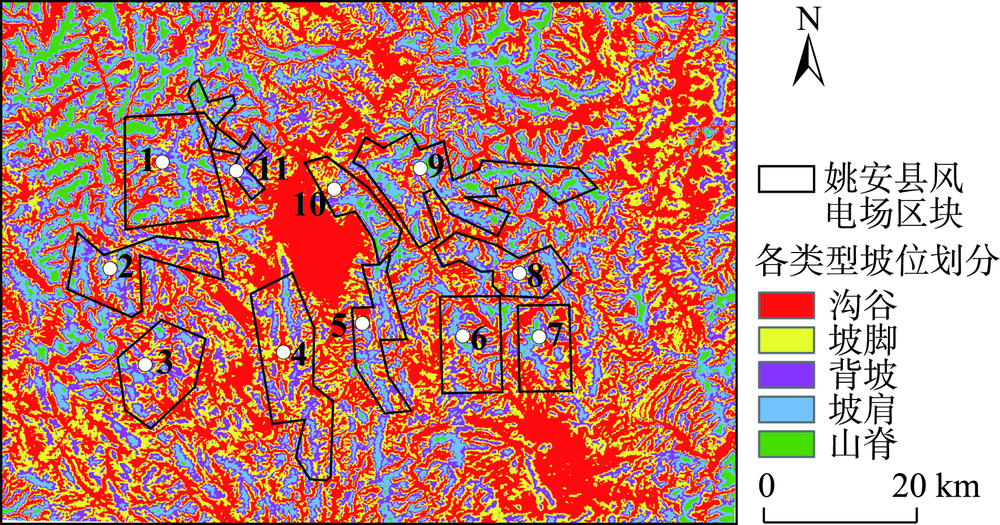
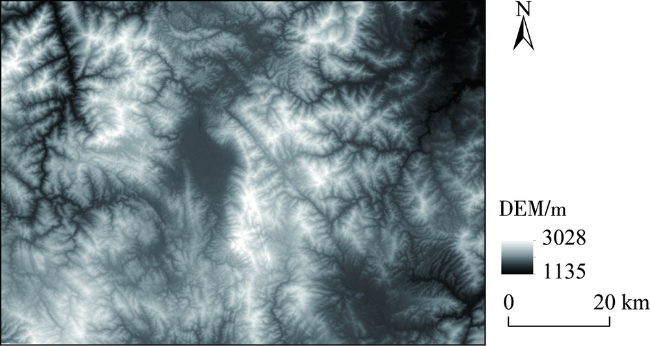
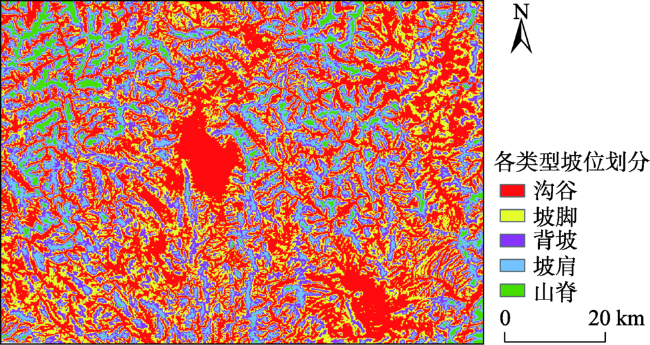
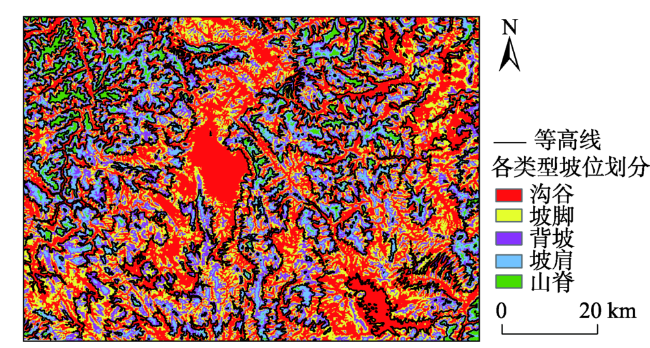
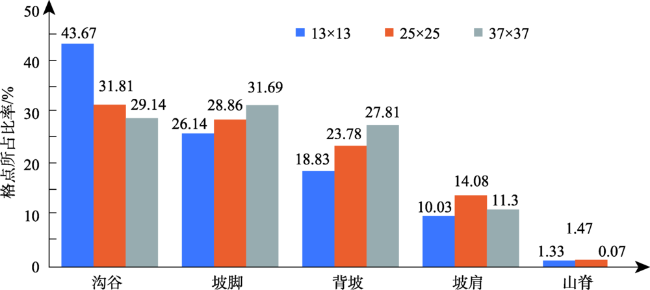
土壤植被研究建立在精准坡位划分的基础上。但现有的坡位大多采用手工划分的方式,存在着自动化程度低、划分精度不高且耗时较长等问题。本文提出一种顾及复杂地形的坡位自动划分算法,尝试采用机器学习K-means方法解决高海拔山区坡位划分的问题,并在山峰区域提取、聚类数确定、以及初始聚类中心选取等关键技术进行了算法的优化。为了验证算法的有效性,以云南省姚安县为研究区,运用提出的算法对研究区坡位进行自动划分,再采用Calinski-Harabasz聚类评价指标、调整兰德系数ARI和误差平方和SSE等一系列方法对坡位K-means聚类划分实验进行分析和评价。研究结果表明,利用该算法所生成的复杂地形坡位与研究区实测等高线相匹配。其次,再从姚安县规划风电场任选4个场址,比较13×13、25×25、37×37三种适宜窗口下坡位自动划分结果,结果表明选取25×25适宜窗口进行坡位划分可靠性最强。再者,计算的规划风电场内山脊、坡肩及背坡比例高达57.13%,也从一个侧面证实了利用该算法划分的坡位结果良好。
高海峰 , 葛莹 , 张杰 , 肖胜昌 , 陈科 . 面向复杂地形的坡位K-means聚类划分研究[J]. 地球信息科学学报, 2020 , 22(3) : 474 -481 . DOI: 10.12082/dqxxkx.2020.190381
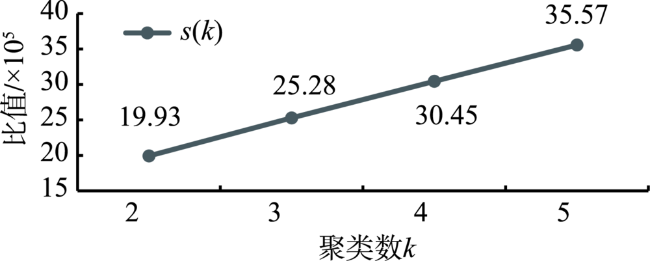
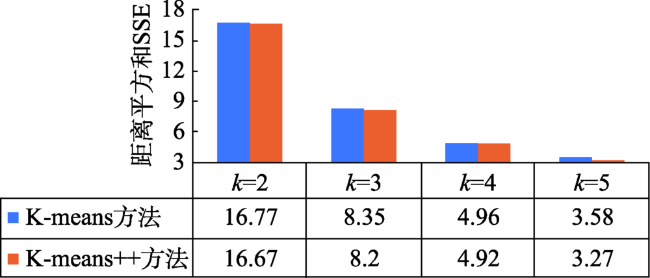
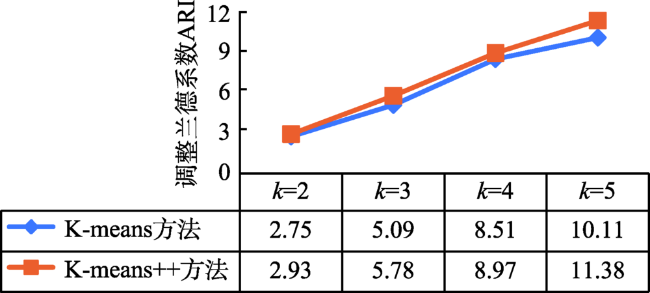
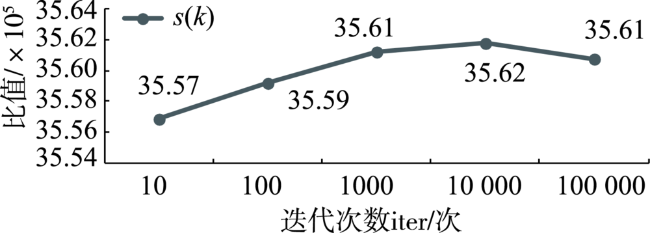
The slope position has generally been applied in a wide range of soil and vegetation studies. The slope position is manually classified in a long history into five types such as valley, footslope, backslope, slope shoulder, and ridge. It leads to issues of low automation, low precision and time consuming. This paper proposed a K-means algorithm of Machine Learning for clustering classification of slope position in mountainous areas. The performance improvements for the conventional K-means algorithm can be achieved by clustering number selection using the Calinski-Harabasz clustering evaluation index and by initial clustering centers finding using K-means++ in the context of slope position detection. The optimized K-means algorithm of a combination of peak area identification through the morphological white top hat transform function was applied into the automatic detection of slope position in Yao'an County, Yunnan Province based on 90 m×90 m SRTM DEM data. In order to validate this algorithm, a series of replicated experiments were carried out with different threshold values. Three accuracy measures of this algorithm such as Calinski-Harabasz clustering evaluation index, Adjusted Rand index and SSE can be estimated for these experiments. The results show that: (1) the best performance of this K-means algorithm is achieved with a clustering number k = 5; (2) this K-means algorithm is significantly better by using K-means++ to select the initial clustering centers than unoptimized selection; (3) the convergence of this K-means algorithm is the best if the iterations iter = 10,000. Furthermore, these results were obtained in a particular suitable window i.e. 25×25, and the window was compared to other two windows, that is, 13×13 and 37×37. An alternative statistical approach is the direct estimation of classification proportions of slope position for the study area, which can be achieved by evaluating point samples of backslope, slope shoulder, and ridge. Automatic mapping results in the planned wind farms are obtained up to 57.13%, which also indicates that the use of the proposed K-means algorithm may further enhance the potential of slope position detection. The advantages of our algorithm seem to lie in the help it gives for the development of automatic clustering classification of slope position as well as simple manipulation in spatial databases. Further improvements are needed in better performances by integrating fuzzy theory into this algorithm, suitable window selection by using the abruptshift analysis approach, as well as more topographic attributions such as slope, profile curvature and plan curvature, which will lead to the development of our algorithm.
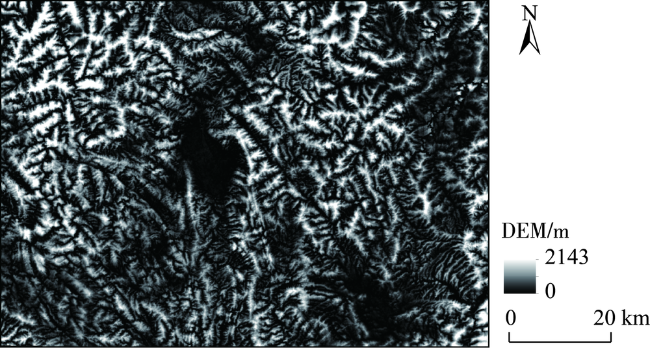
| 算法 1 运用白色顶帽变化函数提取山峰区域算法 |
|---|
| 输入:原始DEM数据;设定的山峰区域提取适宜窗口大小t×t。 输出:山峰区域图K (1)对原始DEM按式(1)进行腐蚀和膨胀变换。式中,λx为正方形结构元素,本文为适宜窗口,窗口大小t×t是设定的形态学处理阈值; (2)根据腐蚀变化图像Eλƒ(X)和膨胀变化图像Dλƒ(X)按式(2)进行开操作,生成除山峰区域之外的其它区域; (3)计算式(3),将原始DEM和Oλƒ(X)相减,生成山峰区域。 |
| 算法 2 基于K-means++方法的初始聚类中心优选算法 |
|---|
| 输入:山峰区域图,最优聚类数K 输出:优选的K个初始聚类中心μ1,μ2,… μK (1)从山峰区域图中随机选择一个格点作为初始聚类中心μ1; (2)计算各个格点到其最近聚类中心的距离D(xi),再将所有距离相加得到Sum(D(xi)); (3)生成随机数Random ≤ total,计算total=Sum(D(xi))×Random和total-=D(xi),直至total≤ 0。此时的格点就是一个初始聚类中心; (4)重复(2)和(3),直至选出K个初始聚类中心。 |
| 算法 3 基于K-means方法进行坡位聚类划分算法 |
|---|
| 输入:山峰区域图;最优聚类数K;优选的山峰区域初始聚类中心μ1,μ2…μK;前后2次聚类中心的限差tol;聚类迭代次数iter 输出:坡位划分结果(1)按式(5)计算格点xi与初始聚类中心μk之间的欧式距离J(Ck);J(Ck)计算公式如式(5)所示。 (2)设最小欧式距离minDist对应的k为minIndex,判断J(Ck)<minDist,如果是,则minDist=J(Ck),minIndex=k。否则,继续循环k; (3)将xi的最小欧式距离及其对应的k存入列表[minDist, minIndex]; (4)遍历格点xi,重复执行(2)和(3),直至i=m; (5)按各聚类中心计算每一坡位聚类类别Ck的栅格单元均值作为新的初始聚类中心; (6)反复执行(1)~(5)步骤,直至聚类迭代次数达到iter或新的初始聚类中心与前一次初始聚类中心误差达到限差tol; (7)按minIndex生成坡位矩阵,确定划分结果。 |
表1 不同适宜窗口下各类型坡位格点所占比率统计 |
| 风电场 | 适宜 窗口 | 沟谷 | 坡脚 | 背坡 | 坡肩 | 山脊 | 总计 | ||||||||||||
|---|---|---|---|---|---|---|---|---|---|---|---|---|---|---|---|---|---|---|---|
| 格点数 | 占比 | 格点数 | 占比 | 格点数 | 占比 | 格点数 | 占比 | 格点数 | 占比 | 格点数 | 占比 | ||||||||
| 3 | 13×13 | 5531 | 42.84 | 3674 | 28.45 | 2652 | 20.54 | 1025 | 7.94 | 30 | 0.23 | 12 912 | 100 | ||||||
| 25×25 | 3864 | 29.93 | 3916 | 30.33 | 3556 | 27.54 | 1494 | 11.57 | 82 | 0.64 | 12 912 | 100 | |||||||
| 37×37 | 3350 | 25.94 | 4300 | 33.30 | 4102 | 31.77 | 1110 | 8.60 | 50 | 0.39 | 19 635 | 100 | |||||||
| 4 | 13×13 | 7925 | 40.36 | 6193 | 31.54 | 4110 | 20.93 | 1383 | 7.04 | 24 | 0.12 | 19 635 | 100 | ||||||
| 25×25 | 5758 | 29.33 | 6856 | 34.92 | 5493 | 27.98 | 1499 | 7.63 | 29 | 0.15 | 19 635 | 100 | |||||||
| 37×37 | 5684 | 28.95 | 7587 | 38.64 | 5543 | 28.23 | 821 | 4.18 | 0 | 0.00 | 22 841 | 100 | |||||||
| 9 | 13×13 | 8518 | 37.29 | 5518 | 24.16 | 4703 | 20.59 | 3396 | 14.87 | 706 | 3.09 | 22 841 | 100 | ||||||
| 25×25 | 4914 | 21.51 | 4879 | 21.36 | 5635 | 24.67 | 5899 | 25.83 | 1514 | 6.63 | 22 841 | 100 | |||||||
| 37×37 | 3839 | 16.81 | 4864 | 21.30 | 6496 | 28.44 | 6760 | 29.60 | 882 | 3.86 | 22 841 | 100 | |||||||
| [1] |
王彦文, 秦承志 . 地貌形态类型的自动分类方法综述[J]. 地理与地理信息科学, 2017,33(4):16-21.
[
|
| [2] |
|
| [3] |
|
| [4] |
靳甜甜, 傅伯杰, 刘国华 , 等. 不同坡位沙棘光合日变化及其主要环境因子[J]. 生态学报, 2011,31(7):1783-1793.
[
|
| [5] |
高雪松, 邓良基, 张世熔 . 不同利用方式与坡位土壤物理性质及养分特征分析[J]. 水土保持学报, 2005,19(2):53-56.
[
|
| [6] |
秦承志, 朱阿兴, 施迅 , 等. 坡位渐变信息的模糊推理[J]. 地理研究, 2007,26(6):1165-1174.
[
|
| [7] |
|
| [8] |
|
| [9] |
|
| [10] |
|
| [11] |
史同广, 闫业超, 王林林 , 等. 基于DEM的大尺度季风风速空间分布模拟研究[J]. 地理与地理信息科学, 2007,23(2):26-29.
[
|
| [12] |
田瑞云, 王玉宽, 傅斌 , 等. 基于DEM的地形单元多样性指数及其算法[J]. 地理科学进展, 2013,32(1):121-129.
[
|
| [13] |
|
| [14] |
|
| [15] |
|
| [16] |
|
| [17] |
|
| [18] |
陈锐, 陈明剑, 姚翔 , 等. 利用导航大数据挖掘城市热点区域关联性[J]. 地球信息科学学报, 2019,21(6):826-835.
[
|
| [19] |
|
| [20] |
施慧慧, 王妮, 滕文秀 , 等. 结合Gabor小波和形态学的高分辨率图像树冠提取方法[J]. 地球信息科学学报, 2019,21(2):249-258.
[
|
| [21] |
毛韶阳, 李肯立 . 优化K-means初始聚类中心研究[J]. 计算机工程与应用, 2007,43(22):179-181.
[
|
| [22] |
吴夙慧, 成颖, 郑彦宁 , 等. K-means方法研究综述[J]. 现代图书情报技术, 2011,27(5):28-35.
[
|
| [23] |
|
/
| 〈 |
|
〉 |
