
网络大数据下的中国现代食甜习惯空间分布特征及其影响因素研究
|
姚可桢(1997— ),男,江苏南通人,硕士生,主要从事网络大数据和GIS应用研究。E-mail: kezhen_yao@qq.com |
收稿日期: 2019-08-08
要求修回日期: 2020-01-16
网络出版日期: 2020-08-25
基金资助
国家自然科学基金项目(41901355)
江苏省自然科学基金青年项目(BK20160953)
江苏省一流本科专业项目
版权
Study on Spatial Distribution of Modern Sweet Diet and its Impact Factors in China based on Big Data from Internet
Received date: 2019-08-08
Request revised date: 2020-01-16
Online published: 2020-08-25
Supported by
National Natural Science Foundation(41901355)
Natural Science Foundation of Jiangsu Province(BK20160953)
First class undergraduate program of Jiangsu Province
Copyright
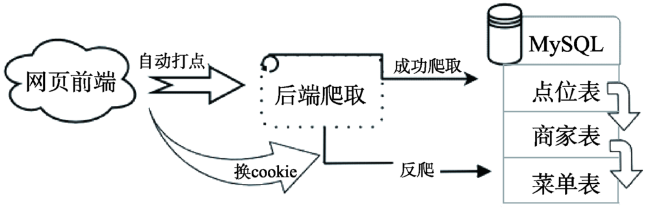
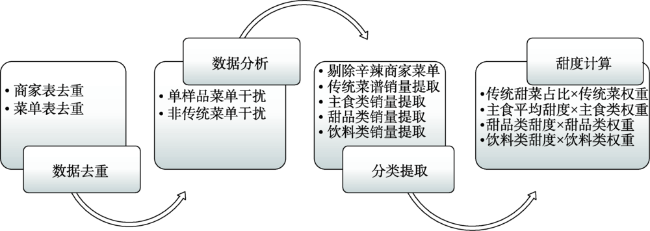
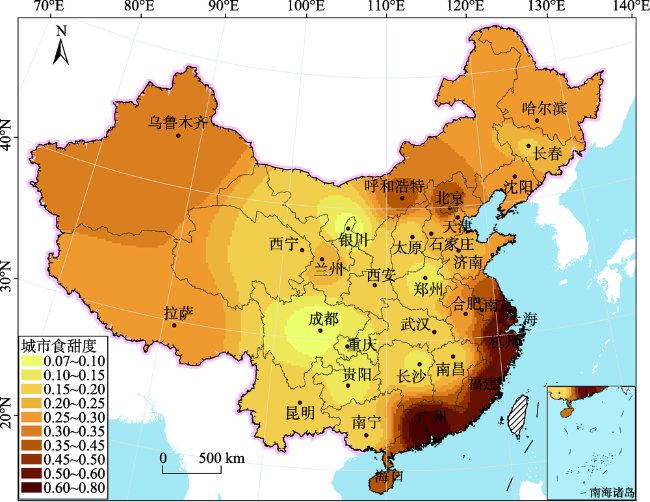
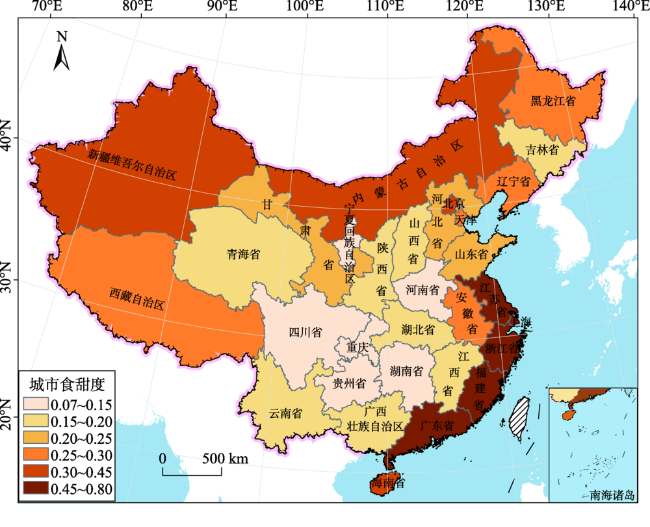
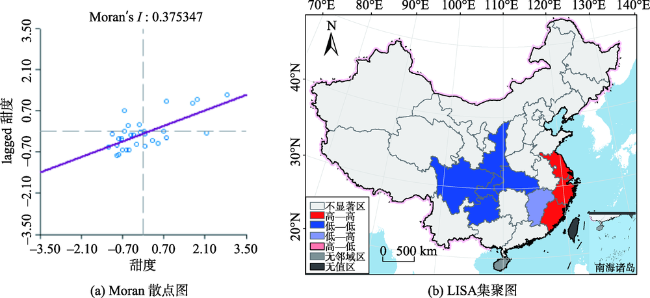
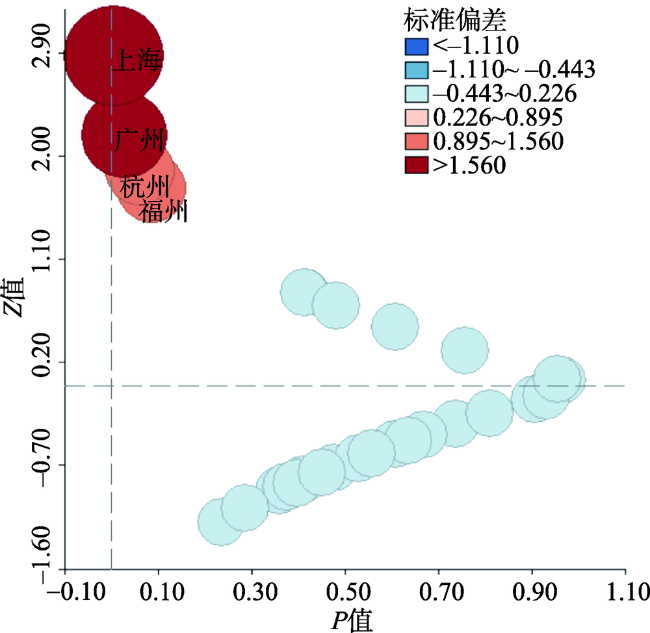
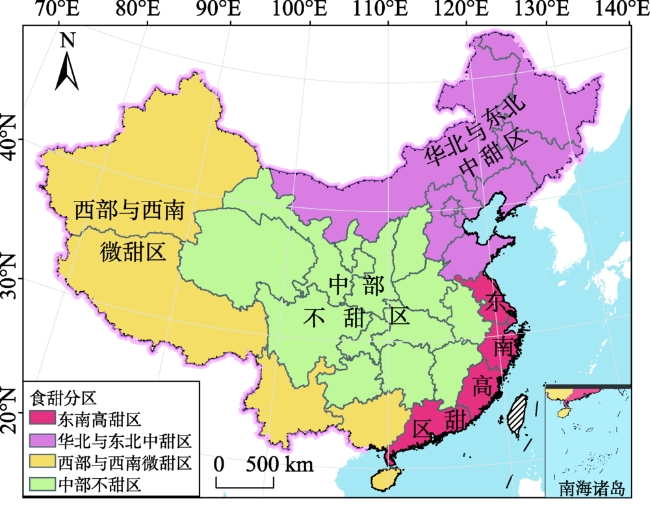
饮食地理文化作为地域文化中最具地方特色的重要元素,在现代人口大规模流动背景下呈现出全新的多样化局面,而基于传统认知的“南甜北咸”的地域分异已然不能代表中国现代食甜分布的空间特征。因此,本文采用网络爬虫技术,获取我国大陆31个省会城市共计约2000万条美食消费数据,从传统类菜品、主食类菜品、饮料类和甜品类菜品4个方面计算城市食甜度,在ArcGIS、MySQL软件支持下,借助GIS空间分析和数理统计方法探究我国现代食甜习惯的空间分布特征,分析影响食甜分布的因素。研究发现:① 中国食甜在空间分布上存在显著的地域分异特征,聚类分析评价参数R 2高达0.88,现代食甜习惯总体呈现“东高北中,西微内低”的包围式格局;② 从整体抑或局部角度,在1%显著性水平上莫兰指数均为正,中国食甜分布呈现显著的空间正相关关系,形成特色鲜明的3个地理集聚区,即以苏浙沪闽为主的东南沿海高甜集聚区,以渝黔川为主的西南内陆低甜集聚区和以陕宁为主的西北内陆低甜集聚区;③ 构建了中国现代食甜习惯分布影响因素模型,其拟合精度为0.82,分析结果显示降水、湿度、气温等气象要素及地理位置是影响现代我国食甜空间分布的重要因素。

姚可桢 , 岳书平 . 网络大数据下的中国现代食甜习惯空间分布特征及其影响因素研究[J]. 地球信息科学学报, 2020 , 22(6) : 1202 -1215 . DOI: 10.12082/dqxxkx.2020.190432
As the most important element with local characteristics in regional culture, dietary geographical culture presents a new diversified situation under the background of large scale population movement. However, up to now, the domestic research on the distribution characteristics of sweet diet based on traditional cognition is still lack of objective data. Based on the web crawler technology, this paper obtained about 20 million pieces of gourmet consumption data in 31 provincial capitals in mainland China. The degree of sweetness in our diets in urban areas was calculated for traditional dishes, main food dishes, drinks, and dessert dishes. Based on ArcGIS and MySQL softwares, spatial analysis and mathematical statistics were used to understand the spatial distribution characteristics of the modern Chinese sweet diet and identify its affecting factors. The results show that there were dramatically regional differences in the spatial distribution of sweet diet in China, especially in the southeastern coastal areas and the central inland areas, with the evaluation parameter (R 2) of spatial grouping analysis reaching 0.88. The distribution of modern sweet diet generally presented a surrounding pattern of "High East, Middle North, Micro-low West and Low Inside". From either the overall or local point of view, the Moran indexes were positive at 1% significance level, and there was a significant positive spatial autocorrelation for sweet diet habits at different areas in China rather than an obvious trend of dispersion. There were three distinct geographical agglomeration areas: the high-sweetness agglomeration areas along the southeast coast of Jiangsu, Zhejiang, Shanghai, and Fujian, the low-sweetness agglomeration areas in southwest areas of Chongqing, Guizhou, and Sichuan, and the northwest inland low-sweetness agglomeration areas in Shanxi and Ningxia. The accuracy of the stepwise regression model of sweet diet habit distribution was 0.82, and results suggest that meteorological elements such as precipitation, humidity, temperature, and geographical location were important factors that influence the spatial distribution of sweet diet habit in modern China. Moreover, we found that geographical location had a regulating effect on the influence of sunshine duration on sweet diet habit. Specifically, the sweetness of inland cities generally increased with the increase of sunshine duration, while the sweetness of coastal cities usually decreased with the decrease of sunshine duration. This study aims to reveal the regional disparity of sweet culture in modern China, which provides reference for the planning of the category structure in urban catering industry and better understanding of the new trend of the development of modern sweet food consumption.
表1 不同插值方法精度对比一览表Tab. 1 Comparison of accuracy of different interpolation methods |
| 插值方法 | 均方根误差(RMS) | 平均偏差 | 标准均方根误差(标准化RMS) |
|---|---|---|---|
| 反距离加权 | 0.130 | -0.016 | — |
| 普通克里格 | 0.138 | 0.008 | 1.366 |
表2 5个代表城市食甜度的LISA结果Tab. 2 LISA of Urban Eating Sweetness |
| 城市 | 食甜度 | Moran's I | 标准化Z值 | p值 | 关联类型 |
|---|---|---|---|---|---|
| 上海 | 0.7697 | 0.000 035 | 5.1219*** | 0.0000 | H-H |
| 杭州 | 0.5724 | 0.000 032 | 4.4924*** | 0.0000 | H-H |
| 福州 | 0.6000 | 0.000 011 | 2.8835*** | 0.0039 | H-H |
| 成都 | 0.0794 | 0.000 013 | 3.0953*** | 0.0019 | L-L |
| 银川 | 0.1000 | 0.000 010 | 2.3447** | 0.0190 | L-L |
注:**代表在5%水平上显著,***代表在1%水平上显著。 |
表3 中国不同省份食甜度的分组结果表Tab. 3 Grouping analysis results of sweetness for different provinces in China |
| 空间约束类型 | 评价参数 | ||
|---|---|---|---|
| 组数 | R2 | 孤元个数 | |
| CONTIGUITY面邻接类型 | 3 | 0.78 | 0 |
| 4 | 0.88 | 0 | |
| 5 | 0.87 | 1 | |
| DELAUNAY三角测量 | 3 | 0.87 | 2 |
| 4 | 0.90 | 3 | |
| 5 | 0.92 | 4 | |
| K_NEAREST邻接类型 | 3 | 0.80 | 1 |
| 4 | 0.88 | 3 | |
| 5 | 0.93 | 4 |
注:在分组分析时,会出现某省单独被归为一类或其周围所有相邻接的省份均与之不为一类的情况,这里将该省份定义为孤元。孤元的出现代表实际分类效果不佳,原因在于组数过多或违背空间自相关性。 |
表4 逐步回归分析参数Tab. 4 Stepwise regression analysis parameters |
| 变量 | 模型1 | 模型2 | 模型3 | 模型4 | 模型5 | 模型6 |
|---|---|---|---|---|---|---|
| βi | βi | βi | βi | βi | βi | |
| C | -1.67*** | -6.17*** | -7.10*** | -7.49*** | -6.78*** | -6.68*** |
| k×ln p | 0.12*** | 0.13*** | 0.11*** | 0.72** | 3.54** | 3.77*** |
| ln s | 0.87*** | 0.88*** | 0.99*** | 0.99*** | 0.99*** | |
| 0.43** | 0.35** | 0.05 | ||||
| k×ln h | -1.01* | -3.58** | -3.81*** | |||
| k×ln t | -3.19* | -3.45*** | ||||
| F值 | 21.89*** | 22.18** | 20.70*** | 17.95*** | 16.86*** | 22.18*** |
| R2 | 0.50 | 0.68 | 0.76 | 0.79 | 0.82 | 0.82 |
注:*代表通过90%的显著性检验;**代表通过95%的显著性检验;***代表通过99%的显著性检验;σ为标准误差。 |
| [1] |
王汐牟, 王强. 时空与食事:宋元明时期的饮食谱录及其所蕴含的社会饮食风尚[J]. 北方从论, 2018,268(2):97-101.
[
|
| [2] |
丁继月. 大连市区餐饮业时空变迁及其机制研究[D]. 大连:辽宁师范大学, 2019.
[
|
| [3] |
陈传康. 中国饮食文化的区域分化和发展趋势[J]. 地理学报, 1994,61(3):226-235.
[
|
| [4] |
秦萧, 甄峰, 朱寿佳, 等. 基于网络口碑度的南京城区餐饮业空间分布格局研究——以大众点评网为例[J]. 地理科学, 2014,34(7):810-817.
[
|
| [5] |
刘琪, 基于大数据的深圳市餐饮业空间分布格局研究——以大众点评网为例[C].中国城市规划学会、东莞市人民政府.持续发展理性规划——2017中国城市规划年会论文集(05城市规划新技术应用).中国城市规划学会、东莞市人民政府:中国城市规划学会, 2017: 611-620.
[
|
| [6] |
夏令军, 刘艳芳, 刘国炜. 中国地级城市餐饮业分布格局及影响因素——基于“大众点评网”数据的实证研究[J]. 经济地理, 2018,38(5):133-141.
[
|
| [7] |
顾秋实, 张海平, 周星星, 等. 中国传统八大菜系的地理分布及其扩散效应——基于大数据视角的实证分析[J].浙江学刊,2019(5):47-53.
[
|
| [8] |
黄恒君, 陶然, 傅德印. 单位名录库更新:互联网大数据源及其数据质量评估[J]. 统计研究, 2017,34(1):12-22.
[
|
| [9] |
秦之湄. 基于互联网大数据的城市餐饮源清单高时空分辨研究[C].中国环境科学学会环境信息化分会、《中国环境管理》杂志.2016全国环境信息技术与应用交流大会暨中国环境科学学会环境信息化分会年会论文集, 2016: 139-146.
[
|
| [10] |
蓝勇, 中国饮食辛辣口味的地理分布及其成因研究[J]. 人文地理, 2001,16(5):84-88.
[
|
| [11] |
张仁军, 刘聪. 中国食辣的空间分布及影响因素——基于美食团购的大数据分析[J]. 重庆师范大学学报(自然科学版), 2016,33(1):143-148.
[
|
| [12] |
洪忻, 李解权, 王志勇, 等. 南京城区居民膳食模式及其影响因素研究[J]. 中华疾病控制杂志, 2015,19(1):54-57.
[
|
| [13] |
|
| [14] |
|
| [15] |
赵彤. 基于GIS的重庆市柑橘农业气候区划[D]. 重庆:重庆师范大学, 2018.
[
|
| [16] |
杨丹, 杨学明, 张鹏, 等. 南方馒头加工中的辅料配比优化研究[J]. 麦类作物学报, 2014,34(8):1061-1066.
[
|
| [17] |
周素梅, 张国增, 张梅红, 等. 北方馒头实验室制作与评价[J]. 科技导报, 2011,29(29):75-79.
[
|
| [18] |
狄乾斌, 王亮, 邱煜焜. 中国沿海省份城市发展水平空间自相关分析[J]. 资源开发与市场, 2018,34(5):649-653.
[
|
| [19] |
|
| [20] |
臧良震, 张彩虹, 郝佼辰. 中国林下经济发展的空间分布特征研究[J]. 林业经济问题, 2014,34(5):442-446.
[
|
| [21] |
梁洪运, 周其龙, 孙亚林. 空间权重矩阵对空间自相关影响分析[J].科技资讯,2013(9):141-143.
[
|
| [22] |
杨青林, 赵荣钦, 邢月, 等. 中国城市碳排放的空间分布特征研究[J]. 环境经济研究, 2017,2(1):70-81.
[
|
| [23] |
张生玲, 王雨涵, 李跃, 等. 中国雾霾空间分布特征及影响因素分析[J]. 中国人口·资源与环境, 2017,27(9):15-22.
[
|
| [24] |
张康聪, 陈健飞. 地理信息系统导论(第3版)[M]. 北京: 清华大学出版社, 2009.
[
|
| [25] |
景楠, 颜波. 东北区域物流与经济的空间自相关和空间聚类分析[J].东北师大学报(哲学社会科学版),2015(1):134-140.
[
|
| [26] |
汪紫云, 李援亚. 基于逐步回归分析法的湖北省农林牧渔产值增长因素分析[J]. 粮食科技与经济, 2018,43(5):33-36.
[
|
| [27] |
林正秋, 糖的历史与糖业祖师杂谈[J].上海调味品,2004(5):30-31.
[
|
| [28] |
蓝勇, 陈姝. 历史时期中国甜食的空间格局及其成因研究[J]. 云南大学学报(社会科学版), 2019,18(6):57-67.
[
|
/
| 〈 |
|
〉 |
