
机载多光谱影像语义分割模型在农田防护林提取中的应用
|
王学文(1996— ),男,江苏南通人,硕士生,主要从事农业信息化技术及应用、深度学习与遥感影像处理研究。 E-mail:wangxuewen@stu.shzu.edu.cn |
收稿日期: 2020-02-23
要求修回日期: 2020-03-25
网络出版日期: 2020-10-25
基金资助
新疆生产建设兵团科技计划项目(2017DB005)
兵团空间信息工程技术研究中心创建项目(2016BA001)
中央引导地方科技发展专项资金项目(201610011)
版权
Application of Airborne Multispectral Image Semantic Segmentation Model in Farmland Shelterbelt Extraction
Received date: 2020-02-23
Request revised date: 2020-03-25
Online published: 2020-10-25
Supported by
Xinjiang Production and Construction Corps Science and Technology Project(2017DB005)
Geospatial Information Engineering Research Center To Create, Xin-jiang Production and Construction Corps(2016BA001)
The Central Government Directs Local Science and Technology Development Special Funds(201610011)
Copyright
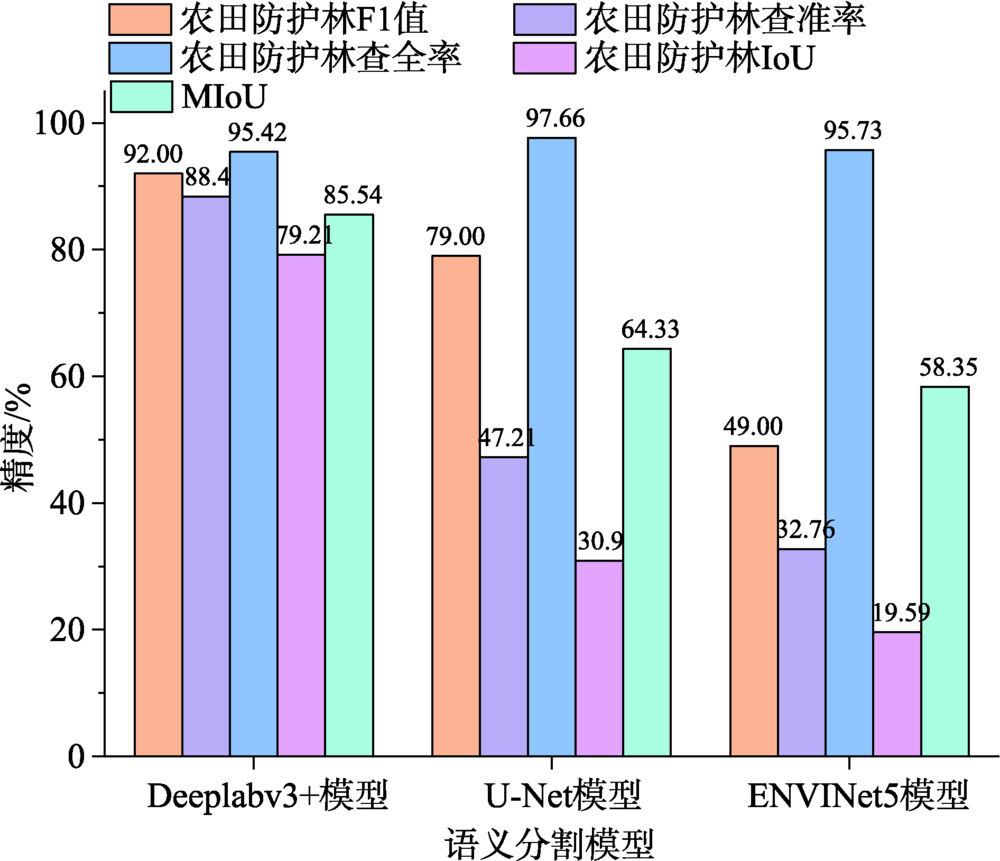
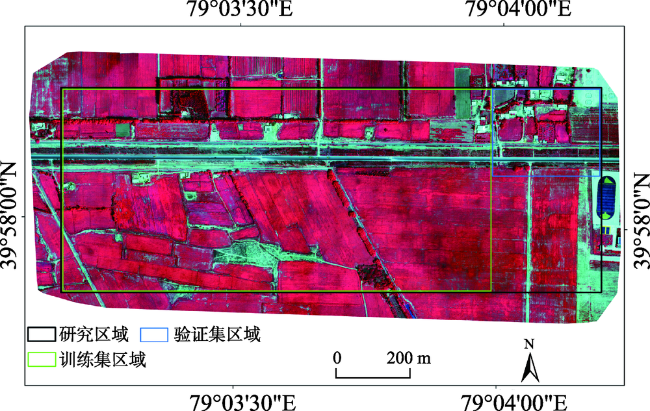
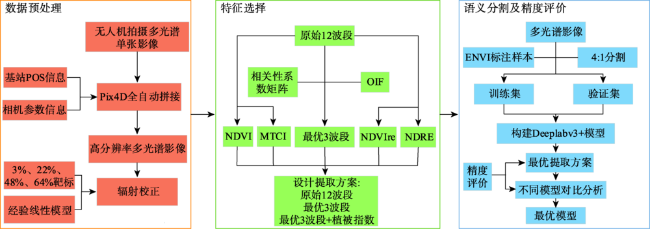
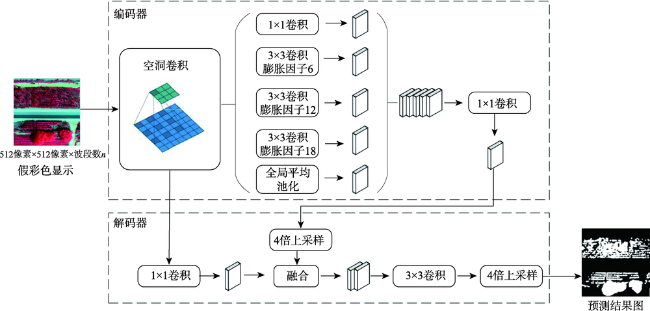
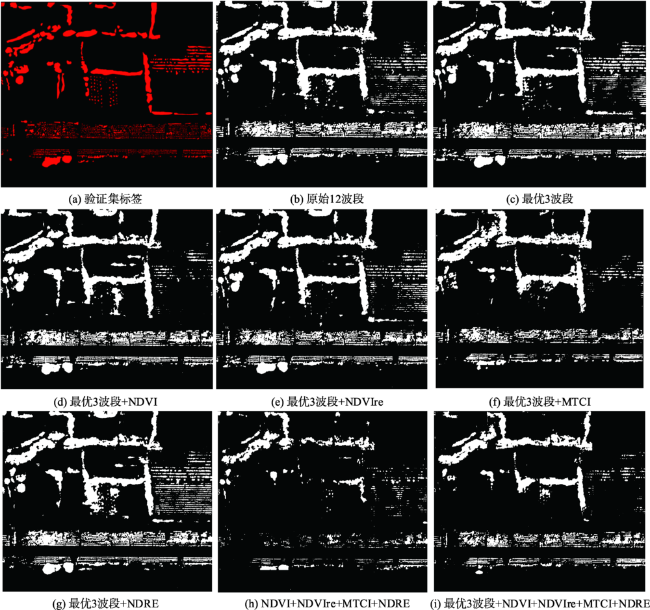
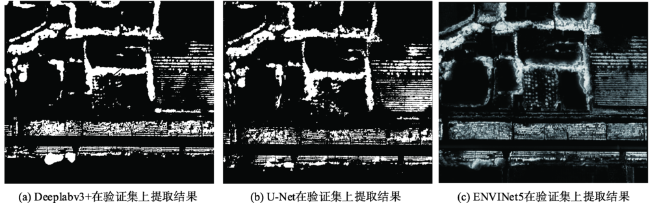
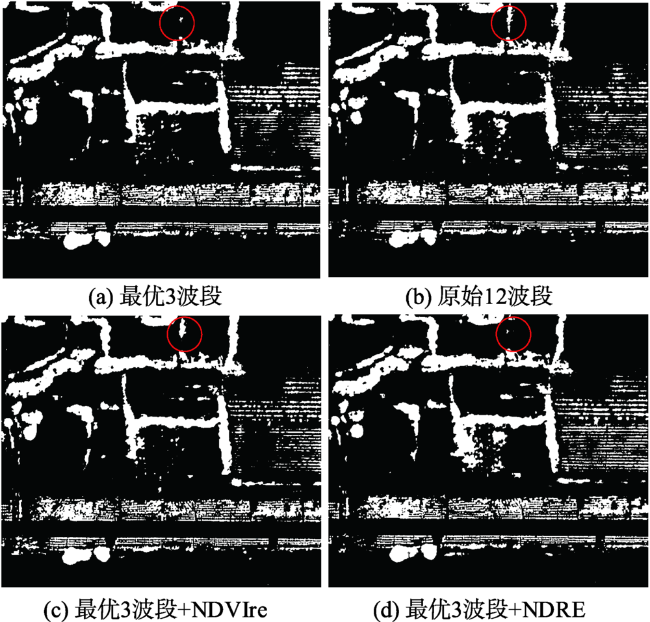
农田防护林是农田生态系统的屏障,其健康状况的监测与评估在我国北方农田林网管理中尤为重要。本文以新疆生产建设兵团第三师51团为研究区,使用复合翼无人机CW-20搭载Micro MCA12 Snap多光谱相机获取农田防护林的多光谱影像,经辐射校正、裁剪等预处理,通过优选有效特征和模型比较,提出农田防护林提取的有效方法。首先,基于原始12波段,依据相关性系数矩阵和最佳指数因子(Optimum Index Factor,OIF)选取最优3波段和植被指数特征进行组合,构建8种农田防护林提取方案;然后,通过建立语义分割Deeplabv3+模型进行精度评价,得到最优3波段组合6(波长710 nm)、8(波长800 nm)、 11(波长900 nm)波段为最佳特征组合;最后,以最优3波段为基础,将Deeplabv3+模型与U-Net、ENVINet5模型进行对比分析。结果表明:Deeplabv3+模型能够更深层次的挖掘光谱中潜在的信息,相比其他模型,能够较好地处理正负样本不均衡问题,获得最高MIoU值85.54%,比U-Net、ENVINet5的MIoU值则分别高出21.21%、27.19%。该研究结果可为基于多光谱遥感影像的语义分割在农田防护林提取及健康状况监测的应用提供借鉴和参考。
王学文 , 赵庆展 , 韩峰 , 马永建 , 龙翔 , 江萍 . 机载多光谱影像语义分割模型在农田防护林提取中的应用[J]. 地球信息科学学报, 2020 , 22(8) : 1702 -1713 . DOI: 10.12082/dqxxkx.2020.200086
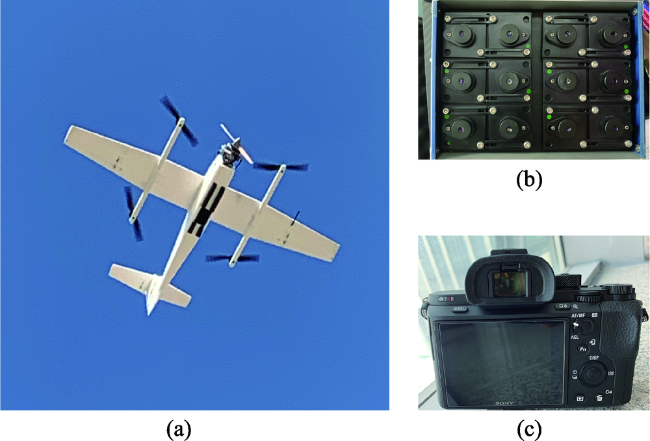
Farmland shelterbelt is the barrier of a farmland ecosystem. Monitoring and assessing the health condition of farmland shelterbelt are significant for farmland forests management in North China. This paper selects the farmland shelterbelt in the 3th Division of Xinjiang Production and Construction Crops as the experimental example. In July and August of 2019, we used the CW-20 fixed-wing drone which was equipped with a SONY-A7RII camera and a Micro MCA12 Snap camera to capture visible light images and multispectral images. Four targets on the ground with different reflectance (3%, 22%, 48%, and 64%) were set up for radiometric correction. we collected field data by Aowei software. Optimal bands were selected base on the Optimum Index Factor (OIF) and correlation coefficient. By integrating appropriate vegetation indices, eight different extraction schemes were constructed to select an effective method for final farmland shelterbelt extraction. In this study, when the flight mission was completed, we collated the exported POS and image data correspondingly. High resolution visible light images with 0.08 m resolution and high resolution multispectral images with 0.149 m resolution were first mosaiced using Pix4Dmapper. Four ground targets were then used for radiometric correction of mosaiced images using linear fitting model. The final experimental data was extracted using clipping method. Because each multispectral image was displayed in gray scale, which was not easy for direct data interpretation. High-resolution visible light images and multispectral images were registered together through ArcGIS software. We labeled 8030 samples based on visible light images through ENVI 5.5 software. We separated the training dataset and verification dataset according to the ratio of 4:1. Specifically, 112 512 pixel×512 pixel slices were taken as the training dataset, and 28 512 pixel×512 pixel slices were taken as the verification dataset. Based on eight extraction schemes, model accuracy of Deeplabv3+semantic segmentation model was evaluated. Three optimal bands that had the best model performance were selected including band 6 (wavelength 710 nm), band 8 (wavelength 800 nm), and band 11 (wavelength 900 nm) based on OIF. Based on these three optimal bands, we further compared the Deeplabv3+ model with U-Net and ENVINet5 model. Our results show that Deeplabv3 + model can capture the potential information in the images at a deeper level with fewer parameters. The MIoU derived from Deeplabv3+, U-Net, and ENVINet5 was 85.54%, 21.21%, and 27.19%, respectively. Also, Deeplabv3 + model solved the problem of sample unbalance. Our results provide a reference for the application of semantic segmentation using multispectral remote sensing data in farmland areas.
表1 Micro MCA12 Snap传感器波段参数Tab. 1 The band feature parameters of Micro MCA12 Snap sensor |
| 波段 | 波长/nm | 波宽/nm | 波段特征 |
|---|---|---|---|
| 1 | 470 | 10 | 区分植被和土壤岩石表层 |
| 2 | 515 | 10 | 可见光光谱中的绿波波峰 |
| 3 | 550 | 10 | 对水质浑浊变化敏感 |
| 4 | 610 | 10 | 植被光谱反射曲线中红光初始波段 |
| 5 | 656 | 10 | 重新归一化植被指数 |
| 6 | 710 | 10 | 植被光谱反射曲线的红边波段 |
| 7 | 760 | 10 | 植被光谱反射曲线的红边波段 |
| 8 | 800 | 10 | 归一化植被指数 |
| 9 | 830 | 10 | 区别植被种类 |
| 10 | 860 | 10 | 与植物总叶绿素含量显著相关 |
| 11 | 900 | 20 | 计算特定作物水分敏感指数 |
| 12 | 950 | 40 | 计算水波段指数 |
表2 植被指数及计算公式Tab. 2 Vegetation index and calculation formula |
| 指数 | 中文名称 | 英文名称 | 对应Micro MCA12 Snap波段 | 计算公式及编号 | |
|---|---|---|---|---|---|
| NDVI[25] | 归一化植被指数 | Normalized difference vegetation index | B8、B5 | (3) | |
| NDVIre[26] | 红边归一化差值植被指数 | Red-edge normalized difference vegetation index | B8、B7、B8、B6 | (4) | |
| MTCI[27] | 地面叶绿素指数 | MERIS Terrestrial Chlorophyll Index | B7、B6、B5 | (5) | |
| NDRE[28] | 归一化差值红边指数 | Normalized difference Red Edge index | B7、B6 | (6) | |
注:B5、B6、B7、B8分别为Micro MCA12 Snap的第5、6、7、8波段。 |
表3 农田防护林提取方案设计Tab. 3 Design of extraction scheme of farmland shelterbelt |
| 实验方案 | 特征组合 |
|---|---|
| 1 | 多光谱原始12波段 |
| 2 | 最佳指数因子选出3波段 |
| 3 | 最优3波段+NDVI |
| 4 | 最优3波段+NDVIre |
| 5 | 最优3波段+MTCI |
| 6 | 最优3波段+NDRE |
| 7 | NDVI+NDVIre+MTCI+NDRE |
| 8 | 最优3波段+NDVI+NDVIre+MTCI+NDRE |
表4 研究区域12波段相关性系数矩阵Tab. 4 The 12 band correlation coefficient matrix of study area |
| 波段 | 波段 | |||||||||||
|---|---|---|---|---|---|---|---|---|---|---|---|---|
| 1 | 2 | 3 | 4 | 5 | 6 | 7 | 8 | 9 | 10 | 11 | 12 | |
| 1 | 1.000 | |||||||||||
| 2 | 0.982 | 1.000 | ||||||||||
| 3 | 0.960 | 0.966 | 1.000 | |||||||||
| 4 | 0.968 | 0.973 | 0.963 | 1.000 | ||||||||
| 5 | 0.958 | 0.962 | 0.940 | 0.991 | 1.000 | |||||||
| 6 | 0.827 | 0.850 | 0.922 | 0.862 | 0.831 | 1.000 | ||||||
| 7 | -0.330 | -0.302 | -0.192 | -0.357 | -0.395 | 0.087 | 1.000 | |||||
| 8 | -0.330 | -0.300 | -0.188 | -0.357 | -0.398 | 0.099 | 0.966 | 1.000 | ||||
| 9 | -0.345 | -0.315 | -0.204 | -0.372 | -0.410 | 0.081 | 0.964 | 0.982 | 1.000 | |||
| 10 | -0.339 | -0.309 | -0.198 | -0.364 | -0.402 | 0.089 | 0.967 | 0.981 | 0.971 | 1.000 | ||
| 11 | -0.335 | -0.308 | -0.199 | -0.362 | -0.397 | 0.080 | 0.965 | 0.952 | 0.947 | 0.979 | 1.000 | |
| 12 | -0.261 | -0.239 | -0.119 | -0.281 | -0.319 | 0.169 | 0.931 | 0.943 | 0.944 | 0.960 | 0.957 | 1.000 |
表5 OIF值排名前5的组合Tab. 5 Top 5 combination of OIF values |
| 序号 | 波段组合 | OIF |
|---|---|---|
| 1 | 6、8、11 | 25.756 |
| 2 | 6、8、10 | 24.962 |
| 3 | 6、10、11 | 24.881 |
| 4 | 6、9、11 | 24.632 |
| 5 | 6、7、8 | 24.136 |
表6 Deeplabv3+语义分割精度评价Tab. 6 Deeplabv3+ semantic segmentation accuracy evaluation |
| 地物类型 | 指标 | 方案1 | 方案2 | 方案3 | 方案4 | 方案5 | 方案6 | 方案7 | 方案8 |
|---|---|---|---|---|---|---|---|---|---|
| 农田防护林 | F1值 | 0.90 | 0.92 | 0.88 | 0.91 | 0.79 | 0.90 | 0.71 | 0.76 |
| 查准率precision/% | 84.83 | 88.40 | 81.94 | 86.28 | 67.57 | 86.06 | 39.13 | 62.29 | |
| 查全率recall/% | 95.09 | 95.42 | 95.49 | 95.62 | 95.57 | 94.84 | 94.73 | 96.10 | |
| IoU/% | 73.66 | 79.21 | 69.41 | 75.87 | 51.02 | 75.53 | 24.32 | 45.23 | |
| 其他地物 | F1值 | 0.91 | 0.92 | 0.90 | 0.91 | 0.85 | 0.91 | 0.81 | 0.83 |
| 查准率precision/% | 95.62 | 95.76 | 96.13 | 96.05 | 96.87 | 95.32 | 98.44 | 97.46 | |
| 查全率recall/% | 86.31 | 89.20 | 84.84 | 87.50 | 74.92 | 87.24 | 69.30 | 72.10 | |
| IoU/% | 91.61 | 91.61 | 91.86 | 92.40 | 92.14 | 91.06 | 96.93 | 94.13 | |
| 平均 | MIoU/% | 82.63 | 85.54 | 80.98 | 84.14 | 72.48 | 83.29 | 60.63 | 69.75 |
| [1] |
|
| [2] |
|
| [3] |
陈伟. 基于高标准农田防护林建设若干问题的探讨[J]. 现代园艺, 2019(14):215-216.
[
|
| [4] |
王菊兰. 金塔县农田防护林体系现状与建议[J]. 甘肃林业科技, 2019(1):34-37.
[
|
| [5] |
|
| [6] |
|
| [7] |
|
| [8] |
|
| [9] |
|
| [10] |
|
| [11] |
|
| [12] |
赵庆展, 刘伟, 尹小君, 等. 基于无人机多光谱影像特征的最佳波段组合研究[J]. 农业机械学报, 2016,47(3):242-248,291.
[
|
| [13] |
顾铮鸣, 金晓斌, 杨晓艳, 等. 基于无人机遥感影像监测土地整治项目道路沟渠利用情况[J]. 农业工程学报, 2018,34(23):85-93.
[
|
| [14] |
张磊, 宫兆宁, 王启为, 等. Sentinel-2影像多特征优选的黄河三角洲湿地信息提取[J]. 遥感学报, 2019,23(2):313-326.
[
|
| [15] |
李冠东, 张春菊, 高飞, 等. 双卷积池化结构的3D-CNN高光谱遥感影像分类方法[J]. 中国图象图形学报, 2019,24(4):639-654.
[
|
| [16] |
杨建宇, 周振旭, 杜贞容, 等. 基于SegNet语义模型的高分辨率遥感影像农村建设用地提取[J]. 农业工程学报, 2019,35(5):251-258.
[
|
| [17] |
|
| [18] |
|
| [19] |
|
| [20] |
贾银江. 无人机遥感图像拼接关键技术研究[D]. 黑龙江:东北农业大学, 2016.
[
|
| [21] |
相涛, 栾元重, 许章平, 等. 基于Pix4Dmapper的无人机低空摄影测量数据处理[J]. 测绘与空间地理信息, 2019,42(3):75-78.
[
|
| [22] |
|
| [23] |
|
| [24] |
郭文婷, 张晓丽. 基于Sentinel-2时序多特征的植被分类[J]. 浙江农林大学学报, 2019,36(5):849-856.
[
|
| [25] |
孙庆龄, 李宝林, 许丽丽, 等. 2000-2013年三江源植被NDVI变化趋势及影响因素分析[J]. 地球信息科学学报, 2016,18(12):1707-1716.
[
|
| [26] |
|
| [27] |
|
| [28] |
|
| [29] |
周志华. 机器学习[M]. 北京: 清华大学出版社, 2016.
[
|
| [30] |
|
| [31] |
许慧敏. 基于深度学习U-Net模型的高分辨率遥感影像分类方法研究[D]. 成都:西南交通大学, 2018.
[
|
| [32] |
Environmental Systems Research Institut, ENVI deep learning[ED/OL]. https://www. harrisgeospatial.com/SoftwareTechnology/ENVI-Deep-Learning, 2019-04-01/2020-03-09.
|
| [33] |
贺浩, 王仕成, 杨东方, 等. 基于Encoder- Decoder网络的遥感影像道路提取方法[J]. 测绘学报, 2019,48(3):330-338.
[
|
/
| 〈 |
|
〉 |
