
基于夜间灯光数据估算安徽省县级尺度城镇化水平
|
孙阳(1994— ),男,硕士生,山东青岛人,主要研究方向为空间数据挖掘与应用。E-mail:845559075@qq.com |
收稿日期: 2019-09-11
要求修回日期: 2019-11-20
网络出版日期: 2020-11-25
基金资助
国家自然科学基金项目(41774001)
国家自然科学基金项目(41774021)
国家自然科学基金项目(41874091)
国家自然科学基金项目(81673239)
国家自然科学基金项目(81973102)
版权
County Urbanization Level Estimated from Nighttime Light Data in Anhui Province
Received date: 2019-09-11
Request revised date: 2019-11-20
Online published: 2020-11-25
Supported by
National Natural Science Foundation of China(41774001)
National Natural Science Foundation of China(41774021)
National Natural Science Foundation of China(41874091)
National Natural Science Foundation of China(81673239)
National Natural Science Foundation of China(81973102)
Copyright
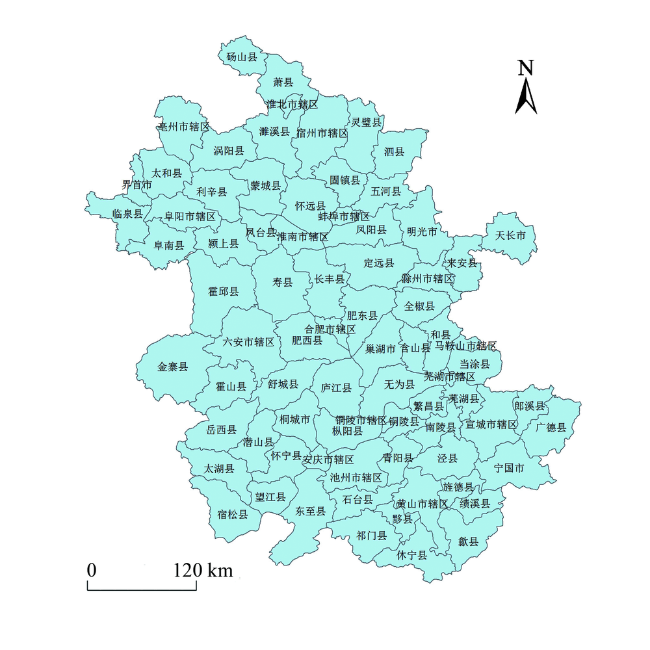
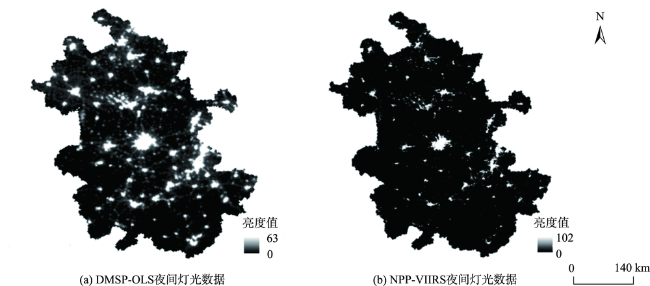
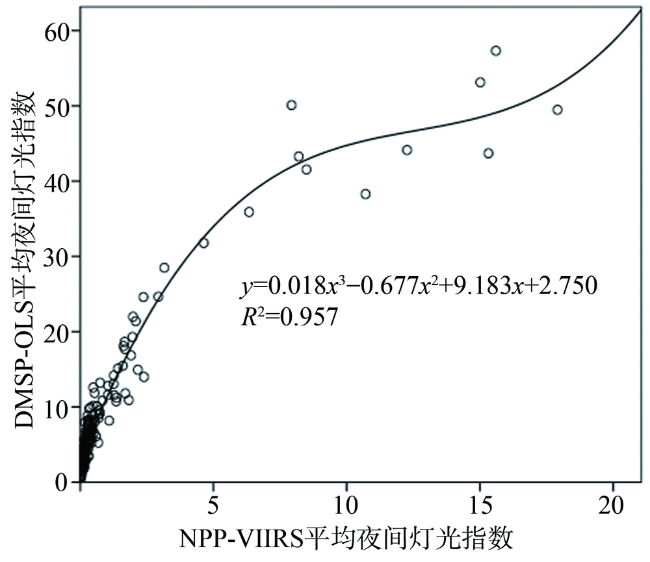
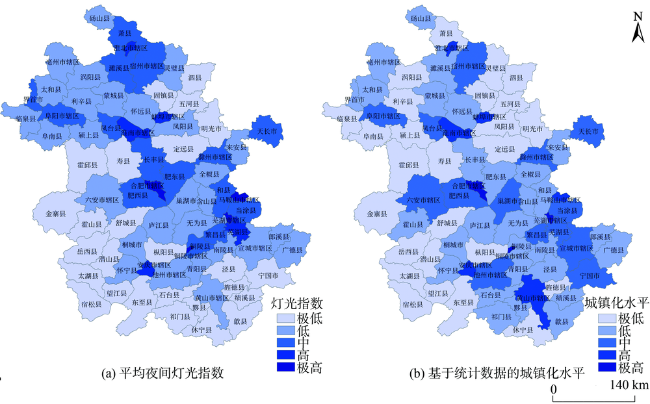
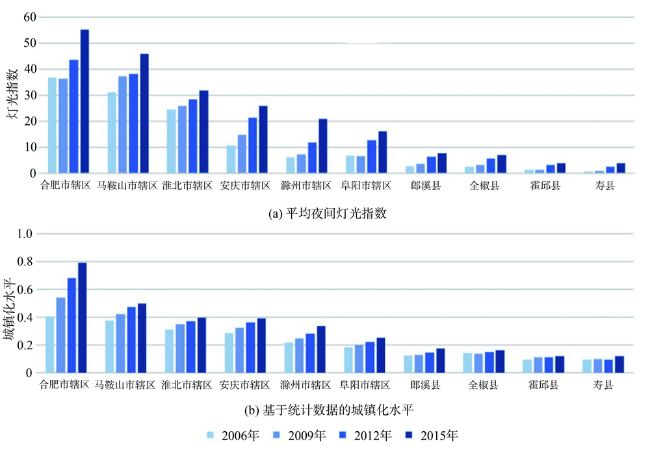
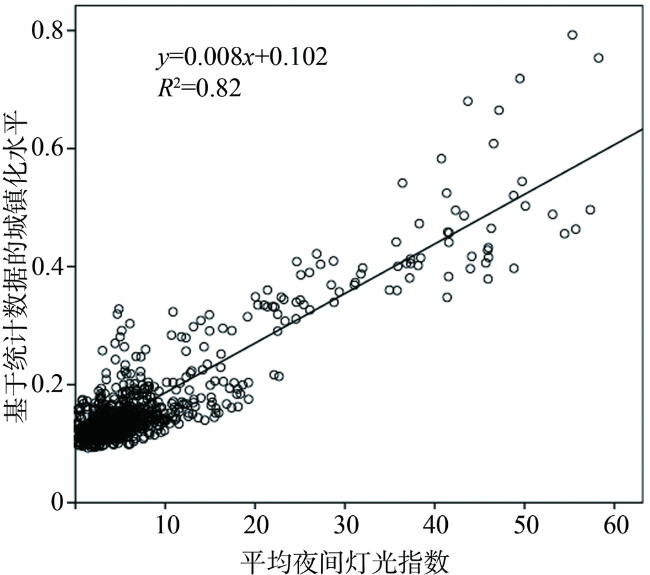
城镇化是地区经济发展和社会进步的重要标志,研究城镇化水平对城镇科学发展和政府高效决策具有重要意义。夜间灯光数据包含了人类活动和经济社会发展等信息,弥补了指标法的不确定性和滞后性等不足,可以更加直观地反映城镇化水平,为城镇化研究提供了新的思路。现有的研究,已经有用夜间灯光数据分析宏观尺度的城镇化水平,但由于DMSP-OLS数据和NPP-VIIRS数据的时间范围均较短,且2种数据的时间尺度不连续,且空间分辨率和辐射分辨率不一致,因此目前主要集中于使用一种夜间灯光数据研究城镇化水平,且研究的时间跨度较短。此外,虽然已有研究表明,大尺度的社会经济活动与夜间光照情况有较强的相关关系,但在较小尺度下,这种相关性受地区经济发展以及灯光数据分辨率的影响较大,对估算精度有更高的要求,因此需要使用实际数据证明使用夜间灯光数据估算县级城镇化水平的合理性。本文使用DMSP_OLS和NPP_VIIRS夜间灯光数据,估算了2006—2015年安徽省县级尺度城镇化水平,为夜间灯光数据在长时间序列的城镇化研究中提供理论支撑。首先分别计算DMSP-OLS和NPP-VIIRS平均夜间灯光指数,以NPP-VIIRS灯光指数为自变量,以DMSP-OLS灯光指数为因变量,对2012年和2013年的2种灯光指数年数据进行曲线拟合,建立2种灯光数据的对应关系,得到2006—2015年安徽省各区县的DMSP-OLS平均夜间灯光指数;然后从人口、经济、社会生活和农业机械化4个方面选取城镇化指标,使用层次分析法计算基于统计数据的城镇化水平;最后将灯光指数与基于统计数据的城镇化水平进行相关性分析和线性回归分析,讨论了安徽省各区县灯光指数和基于统计数据的城镇化水平的时空分布的异同点,分析了同时使用两种灯光指数估算长时间序列城镇化水平的合理性。研究结果显示,灯光指数和基于统计数据的城镇化水平在县级尺度上具有高度相关性,相关系数为0.91(P<0.05),线性回归的拟合优度R2=0.82。灯光指数和基于统计数据的城镇化水平的时空分布基本一致,空间上,安徽省城镇化水平整体分布不均衡,呈现出东高西低的规律;时间上,2006—2015年城镇化水平呈现逐年增长的趋势,合肥市辖区、马鞍山市辖区等发达城区的城镇化水平增长速度较快,而霍丘县、寿县等经济欠发达地区增长较缓慢。

孙阳 , 刘新 , 苏亚聪 , 徐爽 , 纪兵 , 张志杰 . 基于夜间灯光数据估算安徽省县级尺度城镇化水平[J]. 地球信息科学学报, 2020 , 22(9) : 1837 -1847 . DOI: 10.12082/dqxxkx.2020.190515
Urbanization is an important indicator of regional economic development and social progress. Studying urbanization level is of great significance to urban scientific development and efficient decision-making for government. The night light data contains information on human activities and economic and social development, which makes up for the uncertainties and lags of the index method. It can more intuitively reflect the level of urbanization and provide new ideas for urbanization research. Existing studies have used night light data to analyze the macro-scale urbanization level, but because the time ranges of the DMSP-OLS data and NPP-VIIRS data are short, the time scales of the two data are discontinuous, and the spatial resolution is inconsistent with the radiation resolution, so it is mainly focused on the use of a kind of night light data to study the level of urbanization, and the study time span is short. In addition, although studies have shown that there is a strong correlation between large-scale socio-economic activities and nighttime lighting conditions, at a smaller scale, this correlation is greatly affected by regional economic development and the resolution of light data. There are higher requirements for estimation accuracy, so it is necessary to use actual data to prove the rationality of using night light data to estimate county-level urbanization levels. This paper uses DMSP-OLS and NPP-VIIRS night light data to estimate the county-level urbanization level in Anhui Province from 2006 to 2015, and provides theoretical support for night light data in the study of long-term serial urbanization. First, calculate the average night light index of DMSP-OLS and NPP-VIIRS respectively, and take the NPP-VIIRS light index as the independent variable and the DMSP-OLS light index as the dependent variable. Fit and establish the corresponding relationship between the two types of lighting data, and obtain the DMSP-OLS average night light index of each district and county in Anhui Province from 2006 to 2015.Then urbanization indicators are selected from the four aspects of population, economy, social life and agricultural mechanization, using analytic hierarchy process to calculate the level of urbanization based on statistical data. Finally, the correlation and linear regression analysisbetween light index and urbanization level based on statistical data is analyzed to show the consistency of time and space distribution oflightintensity and urbanization level based on statistical data in all districts and counties of Anhui Province. The results show that the average nighttime light index highly correlatesto urbanization level based on statistical data at the county level with the correlation coefficient of 0.91(P<0.05) and the coefficient of determination of linear regression of R2=0.82. The spatial and temporal distribution of the light index and the urbanization level based on statistical data are basically the same. Spatially, the overall urbanization level in Anhui Province is unevenly distributed, showing a pattern of high in east and low in west; temporally, the urbanization level from 2006 to 2015 showed year by year. The urbanization level of developed urban areas such as Hefei City and Maanshan City is growing faster, while less developed areas such as Huoqiu County and Shou County are growing slowly.
表1 基于统计数据的城镇化水平综合评价指标体系Tab. 1 Comprehensive evaluation index system of urbanization based on statistical data |
| 准则层 | 指标层 | 权重 | 指标含义 |
|---|---|---|---|
| 人口指标 | 非农业人口比重 | 0.152 | 代表人口城镇化水平 |
| 人口密度 | 0.076 | 代表人口聚集程度 | |
| 每万人普通中学在校学生数 | 0.038 | 代表教育水平 | |
| 每万人小学在校学生数 | 0.038 | 代表教育水平 | |
| 每万人城镇非私营单位就业人员数 | 0.076 | 代表就业水平 | |
| 经济指标 | 人均GDP | 0.130 | 代表经济发展水平 |
| 第二产业产值占GDP比重 | 0.037 | 代表产业结构组成 | |
| 第三产业产值占GDP比重 | 0.071 | 代表产业结构组成 | |
| 规模以上工业总产值 | 0.037 | 代表经济发展水平 | |
| 固定资产投资 | 0.035 | 代表经济发展水平 | |
| 地方财政收入 | 0.035 | 代表政府提供公共服务能力 | |
| 地方财政支出 | 0.035 | 代表政府提供公共服务能力 | |
| 社会生活指标 | 居民储蓄存款余额 | 0.036 | 代表居民经济状况 |
| 金融机构贷款余额 | 0.011 | 代表居民消费状况 | |
| 人均社会消费品零售总额 | 0.019 | 代表居民消费状况 | |
| 每万人拥有卫生机构床位数 | 0.107 | 代表医疗卫生状况 | |
| 就业人员平均工资 | 0.019 | 代表政府财政实力 | |
| 农业机械化指标 | 单位耕地面积农业机械总动力 | 0.032 | 代表农业机械化水平 |
| 单位耕地面积排灌机械数 | 0.016 | 代表农业机械化水平 |
| [1] |
|
| [2] |
陈明星, 陆大道, 张华. 中国城市化水平的综合测度及其动力因子分析[J]. 地理学报, 2009,64(4):387-398.
[
|
| [3] |
|
| [4] |
姜爱林. 城镇化水平的五种测算方法分析[J]. 中央财经大学学报, 2002(8):76-80.
[
|
| [5] |
魏雯雯. 城市化进程的评价方法研究[D]. 成都:四川师范大学, 2011.
[
|
| [6] |
|
| [7] |
|
| [8] |
|
| [9] |
|
| [10] |
安徽省统计局, 国家统计局安徽调查总队. 安徽统计年鉴2015[M]. 北京: 中国统计出版社, 2016.
[ Anhui provincial bureau of statistics, Anhui investigation team, National bureau of statistics. Anhui statistical yearbook of 2015[M]. Beijing: China Statistics Press, 2016. ]
|
| [11] |
|
| [12] |
|
| [13] |
国家统计局农村社会经济调查司. 中国县域统计年鉴(县市卷)2015[M]. 北京: 中国统计出版社, 2016.
[ Rural social and economic survey department of national bureau of statistics. China county statistical yearbook (county and city volume) of 2015[M]. Beijing: China Statistics Press, 2016. ]
|
| [14] |
国家统计局城市社会经济调查司. 中国城市统计年鉴2015[M]. 北京: 中国统计出版社, 2016.
[ Urban social and economic survey department of national bureau of statistics. China city statistical yearbook (county and city volume) of 2015[M]. Beijing: China Statistics Press, 2016. ]
|
| [15] |
|
| [16] |
胡艳兴. 基于夜间灯光数据的中国贫困空间识别研究[D]. 兰州:西北师范大学, 2016.
[
|
| [17] |
|
| [18] |
常建娥, 蒋太立. 层次分析法确定权重的研究[J]. 武汉理工大学学报(信息与管理工程版), 2007(1):153-156.
[
|
| [19] |
邓雪, 李家铭, 曾浩健, 等. 层次分析法权重计算方法分析及其应用研究[J]. 数学的实践与认识, 2012,42(7):93-100.
[
|
| [20] |
陈晋, 卓莉, 史培军, 等. 基于DMSP/OLS数据的中国城市化过程研究—反映区域城市化水平的灯光指数的构建[J]. 遥感学报, 2003,7(3):168-175,241.
[
|
| [21] |
|
| [22] |
杨洋, 何春阳, 赵媛媛, 等. 利用DMSP/OLS稳定夜间灯光数据提取城镇用地信息的分层阈值法研究[J]. 中国图象图形学报, 2011,16(4):666-673.
[
|
| [23] |
|
| [24] |
|
| [25] |
|
| [26] |
卓莉, 史培军, 陈晋, 等. 20世纪90年代中国城市时空变化特征——基于灯光指数CNLI方法的探讨[J]. 地理学报, 2003,66(6):893-902.
[
|
| [27] |
杨洋, 官云兰, 汤耶磊, 等. 基于DMSP/OLS夜间灯光数据的江西省城市化研究[J]. 江西科学, 2017,35(4):622-628.
[
|
| [28] |
|
| [29] |
|
/
| 〈 |
|
〉 |