
基于中国大气环境监测站点的2015—2019年大气质量状况时空变化分析
|
董佳丹(1996— ),女,湖北襄阳人,硕士生,主要研究方向为大气遥感。E-mail:jiajiadong@whu.edu.cn |
收稿日期: 2020-04-30
要求修回日期: 2020-08-29
网络出版日期: 2020-12-25
基金资助
国家重点研发计划项目(2017YFB0503905-03)
版权
Analysis of the Temporal and Spatial Variation of Atmospheric Quality from 2015 to 2019 based on China Atmospheric Environment Monitoring Station
Received date: 2020-04-30
Request revised date: 2020-08-29
Online published: 2020-12-25
Supported by
National Key Research and Development Program of China(2017YFB0503905-03)
Copyright
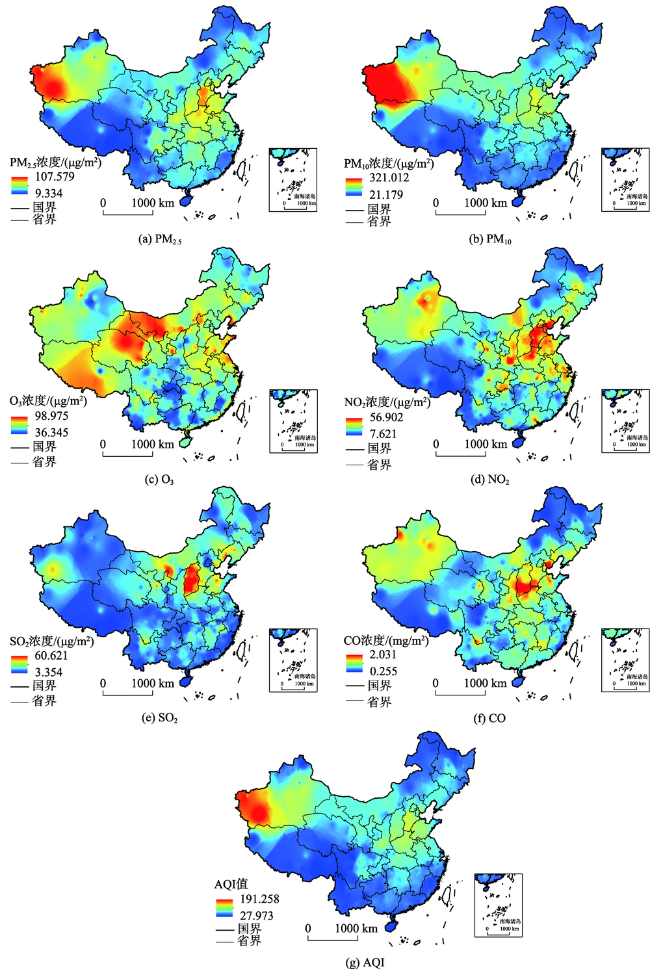
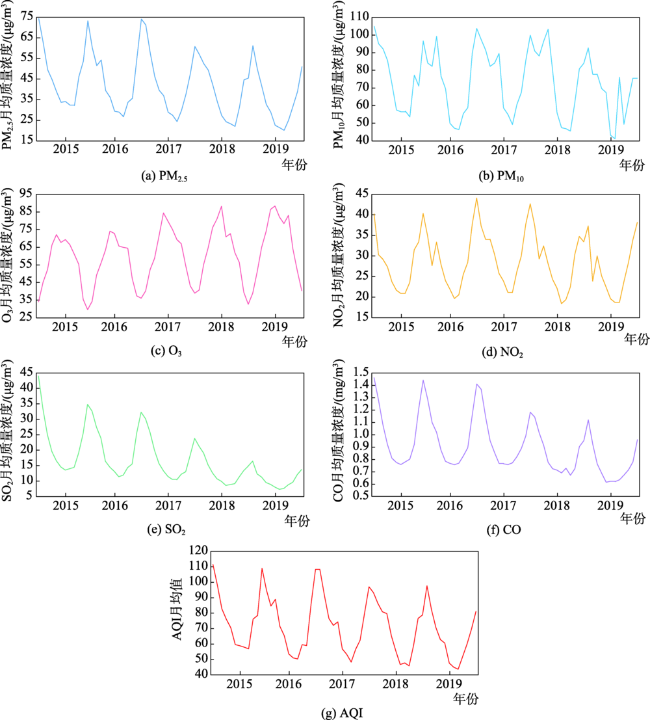
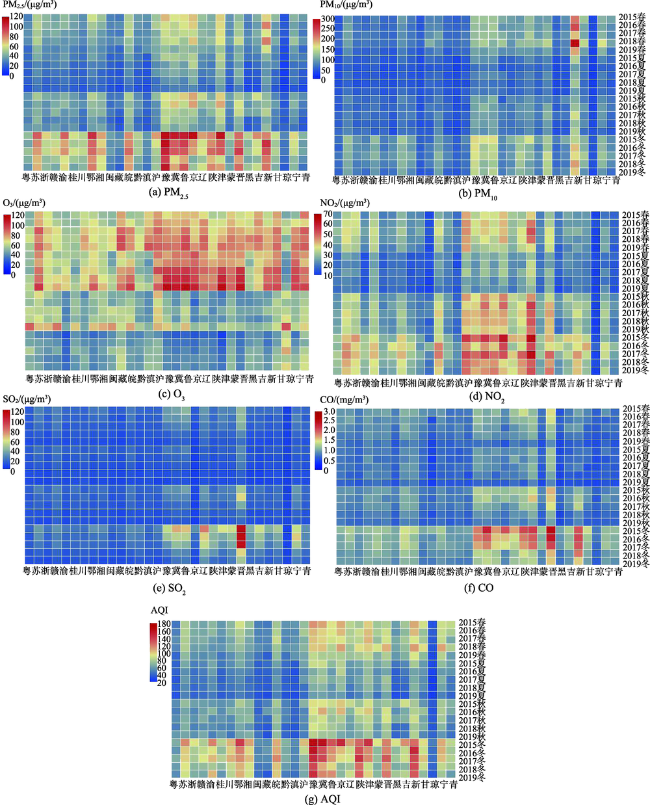
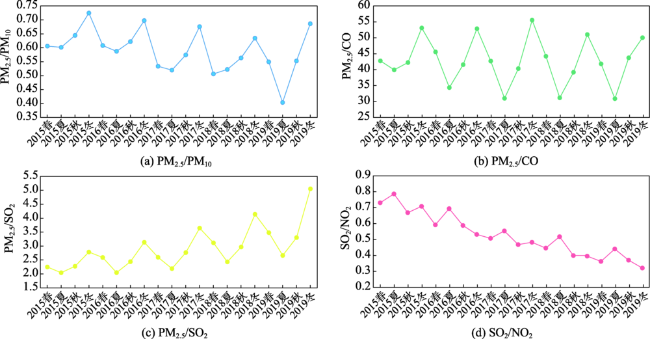
2013年以来几次严重的雾霾污染事件引起了公众的广泛关注,此后中国实施了一系列有关大气污染防治的政策、法规和措施来改善大气质量。为了分析近年来中国大气质量的时空变化特征,本文选取2015—2019年生态环境部国控站点监测的大气污染关键参数,对比分析了空气质量指数和6种大气污染物的季均、年均浓度变化结果,并利用组合指标分析法和相关分析法探讨了不同大气污染物之间的相关性。结果表明:① PM2.5、PM10、SO2、CO和NO2浓度和AQI均有明显下降,2019年均浓度较2015年均浓度分别下降4.5%、3.84%、7.86%、3.74%、0.95%,AQI下降了19.31%,同时,O3浓度则上升了0.79%;② 从空间分布来看,中国北方地区PM10、PM2.5、O3、NO2、SO2、CO年均质量浓度和AQI分别比南方地区高25.2%、18.73%、4.95%、17.6%,32.74%、16.17%、28.3%;③ 从季节性变化规律来看,除了O3呈现出夏季浓度高,冬季浓度低外,其他5种污染物和AQI都呈现相反的季节变化规律;④ 总体而言,目前中国大气污染以PM2.5和O3为主,PM2.5与NO2、SO2、CO之间有极显著的正相关关系(r>0.85,p<0.01),而O3与其前体物NO2和CO之间存在显著的负相关关系(r>0.8,p<0.01)。
董佳丹 , 陈晓玲 , 蔡晓斌 , 徐强强 , 关宇廷 , 李婷慧 , 刘诗燕 , 陈芳 . 基于中国大气环境监测站点的2015—2019年大气质量状况时空变化分析[J]. 地球信息科学学报, 2020 , 22(10) : 1983 -1995 . DOI: 10.12082/dqxxkx.2020.200212
After 2013, several serious haze pollution events in China have attracted wide attention from the public. Therefore, the Chinese government has developed a series of policies, measures, and laws for air pollution prevention and control. We select the air quality index and six key air pollutant observations in the national air environmental monitoring station network of China to analyze the changes trend and spatial pattern of the country-scaled atmospheric quality from 2015 to 2019. The annual and seasonal average concentrations of these parameters were used to investigate their relationships by using the ratios and correlation coefficients among them. The results showed that the concentration of PM2.5, PM10, SO2, CO, NO2, and AQI all decreased significantly. The annual average concentrations of them in 2019 decreased by 4.5%,3.84%,7.86%,3.74%, 0.95%, and 19.31%, respectively, compared with that in 2015. Only O3 significantly increased by 0.79% in the same period. The average annual concentrations of PM10, PM2.5, O3, NO2, SO2,CO, and AQI in northern China all are higher than those in southern China by 25.2%, 18.73%, 4.95%, 17.6%, 32.74%, 16.17%, and 28.3%, respectively. Besides, AQI and all six pollutants showed the seasonality. The seasonal variation pattern of O3 exists with a higher concentration in summer and a lower concentration in winter, while the other five pollutants and AQI present the inverse seasonality. In general, PM2.5 and O3 are the most severe air pollutants in China during these five years. Furthermore, the relationships among different pollutants were found in the study period. The PM2.5 concentration is significantly positively correlated with NO2, SO2 and CO (r>0.85, p<0.01), and O3 is negatively correlated with its precursor NO2 and CO (r>0.8, p<0.01).
表1 2015—2019年八大综合经济区的4种大气污染物组合比值对比Tab. 1 Comparison of the combined ratios of four key atmospheric pollutants in eight major comprehensive economic zones from 2015 to 2019 |
| PM2.5/PM10 | PM2.5/CO | PM2.5/SO2 | SO2/NO2 | |
|---|---|---|---|---|
| 东北区 | 0.574 | 43.189 | 2.150 | 0.723 |
| 北部区 | 0.611 | 53.441 | 3.390 | 0.471 |
| 东部区 | 0.638 | 52.997 | 3.332 | 0.388 |
| 南部区 | 0.600 | 33.483 | 2.793 | 0.478 |
| 黄中区 | 0.518 | 43.647 | 2.188 | 0.778 |
| 长中区 | 0.626 | 46.903 | 3.060 | 0.605 |
| 西南区 | 0.604 | 40.197 | 2.584 | 0.551 |
| 西北区 | 0.395 | 44.871 | 2.515 | 0.667 |
| 中国北方 | 0.540 | 45.760 | 2.517 | 0.690 |
| 中国南方 | 0.601 | 44.338 | 2.835 | 0.533 |
表2 2015—2019年中国不同大气污染物之间的相关系数Tab. 2 Correlation coefficients of key atmospheric pollutants in China from 2015 to 2019 |
| CO | SO2 | NO2 | O3 | PM10 | PM2.5 | |
|---|---|---|---|---|---|---|
| CO | 1 | 0.950** | 0.822** | -0.846** | 0.741** | 0.955** |
| SO2 | 0.950** | 1 | 0.718** | -0.729** | 0.707** | 0.895** |
| NO2 | 0.822** | 0.718** | 1 | -0.828** | 0.799** | 0.879** |
| O3 | -0.846** | -0.729** | -0.828** | 1 | -0.581** | -0.815** |
| PM10 | 0.741** | 0.707** | 0.799** | -0.581** | 1 | 0.861** |
| PM2.5 | 0.955** | 0.895** | 0.879** | -0.815** | 0.861** | 1 |
注:**表示极显著(p<0.01)。 |
| [1] |
|
| [2] |
中华人民共和国生态环境部. GB 13223-2011火电厂大气污染物排放标准[S]. 北京: 中国标准出版社, 2012.
[ Ministry of Ecology and Environment of the People's Republic of China. GB 3095-2011Emission standards for air pollutants from thermal power plants[S]. Beijing: Standards Press of China, 2011. ]
|
| [3] |
|
| [4] |
|
| [5] |
中华人民共和国生态环境部. GB 3095-2012环境空气质量标准[S]. 北京: 中国标准出版社, 2012.
[ Ministry of Ecology and Environment of the People's Republic of China. GB 3095-2012 Ambient air quality standard[S]. Beijing: Standards Press of China, 2012. ]
|
| [6] |
|
| [7] |
汪行东. 城市人口规模、城市密度与环境污染——基于主要城市2003-2014年空气质量面板数据的研究[J]. 湖南第一师范学院学报, 2019,19(3):85-90,104.
[
|
| [8] |
董夏燕, 何庆红. 空气污染与中老年人心理健康的关系研究[J]. 中国经济问题, 2019(5):50-61.
[
|
| [9] |
刘旖. 中国空气污染的时空分布特征及影响因素分析[D]. 北京:北京交通大学, 2018.
[
|
| [10] |
|
| [11] |
|
| [12] |
|
| [13] |
|
| [14] |
|
| [15] |
肖悦. 中国空气质量时空分布特征及影响因素分析[D]. 重庆:西南大学, 2018.
[
|
| [16] |
高赢. 中国八大综合经济区绿色发展绩效及其影响因素研究[J]. 数量经济技术经济研究, 2019,36(9):3-23.
[
|
| [17] |
严超. 基于ArcGIS的大气污染物中二氧化硫的空间插值方法比较研究[J]. 山东化工, 2019,48(12):215-216.
[
|
| [18] |
丁卉. 三种区域空气质量空间插值方法对比研究[C]. 中国环境科学学会. 2013中国环境科学学会学术年会论文集(第八卷). 中国环境科学学会:中国环境科学学会, 2013: 680-687.
[
|
| [19] |
|
| [20] |
|
| [21] |
|
| [22] |
王甜甜, 陈良富, 陶金花, 等. 生物质燃烧对中国东北地区CO浓度的影响研究[J]. 遥感技术与应用, 2016,31(2):297-306.
[
|
| [23] |
马晓勇. 黄河中上游能源化工区(山西)生态环境现状及演变趋势[J]. 环境与可持续发展, 2012,37(6):108-112.
[
|
| [24] |
吴兑, 吴晟, 李菲, 等. 粗粒子气溶胶远距离输送造成华南严重大气污染的分析[J]. 中国环境科学, 2011,31(4):540-545.
[
|
| [25] |
付宏臣, 孙艳玲, 景悦. 基于地理加权回归模型的新疆地区PM_(2.5)遥感估算[J]. 天津师范大学学报(自然科学版), 2019,39(1):63-70,80.
[
|
| [26] |
|
| [27] |
|
| [28] |
|
| [29] |
于小红, 封秋娟. 山西冬季二氧化硫地面、高空分布个例分析[J]. 科技与创新, 2017(2):31-33.
[
|
| [30] |
李红军, 汤浩. 北疆春季沙尘暴极多与极少年环流场特征[J]. 沙漠与绿洲气象, 2017,11(1):35-40.
[
|
| [31] |
|
/
| 〈 |
|
〉 |
