
夜光遥感支持下的城市人口核密度空间化及自相关分析
|
孙小芳(1973— ),女,福建福州人,副教授,博士,主要从事遥感与GIS信息处理及应用研究。E-mail: sunxf99@163.com |
收稿日期: 2020-06-06
要求修回日期: 2020-08-08
网络出版日期: 2021-01-25
基金资助
福建省自然科学基金项目(2019J01769)
闽江学院资金项目(MYK18017)
版权
Spatialization and Autocorrelation Analysis of Urban Population Kernel Density Supported by Nighttime Light Remote Sensing
Received date: 2020-06-06
Request revised date: 2020-08-08
Online published: 2021-01-25
Supported by
Natural Science Foundation of Fujian(2019J01769)
Foundation of Minjiang College(MYK18017)
Copyright
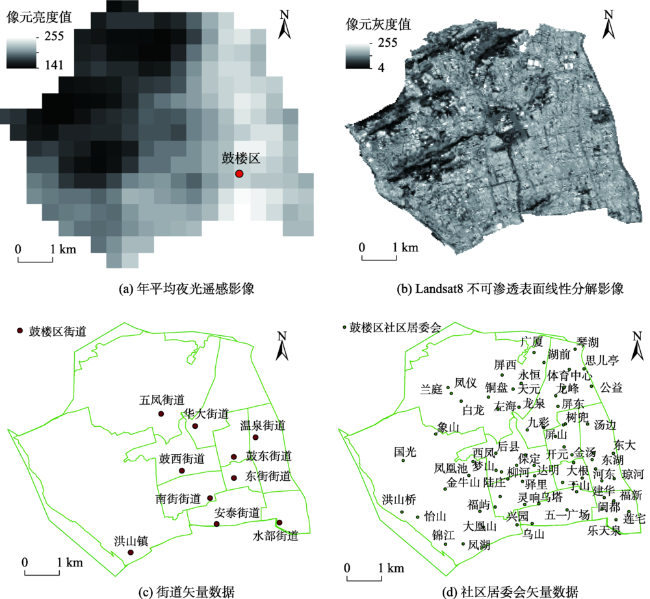
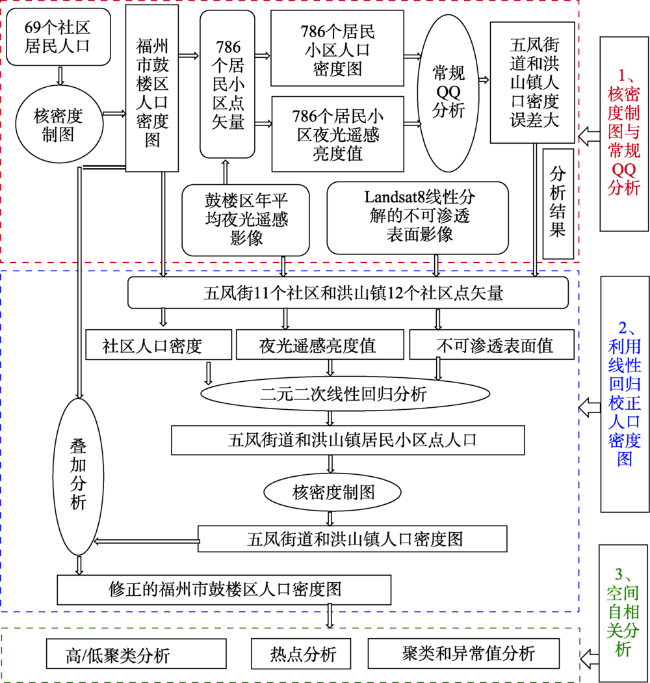
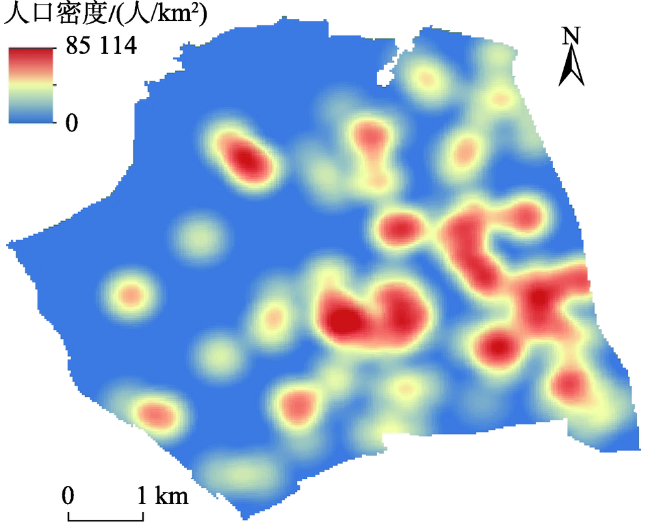
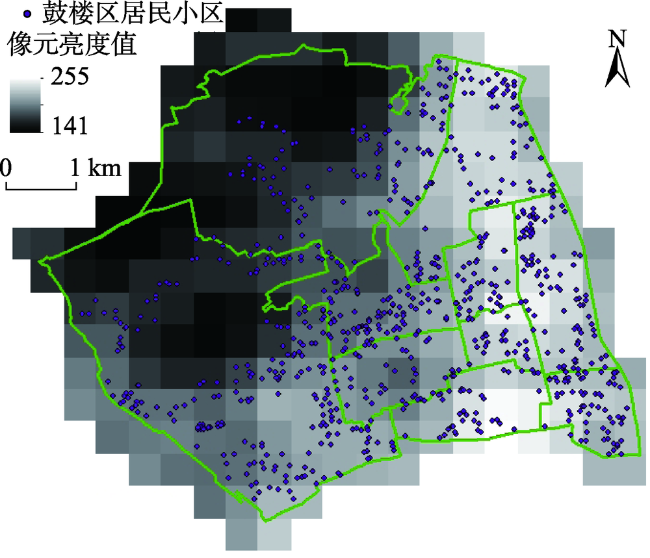
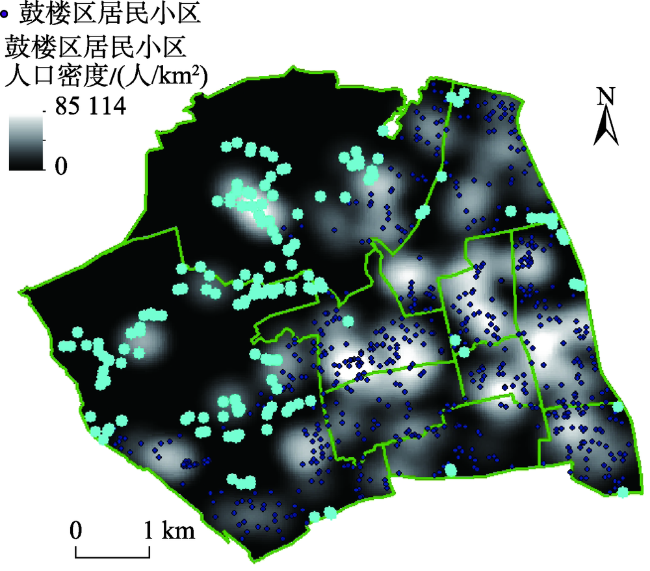
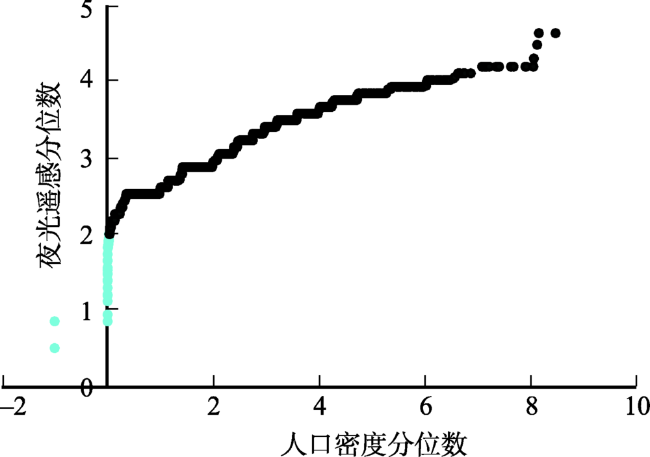
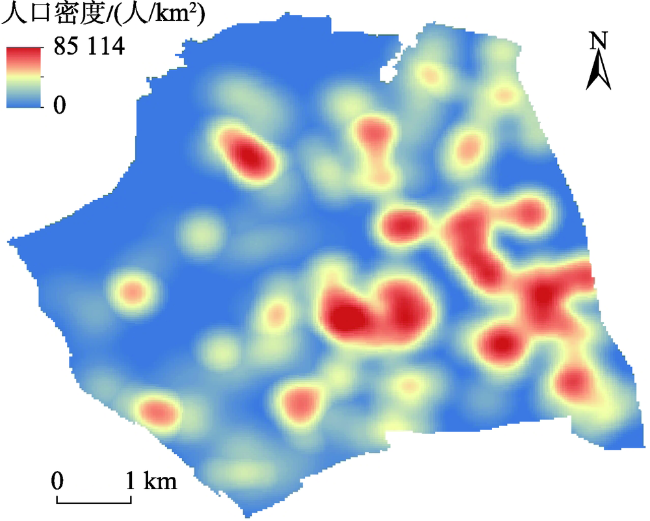
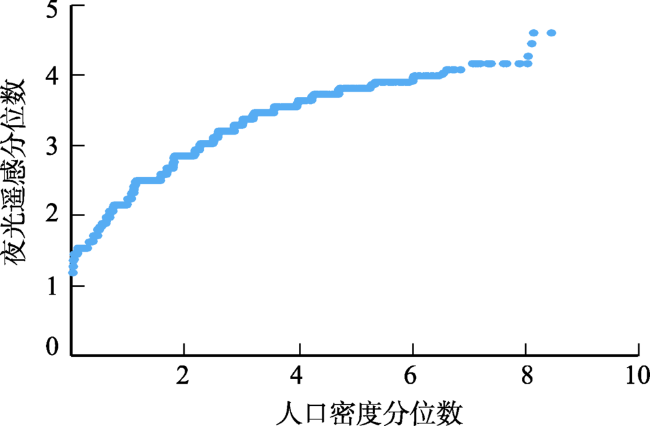
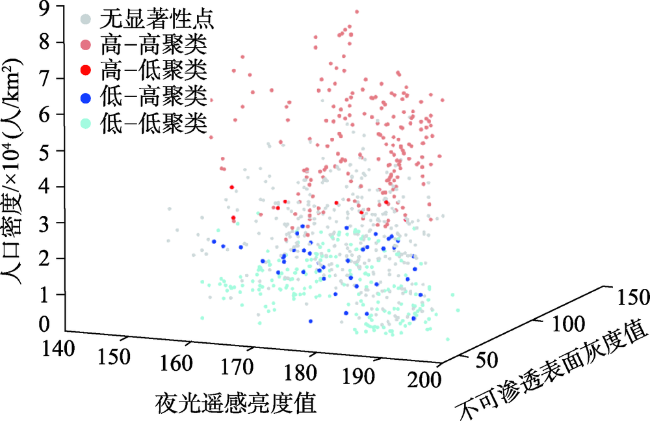
基于福建省福州市鼓楼区街道社区人口统计数据、夜光遥感影像、Landsat8影像,融合核密度与回归方程,绘制30 m栅格空间分辨率的人口密度图并进行空间自相关分析。方法:① 采用核密度方法对69个社区人口计算生成人口密度分布图。建立786个居民小区点的人口密度与夜光遥感的常规QQ分位图,检测出人口密度存在较大的误差区域:五凤街道和洪山镇。② 建立人口密度与夜光遥感、Landsat8线性分解的不可渗透表面影像之间的二元二次回归方程,修正两个区域的人口密度误差。③ 采用高/低聚类分析、热点分析、聚类和异常值分析,得到鼓楼区人口高聚类属性,显示了鼓楼区最大商业圈区域与人口密度最大居民点区域,展示了人口聚类的空间局部差异性格局。结果:① 研究中所采用的人口空间化技术融合了2种空间化方法:核密度与回归方程。生成30 m栅格空间分辨率的人口密度图。② 鼓楼区人口密度均值分为3种类型:11 000、25 000和50 000人/ km2,人口密度分布近似正态分布。③ 当鼓楼区人口密度均值大于33 000人/ km2,不可渗透表面灰度值与人口密度相关性更强。反之,夜光亮度值与人口密度相关性更强。

孙小芳 . 夜光遥感支持下的城市人口核密度空间化及自相关分析[J]. 地球信息科学学报, 2020 , 22(11) : 2256 -2266 . DOI: 10.12082/dqxxkx.2020.200289
Based on the demographic data, nighttime light remote sensing images and Landsat8 images of streets and communities in Gulou district, Fuzhou city, Fujian province, combined with the kernel density and regression equation are integrated to draw a 30 m spatial resolution population density map and conduct spatial autocorrelation analysis. Firstly, the population density distribution map of 69 communities are calculated by kernel density method. Based on a quantile-quantile plot between the population density and nighttime light remote sensing of 786 residential community points, we find that the population density has a large error in wufeng street and hongshan town. Secondly, the binary quadratic regression equation is established to correct the population density error in these two regions. This equation expresses the relationship between population density, and the impervious surface image of Landsat 8 using linear unmixing and nighttime light remote sensing. Thirdly, Getis-Ord General G, Getis-Ord Gi*, and Anselin local Moran I are used to obtain the high clustering attributes of population in Gulou district to show the largest business circle area, the largest population density residential area in the city, and the local spatial pattern of population clustering. In this study, the population spatialization technique integrates two spatialization methods: kernel density and regression equation. The population density map with 30 m spatial resolution is generated finally. The mean population density of Gulou district is divided into three types: 11 000 people/km2, 25 000 people/km2, and 50000 people/km2. The population density approximately obeys a normal distribution. When the mean population density of Gulou district is greater than 33 000 people/km2, the correlation between the impervious surface gray value and population density is stronger. Otherwise, the correlation between nighttime light remote sensing image and population density is stronger.
图3 2017年福州市鼓楼区人口核密度Fig. 3 The results of population by kernel in Gulou district,Fuzhou city in 2017 |
图4 2017年福州市鼓楼区年平均夜光遥感影像与居民小区Fig. 4 Nighttime light remote sensing annually average image density and residential area in Gulou district,Fuzhou city in 2017 |
图7 2017年鼓楼区人口核密度修正Fig. 7 The revised results of population by kernel density in Gulou district, Fuzhou city in 2017 |
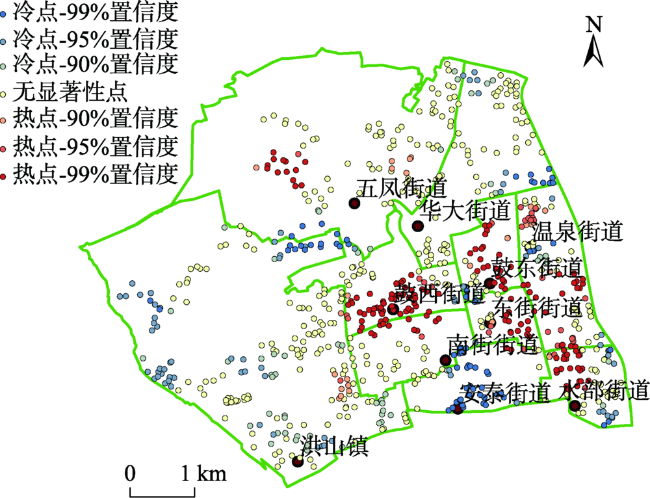
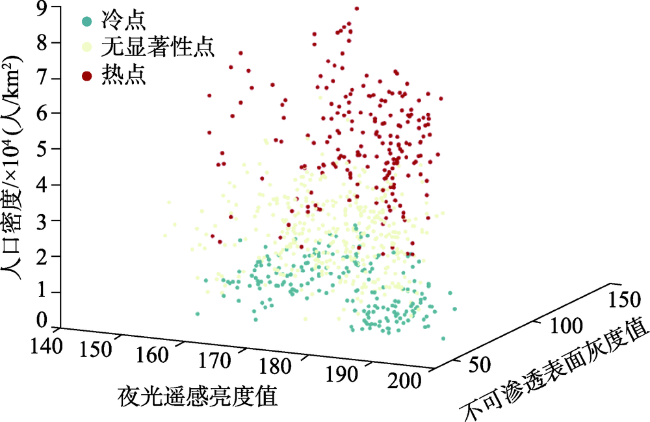
图10 人口密度热点分析三维散点图Fig. 10 Getis-Ord Gi* map of population density distribution in 3-dimensional scatter plot |
表1 热点分析统计值Tab. 1 Getis-ord gi* statistical value (人/ km2) |
| 人口密度 | 冷点 | 无显著性点 | 热点 |
|---|---|---|---|
| 平均值 | 10 548.223 | 25 421.024 | 50 813.094 |
| 标准差 | 6736.835 | 9760.771 | 13 661.261 |
| 峰度 | -0.772 | 0.097 | -0.294 |
| 偏度 | 0.269 | 0.150 | 0.021 |
| [1] |
李德仁, 李熙. 论夜光遥感数据挖掘[J]. 测绘学报, 2015,44(6):591-601.
[
|
| [2] |
李德仁, 余涵若, 李熙. 基于夜光遥感影像的”一带一路”沿线国家城市发展时空格局分析[J]. 武汉大学学报·信息科学版, 2017,42(6):711-720.
[
|
| [3] |
范长煜, 朱艳婷, 高雅静. 大数据在社会科学中的价值:以DMSP/OLS夜间灯光数据为例[J].华中理工大学学报(社会科学版),2016(1):1-9.
[
|
| [4] |
|
| [5] |
|
| [6] |
|
| [7] |
卓莉, 陈晋, 史培军. 基于夜间灯光数据的中国人口密度模拟[J]. 地理学报, 2005,60(2):266-276.
[
|
| [8] |
|
| [9] |
王钊, 杨山, 刘帅宾. 基于DMSP/OLS数据的江苏省城镇人口空间分异研究[J]. 长江流域资源与环境, 2015,24(12):2021-2029.
[
|
| [10] |
李鹏, 洪浩霖. 基于DMSP-OLS灯光数据的广东省城市人口估算[J]. 华南师范大学学报(自然科学版), 2015,47(2):102-107.
[
|
| [11] |
陈晴, 侯西勇, 吴莉. 基于土地利用数据和夜间灯光数据的人口空间化对比模型分析——以黄河三角洲高效生态经济区为例[J]. 人文地理, 2014,29(5):94-100.
[
|
| [12] |
李翔, 陈振杰, 吴洁璇, 等. 基于夜间灯光数据和空间回归模型的城市常住人口格网化方法研究[J]. 地球信息科学学报, 2017,19(10):1298-1305.
[
|
| [13] |
李欣欣, 王利, 何飞. 基于NPP/VIIRS夜间灯光数据和土地利用数据的人口分布图绘制——以大连金普新区为例[J]. 遥感信息, 2018,33(4):35-41.
[
|
| [14] |
|
| [15] |
阿里木江·卡斯木. 人口密度、夜间光数据及MODIS的全球城市分类[J]. 遥感信息, 2018,33(1):86-92.
[
|
| [16] |
|
| [17] |
许玲丽, 颜梅春. 多源信息多尺度视角的南京市街道级人口模拟研究[J].测绘通报,2019(2):71-75.
[
|
| [18] |
陈晴, 侯西勇. 集成土地利用数据和夜间灯光数据优化人口空间化模型[J]. 地球信息科学学报, 2015,17(11):1370-1377.
[
|
| [19] |
胡云锋, 赵冠华, 张千力. 基于夜间灯光与LUC数据的川渝地区人口空间化研究[J]. 地球信息科学学报, 2018,20(1):68-78.
[
|
| [20] |
|
| [21] |
周玉科, 高锡章, 倪希亮. 利用夜间灯光数据分析我国社会经济发展的区域不均衡特征[J]. 遥感技术与应用, 2017,32(6):1107-1113.
[
|
| [22] |
宿瑞博, 汪驰升, 王永全, 等. 志愿者民航客机夜光遥感方法与数据验证[J].测绘通报,2020(4):87-90,95.
[
|
| [23] |
汪驰升, 郭雪晴, 崔红星, 等. 城市天际线对地动态观测:一种新型城市突发事件遥感监测方式探讨[J].中国科学:技术科学,1-11. http://kns.cnki.net/kcms/detail/11.5844.TH.20200610.1528.006.html.(期刊网络已发表).
[
|
| [24] |
贾学勤. 福州市鼓楼年鉴-2018年[M]. 福州: 海峡出版发行集团海峡书局,2018年.
[
|
| [25] |
王勇. 福州统计年鉴-2018年[M]. 北京: 中国统计出版社,2018年.
[
|
/
| 〈 |
|
〉 |
