
中国气候舒适度时空分布特征分析
|
刘艳霞(1995— ),女,河北唐山市,硕士生,主要从事城市遥感研究。E-mail: liuyanxia@hhu.edu.cn |
收稿日期: 2019-09-11
要求修回日期: 2019-12-09
网络出版日期: 2021-02-25
基金资助
国家自然科学基金项目(41771446)
中央高校基本科研业务费项目(2018B18414)
版权
Spatio-Temporal Distribution Analysis of Climate Comfort Level in China
Received date: 2019-09-11
Request revised date: 2019-12-09
Online published: 2021-02-25
Supported by
National Natural Science Foundation of China(41771446)
Fundamental Research Funds for the Central Universities(2018B18414)
Copyright
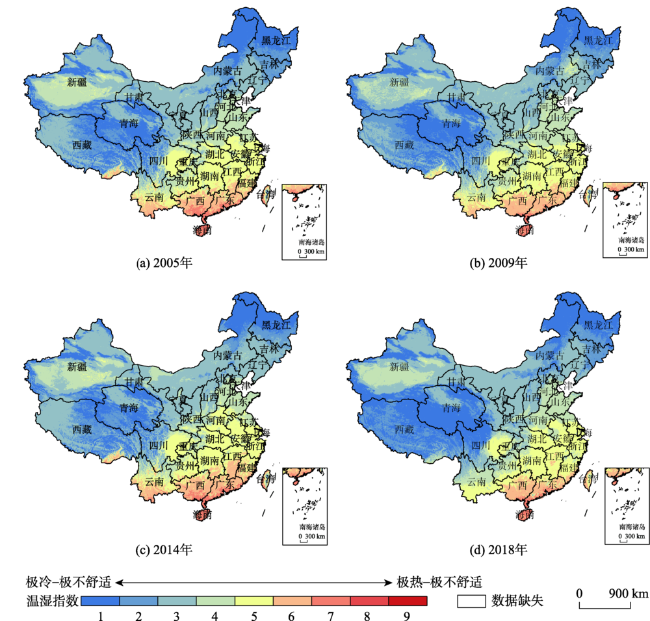
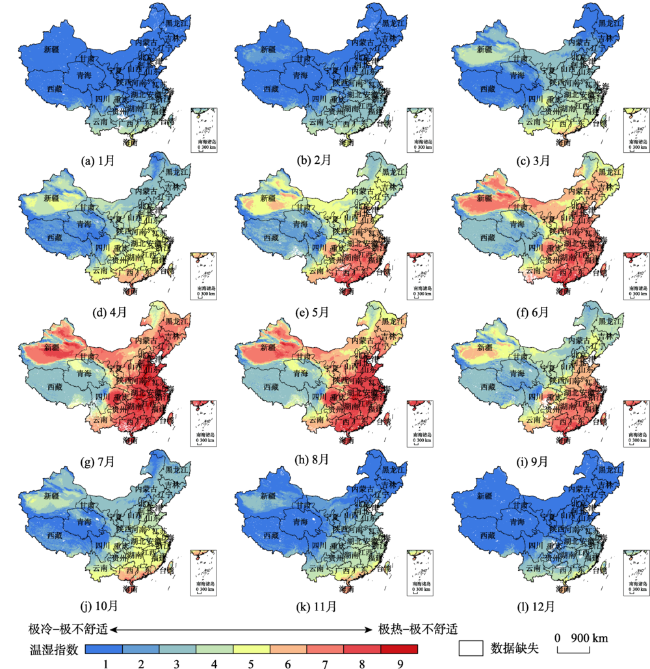
气候舒适度对人类活动和地区适宜性评价等研究具有重要意义,而温湿指数是气候舒适度评价的一项重要指标。传统的温湿指数计算都是基于站点数据,无法获取大尺度区域舒适度的时空变化特征。本文利用2005—2018年MODIS地表温度、大气可降水量数据,结合地理加权回归方法对经典温湿指数模型进行改进,计算并分析中国年均和月均气候舒适度时空演变特征。结果如下:① 采用GWR方法进行地表温度和气温的拟合,拟合精度(Adjusted R2=0.9~0.98,RMSE=0.14~1.89 ℃)较为理想,说明采用LST、NDVI、DEM作为自变量的地理加权回归分析,能够较精确地拟合地面气温;② 2005—2018年年均温湿指数统计结果表示,云南省累计舒适月数最多,高达167个月,中部省份相对于东南沿海省市舒适时期较多,最高舒适月数差值可达到41个月。中国年均舒适度空间分布规律基本保持一致,除新疆、西藏和东北的部分区域以外,舒适度空间呈现从南到北,舒适度等级由舒适变寒冷。从舒适度等级面积变化情况看,2005—2018年全国舒适度等级呈现由寒冷变舒适的趋势;③ 2018年全年舒适面积最大的月份为5月,其次为10月,不舒适月份集中在1月和7月,全国呈现极冷或极热。春季和秋季空间分布特征较为相似,呈现由东南到西北逐渐递减的趋势;除青藏高原地区外,夏季和冬季呈现由南到北递减趋势。舒适区域主要集中在低纬、中海拔地区。
刘艳霞 , 冯莉 , 田慧慧 , 阳少奇 . 中国气候舒适度时空分布特征分析[J]. 地球信息科学学报, 2020 , 22(12) : 2338 -2347 . DOI: 10.12082/dqxxkx.2020.190513
Climate comfort level has great significance to human activities and regional suitability assessment, and temperature humidity index is important for climate comfort evaluation. Traditional temperature-humidity index is obtained based on the observed data from some sations, which cannot reflect the spatio-temporal characteristics of climate comfort in large-scale areas. In this paper, the modified temperature humidity index model is proposed using Land Surface Temperature (LST) and Precipitable Water Vapor (PWV) from 2005 to 2018 retrieved from MODIS. Using this new index, the spatio-temporal characteristics of climate comfort level in China are calculated and analyzed. The results are shown as follows: (1) The GWR method is used to fit the surface temperature and air temperature. The fitting accuracy (Adjusted R2 = 0.90~0.98, RMSE = 0.14~1.89 ℃) is ideal, which indicates that LST, NDVI, and DEM are used as the independent variables for geographical weight Regression analysis can more accurately fit the air temperature; (2) The statistical results of the annual average temperature and humidity index from 2005 to 2018 show that the cumulative number of comfortable months in Yunnan Province is the most, up to 167 months, and the central provinces are relatively comfortable compared to the southeast coastal provinces, and the difference between the highest comfort months can reach 41 months. The spatial distribution of China's average annual comfort level is basically the same. Except for parts of Xinjiang, Tibet, and the northeast, the comfort level in China is from south to north, and the comfort level changes from comfortable to cold. Judging from the changes in the area of each comfort level, the national comfort level showed a trend from cold to comfortable from 2005 to 2018; (3) The month with largest comfortable area in 2018 is May, followed by October. Uncomfortable months are concentrated in January and July when the country is extremely cold or hot. The spatial distribution characteristics of spring and autumn are similar, showing a gradual decreasing trend from southeast to northwest; except for the Qinghai-Tibet Plateau, summer and winter show a decreasing trend from south to north. The comfort zone is mainly concentrated in low-latitude and middle-altitude areas.
表1 温湿指数分级标准Tab. 1 THI grade standard |
| 温湿指数(THI) | 人体感知 | 舒适感等级 |
|---|---|---|
| <40 | 极冷,极不舒适 | 1 |
| 40~45 | 寒冷,不舒适 | 2 |
| 45~55 | 偏冷,较不舒适 | 3 |
| 55~60 | 较凉爽,舒适 | 4 |
| 60~65 | 非常凉爽,非常舒适 | 5 |
| 65~70 | 比较凉爽,舒适 | 6 |
| 70~75 | 偏热,较不舒适 | 7 |
| 75~80 | 闷热,不舒适 | 8 |
| >80 | 极其闷热,极不舒适 | 9 |
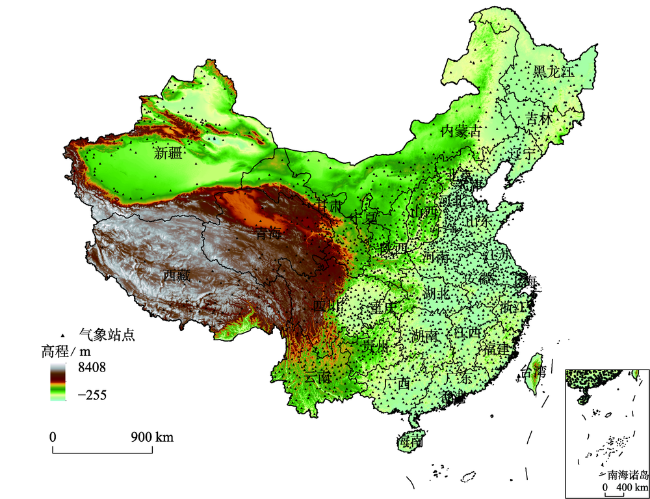
表2 气候舒适度分析采用的遥感数据Tab. 2 Remote sensing data for climate comfort level analysis |
| 数据类型 | 时间分辨率/d | 空间分辨率 | 来源 |
|---|---|---|---|
| 地表温度(Land Surface Temperature,LST) | 8 | 1 km | NASA官网 |
| 归一化植被指数(Normalized Difference Vegetation Index,NDVI) | 16 | 500 m | NASA官网 |
| 大气可降水量(Precipitable Water Vapor,PWV) | 1 | 5 km | NASA官网 |
| 数字高程模型(Digital Elevation Model,DEM) | - | 90 m | CGIAR-CSI SRTM |
表3 2018年各月气温GWR回归分析结果Tab. 3 Results of monthly temperature GWR regression analysis in 2018 |
| 月份 | R2 | AdjR2 | AICc | Sigma | 残差 | 标准误差 | ||
|---|---|---|---|---|---|---|---|---|
| 范围/℃ | -2~2 ℃误差站点所占百分比 | -1~1 ℃站点所占百分比 | ||||||
| 1 | 0.98 | 0.97 | 7689.73 | 1.28 | -3.08~4.72 | 91.37 | 74.40 | 0.16~1.23 |
| 2 | 0.98 | 0.98 | 6707.40 | 1.38 | -1.49~1.44 | 90.38 | 74.67 | 0.14~1.33 |
| 3 | 0.98 | 0.97 | 2678.30 | 1.44 | -2.44~3.41 | 90.98 | 74.86 | 0.17~1.39 |
| 4 | 0.96 | 0.94 | 1397.08 | 1.68 | -3.97~4.37 | 90.01 | 74.42 | 0.19~1.64 |
| 5 | 0.93 | 0.90 | 996.86 | 1.42 | -3.19~2.34 | 90.07 | 73.43 | 0.18~1.47 |
| 6 | 0.91 | 0.90 | 419.44 | 2.44 | -2.94~3.84 | 90.28 | 73.48 | 0.29~1.37 |
| 7 | 0.94 | 0.92 | 468.49 | 2.84 | -2.42~4.73 | 91.64 | 72.98 | 0.34~1.76 |
| 8 | 0.96 | 0.94 | 246.68 | 2.68 | -3.44~4.43 | 90.84 | 72.46 | 0.33~1.49 |
| 9 | 0.91 | 0.90 | 442.37 | 2.98 | -2.24~3.71 | 90.22 | 73.23 | 0.39~1.89 |
| 10 | 0.96 | 0.94 | 994.03 | 1.66 | -3.71~3.11 | 90.24 | 74.42 | 0.21~1.41 |
| 11 | 0.98 | 0.97 | 329.14 | 1.64 | -2.94~3.46 | 91.47 | 77.92 | 0.18~1.49 |
| 12 | 0.98 | 0.98 | 7302.13 | 1.26 | -1.67~3.46 | 91.64 | 74.74 | 0.16~1.22 |
表4 2018年各月站点气温与拟合结果的相对误差Tab. 4 Relative error of station temperature and fitting results in each month of 2018 |
| 站点名称 | 经度/°E | 纬度/°N | 高程/m | 月份 | |||||||||||
|---|---|---|---|---|---|---|---|---|---|---|---|---|---|---|---|
| 1 | 2 | 3 | 4 | 5 | 6 | 7 | 8 | 9 | 10 | 11 | 12 | ||||
| 哈尔滨 | 126.94 | 44.42 | 161 | 0.47 | 0.41 | 0.48 | 0.34 | 0.22 | 0.41 | 0.19 | 0.04 | 0.14 | 0.08 | 0.22 | 0.40 |
| 乌鲁木齐 | 87.62 | 43.78 | 903 | 0.71 | 1.44 | 3.38 | 4.06 | 4.78 | 4.19 | 4.78 | 4.44 | 3.87 | 4.21 | 2.90 | 0.04 |
| 喀什 | 76.78 | 39.24 | 1204 | 0.47 | 0.77 | 2.30 | 0.77 | 0.07 | 0.39 | 0.28 | 0.40 | 2.44 | 2.40 | 0.37 | 0.64 |
| 额济纳旗 | 101.07 | 41.94 | 940 | 0.20 | 0.41 | 0.39 | 0.14 | 0.29 | 0.84 | 0.99 | 1.36 | 0.16 | 0.88 | 1.48 | 0.16 |
| 敦煌 | 94.68 | 40.14 | 1136 | 3.37 | 2.31 | 3.70 | 2.43 | 2.17 | 2.11 | 2.12 | 2.44 | 2.88 | 2.37 | 2.94 | 3.48 |
| 酒泉 | 98.48 | 39.77 | 1470 | 0.26 | 0.94 | 0.81 | 0.34 | 0.49 | 0.32 | 0.49 | 0.49 | 0.27 | 0.31 | 0.24 | 0.10 |
| 民勤 | 103.08 | 38.63 | 1369 | 0.26 | 0.49 | 1.08 | 1.22 | 1.72 | 2.26 | 2.34 | 1.76 | 1.62 | 1.04 | 0.68 | 0.20 |
| 格尔木 | 94.90 | 36.42 | 2816 | 1.79 | 1.40 | 1.14 | 1.42 | 0.87 | 0.23 | 0.00 | 0.02 | 0.67 | 1.04 | 1.11 | 1.74 |
| 二连浩特 | 111.97 | 43.64 | 964 | 0.11 | 0.63 | 0.44 | 0.74 | 0.11 | 0.11 | 0.10 | 0.20 | 0.30 | 0.14 | 0.64 | 0.94 |
| 太原 | 112.33 | 37.62 | 776 | 0.26 | 0.24 | 0.17 | 0.69 | 0.62 | 0.49 | 0.44 | 0.62 | 0.36 | 0.24 | 0.34 | 0.76 |
| 沈阳 | 122.72 | 41.42 | 16 | 1.40 | 0.71 | 0.34 | 0.12 | 0.03 | 0.11 | 0.36 | 0.19 | 0.40 | 0.29 | 0.44 | 0.74 |
| 北京 | 116.33 | 39.74 | 44 | 0.49 | 0.91 | 0.70 | 0.30 | 0.42 | 0.44 | 0.17 | 0.63 | 0.41 | 0.41 | 0.38 | 0.82 |
| 大连 | 121.63 | 38.90 | 82 | 0.48 | 1.19 | 0.39 | 0.42 | 0.47 | 0.48 | 0.14 | 0.32 | 0.64 | 1.09 | 0.82 | 0.20 |
| 济南 | 116.98 | 36.68 | 37 | 0.46 | 0.40 | 0.97 | 0.71 | 0.60 | 0.47 | 0.40 | 0.82 | 0.49 | 0.46 | 0.49 | 0.44 |
| 那曲 | 91.10 | 32.34 | 4699 | 1.12 | 1.47 | 0.48 | 0.47 | 0.39 | 1.13 | 0.34 | 0.91 | 0.07 | 0.40 | 1.04 | 1.02 |
| 拉萨 | 91.13 | 29.67 | 3642 | 0.68 | 0.89 | 1.26 | 1.78 | 2.11 | 2.47 | 1.64 | 1.86 | 2.33 | 1.07 | 1.42 | 0.88 |
| 昌都 | 97.17 | 31.14 | 3342 | 1.74 | 2.27 | 2.20 | 2.69 | 0.82 | 0.43 | 2.20 | 1.96 | 0.01 | 1.38 | 0.44 | 0.48 |
| 腾冲 | 98.40 | 24.02 | 1634 | 0.03 | 0.30 | 0.32 | 0.36 | 0.06 | 0.13 | 0.07 | 0.32 | 0.04 | 0.09 | 0.00 | 0.19 |
| 昆明 | 102.68 | 24.02 | 1889 | 4.77 | 4.42 | 4.98 | 3.39 | 3.43 | 3.09 | 3.28 | 4.04 | 2.92 | 4.13 | 4.71 | 4.84 |
| 西安 | 108.92 | 34.14 | 431 | 1.38 | 1.10 | 1.60 | 1.70 | 1.71 | 1.16 | 1.48 | 1.67 | 1.41 | 1.42 | 1.24 | 1.11 |
| 郑州 | 113.37 | 34.44 | 401 | 0.42 | 0.48 | 0.40 | 0.44 | 1.99 | 0.70 | 0.23 | 0.84 | 0.44 | 0.31 | 0.44 | 0.47 |
| 宜昌 | 111.00 | 30.80 | 294 | 0.34 | 0.38 | 0.32 | 0.46 | 0.34 | 0.42 | 0.37 | 0.32 | 0.04 | 0.04 | 0.14 | 0.37 |
| 贵阳 | 106.60 | 26.84 | 1243 | 1.46 | 1.92 | 1.84 | 2.39 | 2.96 | 2.38 | 3.22 | 3.09 | 2.31 | 3.14 | 2.28 | 2.10 |
| 桂林 | 110.30 | 24.32 | 149 | 2.20 | 0.49 | 0.49 | 0.60 | 0.70 | 0.37 | 0.47 | 0.07 | 0.28 | 0.24 | 0.47 | 0.94 |
| 上海 | 121.44 | 31.62 | 3 | 0.67 | 0.24 | 0.60 | 0.47 | 0.24 | 0.43 | 1.02 | 0.70 | 0.31 | 0.23 | 0.34 | 0.33 |
| 福州 | 119.28 | 26.08 | 16 | 0.44 | 0.09 | 0.29 | 0.41 | 0.24 | 0.47 | 0.37 | 0.24 | 0.12 | 0.18 | 0.20 | 0.27 |
表5 2005—2018年中国年均舒适度等级覆盖面积及百分比Tab. 5 Distribution of comfort level by total area and percentage of area from 2005 to 2018 (万km2,%) |
| 年份 | 极冷-极不舒适 | 寒冷-不舒适 | 偏冷-不舒适 | 凉爽-舒适 | 非常凉爽-非常舒适 | 比较凉爽-舒适 | 偏热-不舒适 | 闷热-不舒适 | ||||||||
|---|---|---|---|---|---|---|---|---|---|---|---|---|---|---|---|---|
| 面积 | 百分比 | 面积 | 百分比 | 面积 | 百分比 | 面积 | 百分比 | 面积 | 百分比 | 面积 | 百分比 | 面积 | 百分比 | 面积 | 百分比 | |
| 2005 | 200.65 | 20.91 | 144.93 | 15.10 | 293.44 | 30.58 | 145.11 | 15.12 | 120.79 | 12.59 | 41.73 | 4.35 | 12.67 | 1.32 | 0.17 | 0.02 |
| 2009 | 202.60 | 21.11 | 148.66 | 15.49 | 316.21 | 32.95 | 134.09 | 13.97 | 114.31 | 11.91 | 38.19 | 3.98 | 5.54 | 0.58 | - | - |
| 2014 | 165.23 | 17.22 | 119.95 | 12.50 | 345.07 | 35.96 | 133.78 | 13.94 | 132.75 | 13.84 | 49.48 | 5.16 | 13.21 | 1.38 | 0.03 | - |
| 2018 | 160.86 | 16.76 | 264.16 | 14.87 | 264.16 | 27.51 | 134.51 | 14.10 | 115.16 | 11.99 | 136.11 | 14.18 | 6.68 | 0.70 | 0.001 | - |
注:该时期不存在“极其闷热-极不舒适”舒适度等级,“-”表示计算结果太小忽略不计。 |
| [1] |
王琛智, 张朝, 周脉耕, 等. 低温对中国居民健康影响的空间差异性分析[J]. 地球信息科学学报, 2017,19(3):336-345.
[
|
| [2] |
刘俊, 李云云, 刘浩龙, 等. 气候变化对成都桃花观赏旅游的影响与人类适应行为[J]. 地理研究, 2016,35(3):504-512.
[
|
| [3] |
左冰洁, 孙玉军. 南方亚热带季风区将乐县森林植被动态变化及其对气候变化的响应[J]. 地球信息科学学报, 2019,21(6):958-968.
[
|
| [4] |
刘俊, 黄莉, 孙晓倩, 等. 气候变化对中国观鸟旅游的影响——基于鸟类物候变化的分析[J]. 地理学报, 2019,74(5):912-922.
[
|
| [5] |
王连喜, 陈怀亮, 李琪, 等. 植物物候与气候研究进展[J]. 生态学报, 2010,30(2):447-454.
[
|
| [6] |
李亚滨, 王晓明, 李重操. 黑龙江省人体舒适度气候指数初步分析[J]. 黑龙江气象, 2009,26(2):22-24.
[
|
| [7] |
王远飞, 沈愈. 上海市夏季温湿效应与人体舒适度[J]. 华东师范大学学报(自然科学版), 1998(3):60-66.
[
|
| [8] |
|
| [9] |
|
| [10] |
李山, 孙美淑, 张伟佳, 等. 中国大陆1961-2010年间气候舒适期的空间格局及其演变[J]. 地理研究, 2016,35(11):2053-2070.
[
|
| [11] |
曹云, 孙应龙, 吴门新. 近50年京津冀气候舒适度的区域时空特征分析[J]. 生态学报, 2019,39(20):1-16.
[
|
| [12] |
曹永强, 高璐, 王学凤. 近30年辽宁省夏季人体舒适度区域特征分析[J]. 地理科学, 2016,36(8):1205-1211.
[
|
| [13] |
张曦月, 姜超, 孙建新, 等. 气候舒适度在不同海拔的时空变化特征及其影响因素[J]. 应用生态学报, 2018,29(9):2808-2818.
[
|
| [14] |
马丽君, 孙根年, 谢越法, 等. 50年来东部典型城市旅游气候舒适度变化分析[J]. 资源科学, 2010,32(10):1963-1970.
[
|
| [15] |
唐进时, 申双和, 华荣强, 等. 热气候指数评价中国南方城市夏季舒适度[J]. 气象科学, 2015,35(6):769-774.
[
|
| [16] |
覃志豪,
[
|
| [17] |
崔晓临, 程贇, 张露, 等. 基于DEM修正的MODIS地表温度产品空间插值[J]. 地球信息科学学报, 2018,20(12):1768-1776.
[
|
| [18] |
|
| [19] |
|
| [20] |
陈小瑜, 闫远方. 基于TM/ETM+的泉州市区人体舒适度研究[J]. 科技和产业, 2015,15(12):124-130.
[
|
| [21] |
赵璊璊, 冯莉, 郭松, 等. 景观格局影响下的南京市热舒适度动态变化[J]. 长江流域资源与环境, 2018,27(8):1712-1724.
[
|
| [22] |
谢雯, 任黎秀, 姜立鹏. 基于MODIS数据的旅游温湿指数时空分布研究[J]. 地理与地理信息科学, 2006,22(5):31-35.
[
|
| [23] |
樊智宇, 詹庆明, 刘慧民, 等. 武汉市夏季城市热岛与不透水面增温强度时空分布[J]. 地球信息科学学报, 2019,21(2):226-235.
[
|
| [24] |
|
| [25] |
|
| [26] |
|
| [27] |
张丹, 刘昌明, 付永锋, 等. 基于MODIS数据的中国地面水汽压模拟与分析[J]. 资源科学, 2012,34(1):74-80.
[
|
| [28] |
黄耀欢, 江东, 庄大方, 等. 基于MODIS遥感数据地表水汽压估算[J]. 地理科学进展, 2010,29(9):1137-1142.
[
|
| [29] |
杨景梅, 邱金桓. 用地面湿度参量计算我国整层大气可降水量及有效水汽含量方法的研究[J]. 大气科学, 2002,26(1):9-22.
[
|
| [30] |
胡毅, 李萍, 杨建功. 应用气象学[M]. 北京: 气象出版社, 2005.
[
|
| [31] |
周淑贞. 气象学与气候学(第三版)[M]. 北京: 高等教育出版社, 1997.
[
|
| [32] |
刘清春, 王铮, 许世远. 中国城市旅游气候舒适性分析[J]. 资源科学, 2007,29(1):133-141.
[
|
| [33] |
孔钦钦, 郑景云, 王新歌. 1979-2014年中国气候舒适度空间格局及时空变化[J]. 资源科学, 2016,38(6):1129-1139 .
[
|
/
| 〈 |
|
〉 |
