
基于地理探测器的中国中部城市土地绿色利用效率时空演变及影响因素研究
|
赵丹丹(1979— ),女,湖北麻城人,博士,讲师,研究方向为土地利用与生态环境。E-mail: 178987618@qq.com |
收稿日期: 2020-06-15
要求修回日期: 2020-10-12
网络出版日期: 2021-02-25
基金资助
中国博士后科学基金第65批面上资助项目(2019M652271)
2019年度湖南省社会科学成果评审委员会一般课题(XSP19YBZ141)
江西财经大学2019年度研究生创新项目
版权
Analysis of Spatial-temporal Evolution and Influencing Factors of Green Land Use Efficiency in Central China based on Geographic Detector
Received date: 2020-06-15
Request revised date: 2020-10-12
Online published: 2021-02-25
Supported by
The 65th batch of general projects of China Postdoctoral Science Foundation(2019M652271)
General topics of the Hunan Provincial Social Science Achievement Review Committee in 2019(XSP19YBZ141)
Jiangxi University of finance and economics graduate innovation project in 2019
Copyright
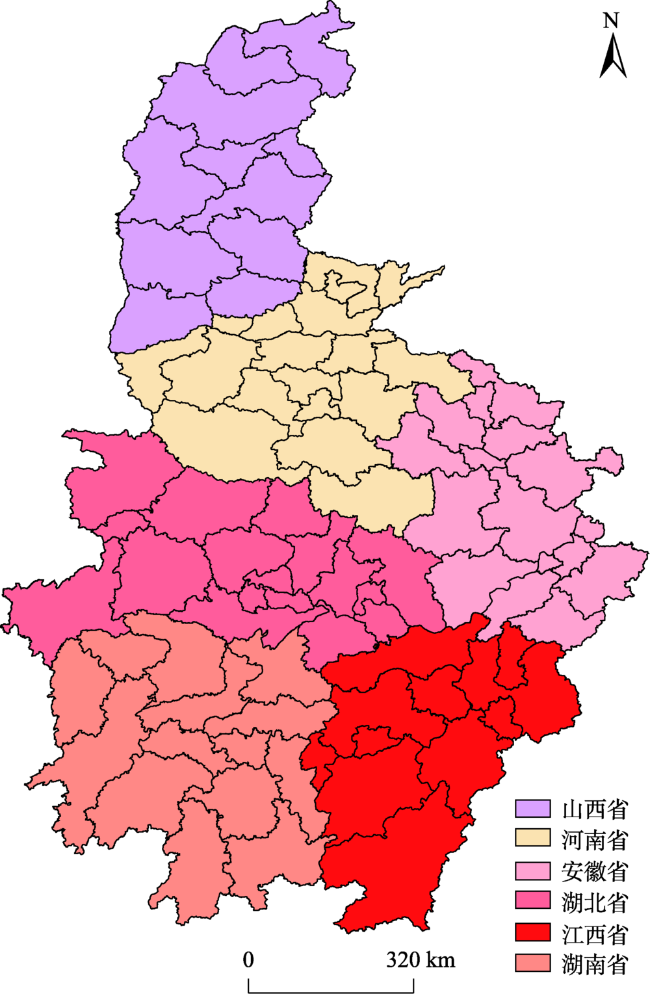
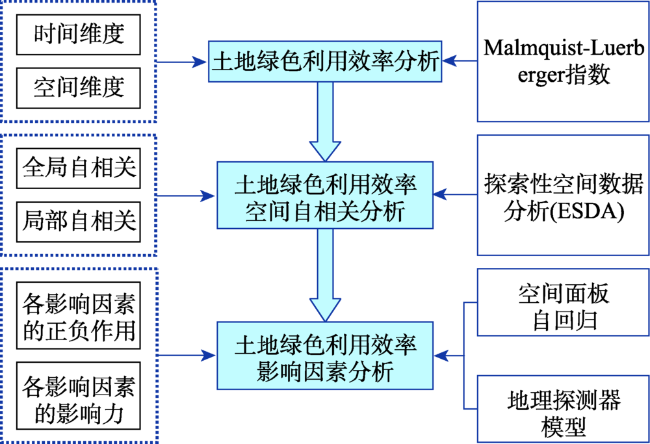
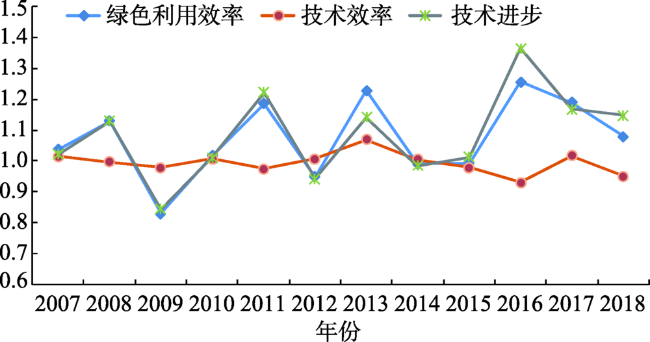
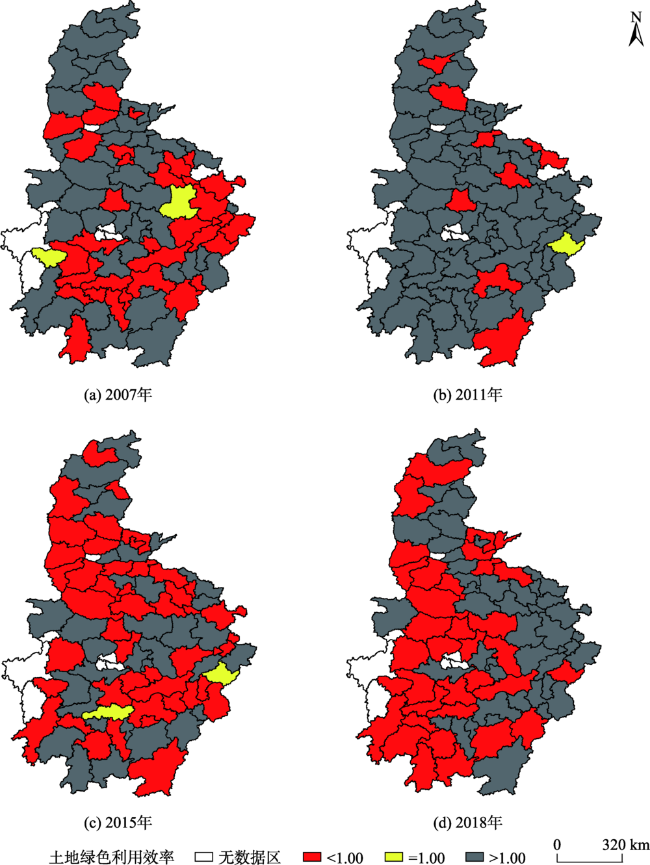
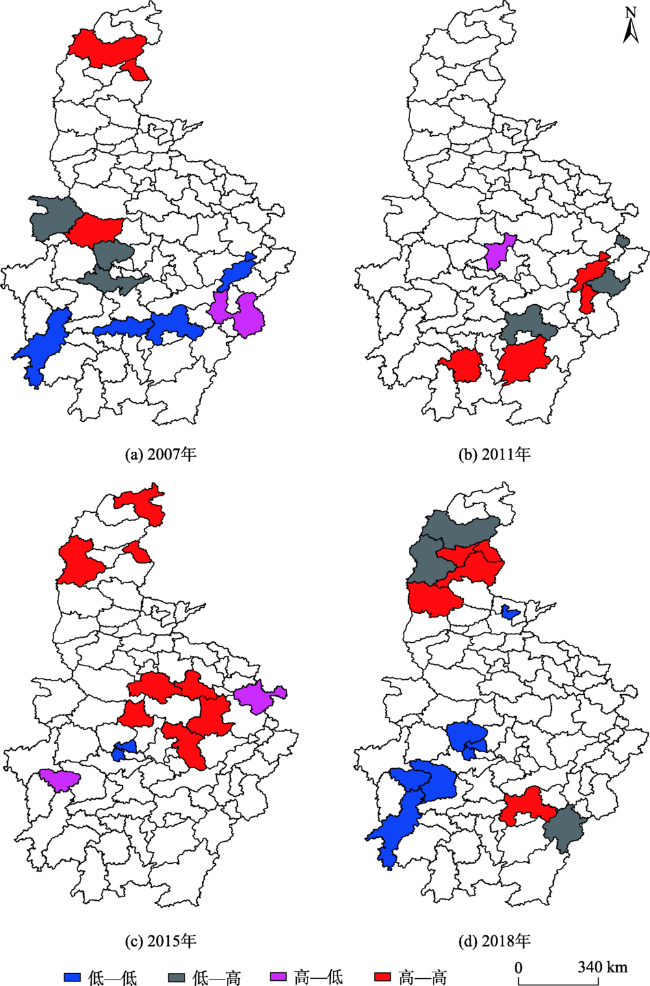
中部崛起战略后,中国中部六省(湖北省、湖南省、安徽省、山西省、江西省和河南省)经济快速发展,建成区面积不断扩张,不仅威胁粮食安全,更加剧资源环境约束。在此背景下,本文采用2007—2018年中部六省80个地级市面板数据,并运用Malmquist-Luerberger指数、重心模型、空间计量模型和地理探测器模型分析中部六省80个地级市土地绿色利用效率时演变、重心移动轨迹变化及其影响因素情况。结果表明:① 2007—2018年中部六省土地绿色利用效率增长是靠技术进步“单轨驱动”的。② 城市土地绿色利用效率值表现出明显的空间分异特征,且重心总体向东北方向移动。③ 中部六省各地级市之间土地绿色利用效率存在空间依赖性和空间溢出效应。④ 除城市建设用地面积外,城镇化率、产业结构高级化水平、经济发展水平、外商直接投资额均正向影响中部六省80个地级市土地绿色利用效率。其中,各个影响因素对土地绿色利用效率的影响从强到弱依次为产业结构高级化水平、外商直接投资额、建设用地面积、城镇化率、经济发展水平。
赵丹丹 , 金声甜 , 鲍丙飞 , 张利国 . 基于地理探测器的中国中部城市土地绿色利用效率时空演变及影响因素研究[J]. 地球信息科学学报, 2020 , 22(12) : 2358 -2370 . DOI: 10.12082/dqxxkx.2020.200286
After the Chinese government put forward the Rise of Central China Plan, it rapidly facilitates the economy development of Henan province, Hubei province, Hunan province, Jiangxi province, Anhui province and Shanxi province which has gradually become the fourth growth pole driving national economic growth, has caused the built-up area to expand and arable land to decrease, which not only threaten food security, but also impose resource and environmental constraints. In the context, based on the panel data of 80 prefecture-level cities in six provinces of central China from 2007 to 2018, this paper analyzes the green-efficiency of land use and its evolution, the trajectory of gravity center change, influencing factors of green-efficiency of land use and its influence degree applying Malmquist-Luerberger index, gravity center model, spatial econometric regression model and geographical detector model. The results show that ① the green-efficiency of land use and technological progress in the six provinces of central China from 2007 to 2018 fluctuated frequently and their change pace was basically the same, while the technological efficiency was relatively stable, indicating the green-efficiency of land use was “single-track” driven by technological progress. ② The green-efficiency of urban land use showed obvious spatial differentiation characteristics, and the center of gravity generally moved to the northeast part of Central China. ③ It showed spatial dependence and spatial spillover effects on the green-efficiency of land use at the provincial level and prefecture level, the green-efficiency of land use among the prefecture-level cities is mainly in the high-high and low-low level. ④ In addition to the area of urban construction land, urbanization rate, the advanced level of industrial structure, the level of economic development, and the amount of foreign direct investment all positively affect the green-efficiency of land use in 80 prefecture-level cities of six central provinces. Among them, the influence degree of various factors on the green-efficiency of land use from strong to weak, in order, is the advanced level of industrial structure, the amount of foreign direct investment, the area of urban construction land, the urbanization rate and the level of economic development.
表1 2007—2018年中部六省土地绿色利用效率全局Moran's I指数结果Tab. 1 Global Moran's I index results of land green use efficiency in six provinces in central China from 2000 to 2018 |
| 年份 | 土地绿色利用效率 | |||
|---|---|---|---|---|
| Moran's I指数 | 均值 | 标准差 | P值 | |
| 2007 | 0.0720 | -0.0181 | 0.0605 | 0.0500 |
| 2008 | 0.1497 | -0.0135 | 0.0619 | 0.0040 |
| 2009 | 0.0960 | -0.0146 | 0.0653 | 0.0480 |
| 2010 | 0.2480 | -0.0112 | 0.0681 | 0.0010 |
| 2011 | 0.1712 | -0.0116 | 0.0638 | 0.0070 |
| 2012 | 0.2561 | -0.0120 | 0.0695 | 0.0020 |
| 2013 | 0.2082 | -0.0112 | 0.0672 | 0.0020 |
| 2014 | 0.1919 | -0.0100 | 0.0663 | 0.0050 |
| 2015 | 0.1700 | -0.0122 | 0.0680 | 0.0120 |
| 2016 | 0.1934 | -0.0097 | 0.0678 | 0.0040 |
| 2017 | 0.3957 | -0.0113 | 0.0672 | 0.0010 |
| 2018 | 0.2834 | -0.0132 | 0.0665 | 0.0010 |
表2 中部六省土地绿色利用效率影响因素回归结果Tab. 2 Regression results of influencing factors of land green utilization efficiency in six provinces in central China |
| 变量 | 模型Ⅰ SAR双向固定回归结果 | 模型Ⅱ 稳健性检验① | 模型Ⅲ 稳健性检验② | |||
|---|---|---|---|---|---|---|
| 回归系数 | T值 | 回归系数 | T值 | 回归系数 | T值 | |
| X1 | -0.5576*** | -2.9200 | -0.5527*** | -2.8900 | -0.5578*** | -2.9200 |
| X2 | 0.0309** | 2.1400 | 0.0303** | 2.0900 | 0.0313** | 2.1700 |
| X3 | 0.0670 | 0.2800 | 0.0600 | 0.2600 | 0.0700 | 1.6800 |
| X4 | 0.5713* | 1.9400 | 0.5831* | 1.9900 | 0.5725* | 1.9500 |
| X5 | 0.0111*** | 5.3900 | 0.0110*** | 5.3300 | 0.0110*** | 5.4200 |
| ρ | 0.6254*** | 0.5310*** | 0.4320*** | |||
| R2 | 0.3900 | 0.4700 | 0.4800 | |||
| LogL | 23.6154 | 23.4366 | 23.3704 | |||
| AIC | 61.2308 | 60.8733 | 60.7409 | |||
| BIC | 95.2994 | 94.9418 | 94.8094 | |||
注:*、**、***分别表示在10%、5%、1%水平下通过显著性检验。 |
表3 中部各市土地绿色利用效率影响因素地理探测结果Tab. 3 Geographical exploration results of influencing factors of land green use efficiency in cities in central China |
| 变量 | 建设用地面积 X1 | 城镇化率 X2 | 产业结构高级化水平 X3 | 经济发展水平 X4 | 外商直接投资额 X5 |
|---|---|---|---|---|---|
| q | 0.15 | 0.03 | 0.25 | 0.03 | 0.19 |
| p | 0.67 | 0.99 | 0.49 | 0.86 | 0.18 |
| q排序 | 3 | 4 | 1 | 5 | 2 |
表4 2007—2018年中部各市土地绿色利用效率影响因素变化地理探测结果Tab. 4 Geographical exploration results of change of influencing factors of land green use efficiency in cities in central China from 2007 to 2018 |
| 年份 | q排序 | ||||
|---|---|---|---|---|---|
| 建设用地面积X1 | 城镇化率X2 | 产业结构高级化水平X3 | 经济发展水平X4 | 外商直接投资额X5 | |
| 2007 | 1 | 3 | 4 | 2 | 5 |
| 2011 | 1 | 5 | 2 | 4 | 3 |
| 2015 | 4 | 2 | 1 | 5 | 3 |
| 2018 | 3 | 4 | 1 | 5 | 2 |
| [1] |
卢新海, 杨喜, 陈泽秀. 中国城市土地绿色利用效率测度及其时空演变特征[J]. 中国人口·资源与环境, 2020,30(8):83-91.
[
|
| [2] |
梁流涛, 雍雅君, 袁晨光. 城市土地绿色利用效率测度及其空间分异特征——基于284个地级以上城市的实证研究[J]. 中国土地科学, 2019,33(6):80-87.
[
|
| [3] |
黄蕊, 王铮, 刘慧雅, 等. 中国中部六省的碳排放趋势研究[J]. 经济地理, 2012,32(7):12-17.
[
|
| [4] |
严芝清. 中国西南边疆山区省份城市土地利用效率的时空差异与影响因素研究[D]. 昆明:云南财经大学, 2020.
[
|
| [5] |
|
| [6] |
|
| [7] |
沈涛. 国内外有关土地利用的研究综述[J]. 当代经济, 2013(24):156-157.
[
|
| [8] |
|
| [9] |
|
| [10] |
|
| [11] |
|
| [12] |
|
| [13] |
孟成, 卢新海, 彭明军, 等. 基于土地税收的土地利用效率计算方法研究[J]. 中国土地科学, 2016,30(7):56-63,2.
[
|
| [14] |
梁流涛, 赵庆良, 陈聪. 中国城市土地利用效率空间分异特征及优化路径分析——基于287个地级以上城市的实证研究[J]. 中国土地科学, 2013,27(7):48-54.
[
|
| [15] |
张立新, 朱道林, 杜挺, 等. 基于DEA模型的城市建设用地利用效率时空格局演变及驱动因素[J]. 资源科学, 2017,39(3):418-429.
[
|
| [16] |
詹国辉. 城市建设用地利用效率及其影响因素探究——以江苏省13个城市为例[J]. 华东经济管理, 2017,31(6):11-15.
[
|
| [17] |
|
| [18] |
朱立祥, 雒占福, 王启雯, 等. 环境约束下的甘肃省城市土地利用效率时空差异及其演进特征[J]. 水土保持研究, 2020,27(4):368-375.
[
|
| [19] |
薛建春, 郑海潮, 王雅荣. 基于Super-SBM和重心模型的中国城市群土地利用效率时空差异分析[J]. 湖北社会科学, 2019(12):70-77.
[
|
| [20] |
陈恩, 董捷, 徐磊. 长江经济带城市土地利用效率时空差异与收敛性分析[J]. 资源开发与市场, 2018,34(3):316-321.
[
|
| [21] |
李菁, 胡碧霞, 匡兵, 等. 中国城市土地利用效率测度及其动态演进特征[J]. 经济地理, 2017,37(8):162-167.
[
|
| [22] |
杨清可, 段学军, 叶磊, 等. 基于SBM-Undesirable模型的城市土地利用效率评价——以长三角地区16城市为例[J]. 资源科学, 2014,36(4):712-721.
[
|
| [23] |
张利国, 鲍丙飞. 我国粮食主产区粮食全要素生产率时空演变及驱动因素[J]. 经济地理, 2016,36(3):147-152.
[
|
| [24] |
王利利. 环境约束下的我国工业能源效率区域差异及影响因素研究[D]. 大连:东北财经大学, 2018.
[
|
| [25] |
|
| [26] |
|
| [27] |
韩燕, 张苑. 甘肃省县域经济差异时空分异及影响因子研究[J]. 地球信息科学学报, 2019,21(11):1735-1744.
[
|
| [28] |
尹上岗, 李在军, 宋伟轩, 等. 基于地理探测器的南京市住宅租金空间分异格局及驱动因素研究[J]. 地球信息科学学报, 2018,20(8):1139-1149.
[
|
| [29] |
杨丰硕, 杨晓梅, 王志华, 等. 江西省典型县域经济差异影响因子地理探测研究[J]. 地球信息科学学报, 2018,20(1):79-88.
[
|
| [30] |
王德起, 庞晓庆. 京津冀城市群绿色土地利用效率研究[J]. 中国人口·资源与环境, 2019,29(4):68-76.
[
|
| [31] |
杨清可, 段学军, 叶磊, 等. 基于SBM-Undesirable模型的城市土地利用效率评价——以长三角地区16城市为例[J]. 资源科学, 2014,36(4):712-721.
[
|
| [32] |
范建双, 虞晓芬. 土地利用效率的区域差异与产业差异的收敛性检验[J]. 统计与决策, 2015,34(10):99-103.
[
|
| [33] |
张英浩, 陈江龙, 高金龙, 等. 经济转型视角下长三角城市土地利用效率影响机制[J]. 自然资源学报, 2019,34(6):1157-1170.
[
|
| [34] |
胡碧霞, 李菁, 匡兵. 绿色发展理念下城市土地利用效率差异的演进特征及影响因素[J]. 经济地理, 2018,38(12):183-189.
[
|
| [35] |
罗谷松, 李涛. 碳排放影响下的中国省域土地利用效率差异动态变化与影响因素[J]. 生态学报, 2019,39(13):4751-4760.
[
|
| [36] |
国家统计局. 中国统计年鉴[M]. 北京: 中国统计出版社,2007- 2019.
[ National Bureau of Statistics. China Statistical Yearbook[M]. Beijing: China Statistics Press, 2007- 2019. ]
|
| [37] |
国家统计局城市社会经济调查司. 中国城市统计年鉴[M]. 北京: 中国统计出版社, 2007-2019.
[ Cities Socioeconomic survey office National bureau of statistics. China citystatistics yearbook[M]. Beijing: China Statistics Press, 2007-2019. ]
|
| [38] |
潘丹. 考虑资源环境因素的中国农业生产率研究[D]. 南京:南京农业大学, 2012.
[
|
| [39] |
金声甜, 肖文海, 杨胜苏, 等. 长江经济带土地利用变化及其生态系统响应[J]. 经济地理, 2020,40(7):166-173.
[
|
| [40] |
胡晓琳. 中国省际环境全要素生产率测算、收敛及其影响因素研究[D]. 南昌:江西财经大学, 2016.
[
|
/
| 〈 |
|
〉 |