
接驳地铁站的共享单车源汇时空特征及其影响因素
|
高 楹(1997— ),男,北京人,硕士生,主要从事GIS空间分析理论及应用。E-mail: thankyoumyfriend@126.com |
收稿日期: 2020-07-06
修回日期: 2020-08-23
网络出版日期: 2021-03-25
基金资助
国家自然科学基金项目(41525004)
国家自然科学基金项目(42071436)
版权
Spatial-temporal Characteristics and Influencing Factors of Source and Sink of Dockless Sharing Bicycles Connected to Subway Stations
Received date: 2020-07-06
Revised date: 2020-08-23
Online published: 2021-03-25
Supported by
National Natural Science Foundation of China(41525004)
National Natural Science Foundation of China(42071436)
Copyright
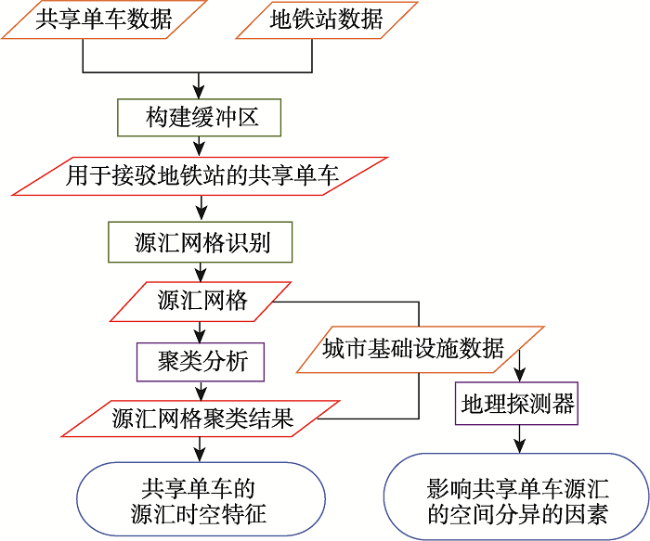
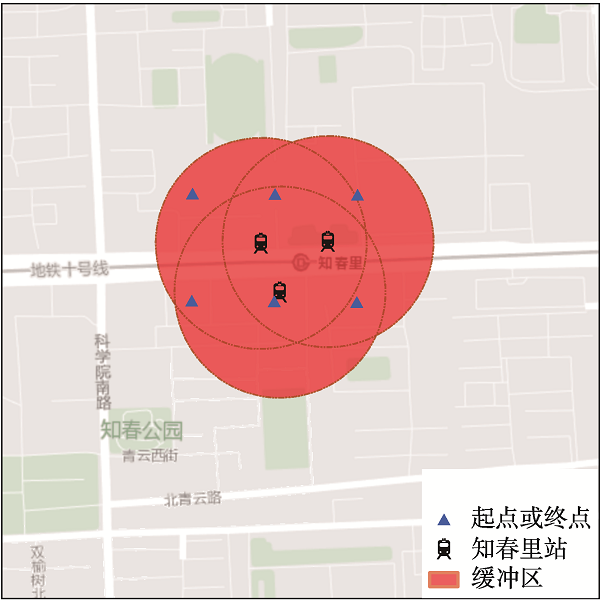
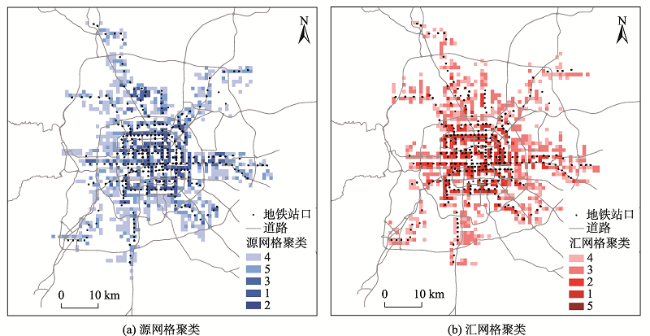
共享单车是解决“最后一公里”出行的有效方法,然而,人们在利用其进行接驳地铁时,常出现无车可用或车辆淤积的现象。因此,探究用于接驳地铁的共享单车的源汇时空分布特征及其影响因素对实现其供需平衡有一定意义,单车运营公司可据此进行更及时、合理的调度。为了解不同区域的共享单车在接驳地铁时使用模式的差异,本文基于不同时间段的客流特征,对用于接驳北京市地铁站的共享单车所产生的源、汇网格进行了K-均值聚类,并进一步利用地理探测器探究了造成这种空间分异的原因。结果表明:① 源、汇网格各被分为5类,分别为高频低流出、高频异常源、中频低流出、低频高流出、低频低流出和高频低流入、中频低流入、低频高流入、低频差异流入、高频异常汇等类型,反映了共享单车源汇的时空分布特征; ② 在不同聚类中,共享单车的日均流量对应的主导因子有所差别,位于市中心的聚类的车辆主要受距离和交通因子的影响,而在其它聚类中则会同时受到多种POI的显著影响,且在不同时段中影响机制不同;③ 对于净流入(出)率而言,各聚类的源、汇网格的主导因子则大致相同,车辆的缺少或过剩主要与距地铁站或市中心的距离有关。④ 从整体源、汇来看,住宅类POI数量与距最近地铁站的距离分别是影响日均流量和净流入(出)率的最强的因子。

高楹 , 宋辞 , 郭思慧 , 裴韬 . 接驳地铁站的共享单车源汇时空特征及其影响因素[J]. 地球信息科学学报, 2021 , 23(1) : 155 -170 . DOI: 10.12082/dqxxkx.2021.200351
Dockless sharing bicycle is an effective transportation tool to solve the "last mile" traveling problem. However, when people use it to connect to the subway, there are usually no bicycles available or too much bicycles accumulated. Therefore, exploring the spatial and temporal distributions of the source and sink of the dockless sharing bicycles used to connect to the subway and analyzing their influencing factors are of certain significance to balance the bicycles’ supply and demand. Also, bicycle operating companies can make more timely and reasonable scheduling based on this. To understand the usage patterns of dockless sharing bicycles connecting to the subway in different regions, this paper used the K- Means clustering algorithm to classify the source and sink grids of the sharing bicycles used to connect to Beijing subway stations based on the passenger flow data at different times, and further used Geo-detector to explore the dominant factors of the spatial pattern. The results show that: (1) the source and sink grids of sharing bicycles were divided into five categories respectively, namely high-frequency low-outflow source, high-frequency abnormal source, medium-frequency low-outflow source, low-frequency high-outflow source, and low-frequency low-outflow source, and high-frequency low-inflow sink, medium-frequency low-inflow sink, low-frequency high-inflow sink, low-frequency differential inflow sink, and high-frequency abnormal sink, which describes the spatial and temporal characteristics of dockless sharing bicycle source and sink; (2) In different clusters, the dominant factors of the daily average flow values of bicycles were different. Bicycle clusters located in the city center were mainly affected by location attributes and traffic attributes, while in other clusters, they were significantly affected by multiple POIs as well. Besides, in different time periods, the influence mechanism of POI was often different; (3) For the rate of net inflows (outflows), the dominant factors of the source and sink grids of each cluster were approximately the same. The lack or surplus of bicycles was mainly related to the distance between the grids and the nearest subway station or the city center. (4) In terms of the overall source and sink rates, the distance between the grids and the nearest subway station, and the amount of residential POI were the most important factors, respectively.
表1 探测因子及其信息描述Tab. 1 Detection factors and information description |
| 因子类别 | 因子名称 | 因子描述 |
|---|---|---|
| 位置属性 | 距最近地铁站的距离 | 网格距最近的地铁站的距离 |
| 距市中心的距离 | 网格距市中心的距离 | |
| 交通特征 | 主要道路 | 网格内主要道路长度 |
| 次要道路 | 网格内次要道路长度 | |
| 支路 | 网格内支路长度 | |
| 地物特征 | 餐饮类POI | 网格内餐馆POI数量 |
| 商业金融类POI | 网格内公司、银行POI数量 | |
| 住宅类POI | 网格内住宅、宾馆POI数量 | |
| 批发零售类POI | 网格内零售商店POI数量 | |
| 公园类POI | 网格内公园POI数量 |
表2 源网格聚类信息Tab. 2 Information of source grid clusters |
| 聚类名称 | 解释 | 网格数/个 | 工作日平均 D值 | 工作日平均 O值 | 周末平均 D值 | 周末平均 O值 | 工作日平均 净流出率 | 周末平均 净流出率 |
|---|---|---|---|---|---|---|---|---|
| 聚类1 | 高频低流出 | 57 | 122.4912 | 169.7439 | 77.7105 | 103.8158 | 0.1613 | 0.1473 |
| 聚类2 | 高频异常源 | 2 | 108.0000 | 306.9000 | 76.0000 | 257.0000 | 0.4681 | 0.5308 |
| 聚类3 | 中频低流出 | 152 | 49.7395 | 82.8132 | 34.5855 | 54.2072 | 0.2433 | 0.2107 |
| 聚类4 | 低频高流出 | 436 | 0.7239 | 9.0087 | 0.4473 | 5.4759 | 0.9252 | 0.6311 |
| 聚类5 | 低频低流出 | 260 | 8.6223 | 14.1738 | 6.0019 | 9.4346 | 0.2393 | 0.3015 |
表3 汇网格聚类信息Tab. 3 Information of sink grid clusters |
| 聚类名称 | 解释 | 网格数/个 | 工作日平均 D值 | 工作日平均 O值 | 周末平均 D值 | 周末平均 O值 | 工作日平均 净流入率 | 周末平均 净流入率 |
|---|---|---|---|---|---|---|---|---|
| 聚类1 | 高频低流入 | 51 | 162.0667 | 109.0118 | 111.5000 | 72.1863 | 0.1950 | 0.2010 |
| 聚类2 | 中频低流入 | 204 | 69.7833 | 43.6539 | 45.1691 | 29.0466 | 0.2226 | 0.2193 |
| 聚类3 | 低频高流入 | 315 | 10.3721 | 1.0838 | 6.5000 | 0.5841 | 0.7965 | 0.9375 |
| 聚类4 | 低频差异流入 | 296 | 6.6987 | 3.5345 | 4.0000 | 2.6436 | 0.5899 | 0.0723 |
| 聚类5 | 高频异常汇 | 1 | 448.2000 | 277.6000 | 347.0000 | 229.0000 | 0.2351 | 0.2049 |
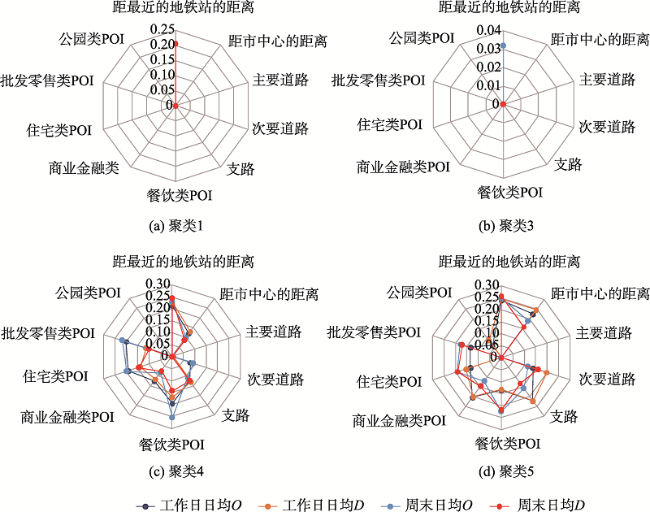
表4 各源网格聚类OD值探测结果Tab. 4 OD value detection results of each source grid cluster |
| 因子 | 聚类1 | 聚类3 | 聚类4 | 聚类5 | |||||||||||||||
|---|---|---|---|---|---|---|---|---|---|---|---|---|---|---|---|---|---|---|---|
| 工作日日均O | 工作日日均D | 周末日均O | 周末日均D | 工作日日均O | 工作日日均D | 周末日均O | 周末日均D | 工作日日均O | 工作日日均D | 周末日均O | 周末日均D | 工作日日均O | 工作日日均D | 周末日均O | 周末日均D | ||||
| 距最近的地铁站的距离 | 0.2019 | 0.1902 | 0.1786 | 0.2043** (1) | 0.1190 | 0.0439 | 0.0319** (1) | 0.0421 | 0.2124** (1) | 0.2272** (1) | 0.2287** (2) | 0.2433** (1) | 0.2386** (1) | 0.2447** (2) | 0.2482** (1) | 0.2574** (1) | |||
| 距市中心的距离 | 0.0738 | 0.1393 | 0.1270 | 0.1145 | 0.1296 | 0.0882 | 0.0843 | 0.0912 | 0.1185** (7) | 0.1289** (5) | 0.0951** (6) | 0.0855* (6) | 0.2249** (2) | 0.2467** (1) | 0.1904** (4) | 0.1584** (6) | |||
| 主要道路 | 0.1654 | 0.1495 | 0.0840 | 0.0469 | 0.0517 | 0.0488 | 0.0785 | 0.0606 | 0.0191 | 0.0475 | 0.0173 | 0.0379 | 0.0631 | 0.1038 | 0.0556 | 0.0628 | |||
| 次要道路 | 0.1560 | 0.2714 | 0.0911 | 0.1678 | 0.1022 | 0.1183 | 0.0992 | 0.0717 | 0.0793* (8) | 0.0063* (8) | 0.0908* (7) | 0.0338 | 0.1394* (5) | 0.1986** (5) | 0.1177+ (8) | 0.1602** (5) | |||
| 支路 | 0.0536 | 0.1210 | 0.1239 | 0.1835 | 0.1451 | 0.2044 | 0.0858 | 0.1499 | 0.1234** (6) | 0.1316** (4) | 0.1085** (5) | 0.1229** (4) | 0.2227** (3) | 0.2230** (3) | 0.1584* (6) | 0.1338* (8) | |||
| 餐饮类POI | 0.2173 | 0.1606 | 0.2088 | 0.0598 | 0.2315 | 0.1969 | 0.1679 | 0.1952 | 0.1960* (3) | 0.1714* (2) | 0.2548* (1) | 0.1425** (3) | 0.1362* (6) | 0.1308* (7) | 0.2246** (2) | 0.2192** (2) | |||
| 商业金融类POI | 0.2505 | 0.2476 | 0.1587 | 0.2596 | 0.1782 | 0.2228 | 0.0689 | 0.1339 | 0.1279** (5) | 0.1188** (6) | 0.0837+ (8) | 0.0743** (7) | 0.2043** (4) | 0.2003** (4) | 0.1200** (7) | 0.1474+ (7) | |||
| 住宅类POI | 0.1381 | 0.1910 | 0.2032 | 0.2219 | 0.1918 | 0.1346 | 0.1745 | 0.1425 | 0.1931** (4) | 0.1401** (3) | 0.2006** (4) | 0.1464** (2) | 0.1366** (5) | 0.1545** (6) | 0.1918** (3) | 0.1917** (3) | |||
| 批发零售类POI | 0.2280 | 0.3152 | 0.2305 | 0.3555 | 0.1210 | 0.1307 | 0.1380 | 0.1525 | 0.2025** (2) | 0.1148** (7) | 0.2191** (3) | 0.1012** (5) | 0.1355* (7) | 0.1121 | 0.1787* (5) | 0.1723* (4) | |||
| 公园类POI | 0.0496 | 0.0673 | 0.1161 | 0.1243 | 0.0356 | 0.0282 | 0.0344 | 0.0378 | 0.0161 | 0.0215 | 0.0270 | 0.0186 | 0.0626+ (8) | 0.0891* (8) | 0.0396 | 0.0441 | |||
注:表中用红色表示的因子为主导因子;+、*、**分别为p <0.1、p <0.05、p <0.01。 |
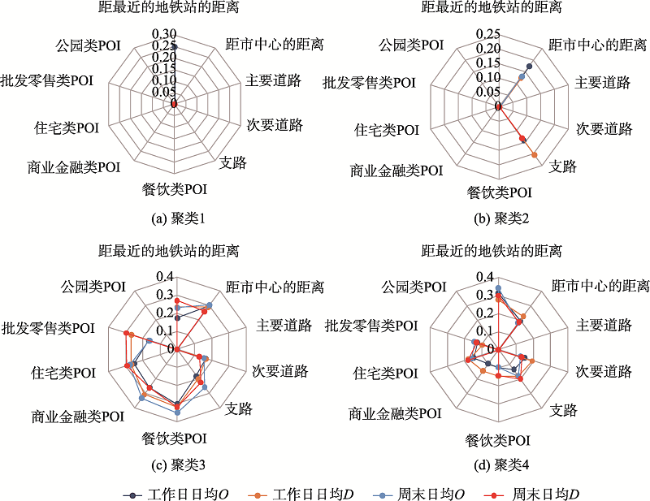
表5 各汇网格聚类OD值探测结果Tab. 5 OD value detection results of each sink grid cluster |
| 因子 | 聚类1 | 聚类2 | 聚类3 | 聚类4 | |||||||||||||||
|---|---|---|---|---|---|---|---|---|---|---|---|---|---|---|---|---|---|---|---|
| 工作日日均O | 工作日日均D | 周末日均O | 周末日均D | 工作日日均O | 工作日日均D | 周末日均O | 周末日均D | 工作日日均O | 工作日日均D | 周末日均O | 周末日均D | 工作日日均O | 工作日日均D | 周末日均O | 周末日均D | ||||
| 距最近的地铁站的距离 | 0.2502** (1) | 0.1941 | 0.0877 | 0.1188 | 0.0414 | 0.0377 | 0.0794 | 0.0399 | 0.1749** (6) | 0.2344** (6) | 0.2308** (6) | 0.2715** (4) | 0.3121** (1) | 0.2774** (1) | 0.3395** (1) | 0.3025** (1) | |||
| 距市中心的距离 | 0.0849 | 0.1433 | 0.0697 | 0.2057 | 0.1766** (1) | 0.1266+ (2) | 0.1315* (1) | 0.0924 | 0.2955** (2) | 0.2921** (3) | 0.3057** (3) | 0.2598** (6) | 0.1993** (2) | 0.2265** (2) | 0.1818** (2) | 0.1859** (3) | |||
| 主要道路 | 0.1629 | 0.1778 | 0.0891 | 0.0622 | 0.0900 | 0.0841 | 0.0488 | 0.0885 | 0.0873 | 0.0611 | 0.0481 | 0.0838 | 0.0770 | 0.0868 | 0.0559 | 0.0478 | |||
| 次要道路 | 0.3326 | 0.2006 | 0.1345 | 0.2490 | 0.0571 | 0.0559 | 0.0510 | 0.0728 | 0.1649** (7) | 0.1679** (8) | 0.1569** (8) | 0.1303* (8) | 0.1491* (3) | 0.1917** (3) | 0.1233* (6) | 0.1326** (6) | |||
| 支路 | 0.2075 | 0.1060 | 0.0781 | 0.1401 | 0.1438* (2) | 0.2055** (1) | 0.0869 | 0.1330+ (1) | 0.1804** (5) | 0.1996** (7) | 0.2596** (5) | 0.2252** (7) | 0.1371* (5) | 0.1805** (4) | 0.1793** (3) | 0.1987** (2) | |||
| 餐饮类POI | 0.3908 | 0.3287 | 0.3731 | 0.1705 | 0.1737 | 0.1668 | 0.1068 | 0.1322 | 0.3004** (1) | 0.3202** (1) | 0.3506** (1) | 0.3181** (1) | 0.0978* (7) | 0.1464** (6) | 0.0968* (7) | 0.1405** (5) | |||
| 商业金融类POI | 0.4020 | 0.5030 | 0.2478 | 0.3133 | 0.2460 | 0.2699 | 0.0894 | 0.1249 | 0.2582** (3) | 0.3073** (2) | 0.3325** (2) | 0.2618** (5) | 0.0971* (8) | 0.1448* (7) | 0.1000 | 0.0749 | |||
| 住宅类POI | 0.2295 | 0.1779 | 0.4324 | 0.1811 | 0.1925 | 0.1439 | 0.1267 | 0.1414 | 0.2496** (4) | 0.2654** (4) | 0.2755** (4) | 0.2914** (3) | 0.1459** (4) | 0.1745** (5) | 0.1599** (4) | 0.1804** (4) | |||
| 批发零售类POI | 0.3313 | 0.4125 | 0.5596 | 0.2352 | 0.1697 | 0.1471 | 0.1895 | 0.1749 | 0.1642** (8) | 0.2640** (5) | 0.1613** (7) | 0.2974** (2) | 0.1268+ (6) | 0.0946* (8) | 0.1410* (5) | 0.1278* (7) | |||
| 公园类POI | 0.0106 | 0.0287 | 0.0665 | 0.1027 | 0.0110 | 0.0242 | 0.0144 | 0.0363 | 0.0350 | 0.0283 | 0.0759 | 0.0269 | 0.0174 | 0.0266 | 0.0335 | 0.0721 | |||
注:表中用红色表示的因子为主导因子;+、*、**分别为p<0.1、p<0.05、p<0.01。 |
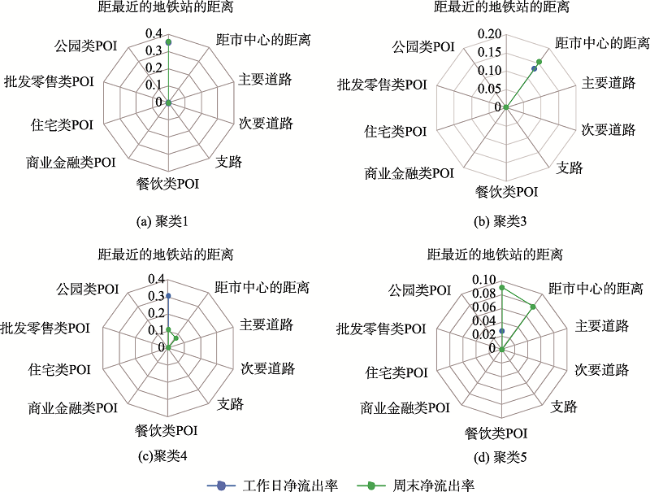
表6 各源网格聚类净流出率值探测结果Tab. 6 Net outflow rate detection results of each source grid cluster |
| 因子 | 聚类1 | 聚类3 | 聚类4 | 聚类5 | ||||
|---|---|---|---|---|---|---|---|---|
| 工作日净流 出率 | 周末净流出率 | 工作日净流 出率 | 周末净流出率 | 工作日净流 出率 | 周末净流出率 | 工作日净流 出率 | 周末净流出率 | |
| 距最近的地铁站的距离 | 0.3545+ (1) | 0.3588+ (1) | 0.0647 | 0.0513 | 0.3036** (1) | 0.1051** (1) | 0.0278** (1) | 0.0908+ (1) |
| 距市中心的 距离 | 0.1753 | 0.2653 | 0.1318+ (1) | 0.1548* (1) | 0.0845 | 0.0744+ (2) | 0.0304 | 0.0772** (2) |
| 主要道路 | 0.0403 | 0.1307 | 0.1091 | 0.1109 | 0.0218 | 0.0398 | 0.0520 | 0.0283 |
| 次要道路 | 0.1272 | 0.1461 | 0.1160 | 0.1157 | 0.0497 | 0.0542 | 0.0669 | 0.0705 |
| 支路 | 0.1044 | 0.1315 | 0.0931 | 0.0900 | 0.0587 | 0.0319 | 0.0309 | 0.0670 |
| 餐饮类POI | 0.2242 | 0.1539 | 0.0880 | 0.0747 | 0.0683 | 0.0458 | 0.0283 | 0.0183 |
| 商业金融类POI | 0.1396 | 0.2672 | 0.0988 | 0.0835 | 0.0655 | 0.0277 | 0.0717 | 0.0584 |
| 住宅类POI | 0.0734 | 0.0939 | 0.0951 | 0.1202 | 0.0443 | 0.0714 | 0.0796 | 0.0420 |
| 批发零售类POI | 0.2799 | 0.1979 | 0.0977 | 0.1173 | 0.0372 | 0.0563 | 0.0706 | 0.0283 |
| 公园类POI | 0.1009 | 0.0623 | 0.0428 | 0.0375 | 0.0137 | 0.0152 | 0.0241 | 0.0262 |
注:表中用红色表示的因子为主导因子;+、*、**分别为p <0.1、p <0.05、p <0.01。 |
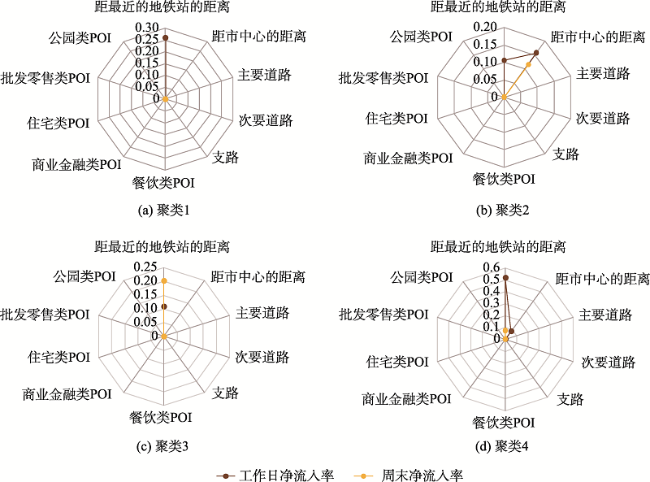
表7 各汇网格聚类净流入率值探测结果Tab. 7 Net inflow rate detection results of each sink grid cluster |
| 因子 | 聚类1 | 聚类2 | 聚类3 | 聚类4 | ||||
|---|---|---|---|---|---|---|---|---|
| 工作日净 流入率 | 周末净 流入率 | 工作日净 流入率 | 周末净流 入率 | 工作日净 流入率 | 周末净 流入率 | 工作日净 流入率 | 周末净 流入率 | |
| 距最近的地铁站的距离 | 0.2594** (1) | 0.2401 | 0.1071** (2) | 0.0835 | 0.1094* (1) | 0.2012** (1) | 0.5174** (1) | 0.0759+ (1) |
| 距市中心的 距离 | 0.3307 | 0.2883 | 0.1555* (1) | 0.1171+ (1) | 0.0277 | 0.1508 | 0.0844+ (2) | 0.0399 |
| 主要道路 | 0.0978 | 0.0695 | 0.0333 | 0.0470 | 0.0286 | 0.0744 | 0.0470 | 0.0566 |
| 次要道路 | 0.2445 | 0.2325 | 0.0715 | 0.0580 | 0.0427 | 0.1014 | 0.0783 | 0.0644 |
| 支路 | 0.1059 | 0.0654 | 0.1163 | 0.0683 | 0.0524 | 0.1599 | 0.0791 | 0.0583 |
| 餐饮类POI | 0.2547 | 0.2749 | 0.0974 | 0.0757 | 0.0085 | 0.1312 | 0.0342 | 0.0332 |
| 商业金融类POI | 0.2550 | 0.2811 | 0.0707 | 0.0295 | 0.0518 | 0.1206 | 0.0494 | 0.0204 |
| 住宅类POI | 0.3553 | 0.2958 | 0.1113 | 0.0340 | 0.0078 | 0.1741 | 0.0526 | 0.0296 |
| 批发零售类POI | 0.1394 | 0.2373 | 0.0860 | 0.0311 | 0.0104 | 0.0890 | 0.0462 | 0.0409 |
| 公园类POI | 0.0775 | 0.0579 | 0.0315 | 0.0357 | 0.0101 | 0.0400 | 0.0121 | 0.0257 |
注:表中用红色表示的因子为主导因子;+、*、**分别为p <0.1、p <0.05、p <0.01。 |
表8 整体源汇网格探测结果Tab. 8 Detection results of overall source and sink grids |
| 因子 | 源 | 汇 | ||||||||||
|---|---|---|---|---|---|---|---|---|---|---|---|---|
| 工作日日均O | 工作日日均D | 周末日均O | 周末日均D | 工作日净 流出率 | 周末净流出率 | 工作日日均O | 工作日日均D | 周末日均O | 周末日均D | 工作日净 流入率 | 周末净流入率 | |
| 距最近的地铁站的距离 | 0.2882** (7) | 0.2679** (7) | 0.3141** (7) | 0.3040** (7) | 0.3791** (1) | 0.1096** (1) | 0.2789** (7) | 0.2736** (7) | 0.3024** (7) | 0.2782** (7) | 0.3748** (1) | 0.1651** (1) |
| 距市中心的 距离 | 0.3839** (4) | 0.3770** (4) | 0.3815** (3) | 0.3674** (4) | 0.1722** (4) | 0.0407** (7) | 0.4665** (2) | 0.4608** (2) | 0.4498** (2) | 0.4260** (2) | 0.2077** (2) | 0.0697** (3) |
| 主要道路 | 0.0253 | 0.0247 | 0.0241 | 0.0253 | 0.0210 | 0.0179 | 0.0234 | 0.0275 | 0.0191 | 0.0189 | 0.0177 | 0.0228 |
| 次要道路 | 0.1641** (8) | 0.1920** (8) | 0.1390** (8) | 0.1642** (8) | 0.1300** (8) | 0.0354** (8) | 0.2098** (8) | 0.2183** (8) | 0.1883** (8) | 0.1804** (8) | 0.1146** (8) | 0.0417** (8) |
| 支路 | 0.3525** (5) | 0.3255** (6) | 0.3422** (5) | 0.3289** (6) | 0.1441** (7) | 0.0467** (3) | 0.3852** (5) | 0.3917** (5) | 0.3494** (5) | 0.3573** (5) | 0.1721** (4) | 0.0619** (4) |
| 餐饮类POI | 0.4503** (2) | 0.4349** (2) | 0.4409** (2) | 0.4412** (2) | 0.1750** (3) | 0.0437** (5) | 0.4261** (3) | 0.4309** (3) | 0.3798** (3) | 0.3784** (3) | 0.1684** (5) | 0.0542** (5) |
| 商业金融类POI | 0.4087** (3) | 0.4030** (3) | 0.3287** (6) | 0.3492** (5) | 0.1603** (5) | 0.0509** (2) | 0.4112** (4) | 0.4154** (4) | 0.3163** (6) | 0.3125** (6) | 0.1638** (6) | 0.0448** (7) |
| 住宅类POI | 0.5267** (1) | 0.4999** (1) | 0.5331** (1) | 0.5175** (1) | 0.1769** (2) | 0.0466** (4) | 0.4860** (1) | 0.4608** (1) | 0.4792** (1) | 0.4513** (1) | 0.1838** (3) | 0.0715** (2) |
| 批发零售类POI | 0.3519** (6) | 0.3439** (5) | 0.3614** (4) | 0.3798** (3) | 0.1514** (6) | 0.0415** (6) | 0.3641** (6) | 0.3815** (6) | 0.3615** (4) | 0.3719** (4) | 0.1523** (7) | 0.0528** (6) |
| 公园类POI | 0.0152 | 0.0164 | 0.0174 | 0.0180 | 0.0361 | 0.0101 | 0.0303+ (9) | 0.0314+ (9) | 0.0315+ (9) | 0.0250 | 0.0294* (9) | 0.0229* (9) |
注:表中用红色表示的因子为主导因子;+、*、**分别为p<0.1、p<0.05、p<0.01。 |
| [1] |
刘亚楠 . 共享单车发展研究分析[J]. 时代金融, 2017(8):251-254.
[
|
| [2] |
|
| [3] |
|
| [4] |
|
| [5] |
罗桑扎西, 甄峰, 尹秋怡 . 城市公共自行车使用与建成环境的关系研究——以南京市桥北片区为例[J]. 地理科学, 2018,38(3):332-341.
[
|
| [6] |
|
| [7] |
|
| [8] |
高楹, 宋辞, 舒华 , 等. 北京市摩拜共享单车源汇时空特征分析及空间调度[J]. 地球信息科学学报, 2018,20(8):1123-1138.
[
|
| [9] |
杨永崇, 柳莹, 李梁 . 利用共享单车大数据的城市骑行热点范围提取[J]. 测绘通报, 2018(8):68-73.
[
|
| [10] |
|
| [11] |
|
| [12] |
高枫, 李少英, 吴志峰 , 等. 广州市主城区共享单车骑行目的地时空特征与影响因素[J]. 地理研究, 2019,38(12):2859-2872.
[
|
| [13] |
马新卫, 季彦婕, 金雨川 , 等. 基于时空地理加权回归的共享单车需求影响因素分析[J]. 吉林大学学报(工学版), 2019.
[
|
| [14] |
|
| [15] |
|
| [16] |
|
| [17] |
|
| [18] |
Yan, Gao, Sun, et al. Spatio-temporal usage patterns of dockless bike-sharing service linking to a metro station: A case study in Shanghai, China[J]. Sustainability, 2020,12(3):851.
|
| [19] |
|
| [20] |
|
| [21] |
北京市人民政府. http://www.beijing.gov.cn/renwen/bjgk/,2020-06-01.
[ The people's government of Beijing municipality. http://www.beijing.gov.cn/renwen/bjgk/, 2020-06-01.]
|
| [22] |
摩拜单车公司. https://mobike.com/cn/, 2017-06-27.
[Mobike company. , 2017-06-27.]
|
| [23] |
北京市历史天气. http://tianqi.2345.com/wea_history/54511.htm,2020-06-01.
[Beijing's historical weather. http://tianqi.2345.com/wea_history/54511.htm, 2020-06-01.]
|
| [24] |
黄萌, 陶迎春, 刘光 , 等. 北京市道路名称分类与方向统计分析[J]. 北京测绘, 2017(2):118-120.
[
|
| [25] |
四维图新公司. http://www.navinfo.com/,2019-02-13.
[ NavInfo Company Limited. http://www.navinfo.com/, 2019-02-13.]
|
| [26] |
|
| [27] |
|
| [28] |
金相郁 . 中国区域划分的层次聚类分析[J]. 城市规划汇刊, 2004(2):23-28.
[
|
| [29] |
|
| [30] |
刘彦随, 杨忍 . 中国县域城镇化的空间特征与形成机理[J]. 地理学报, 2012,67(8):1011-1020.
[
|
| [31] |
杨永侠, 张函, 郭雅萍 , 等. 基于地理探测器的山区作物生产潜力指数修正研究[J]. 农业机械学报, 2019,50(7):267-274.
[
|
| [32] |
|
| [33] |
王劲峰, 徐成东 . 地理探测器:原理与展望[J]. 地理学报, 2017,72(1):116-134.
[
|
/
| 〈 |
|
〉 |