
重庆市新型冠状病毒肺炎流行时空特征及其与人群活动性的关系
|
刘亚溪(1994— ),男,甘肃陇南人,博士生,主要研究方向为时空大数据挖掘。E-mail: liuyx@lreis.ac.cn |
收稿日期: 2020-06-09
修回日期: 2020-07-20
网络出版日期: 2021-04-25
基金资助
国家自然科学基金项目(42041001)
国家自然科学基金项目(41525004)
国家自然科学基金项目(41421001)
版权
Spatial-temporal Characteristics of COVID-19 in Chongqing and Its Relationship with Human Mobility
Received date: 2020-06-09
Revised date: 2020-07-20
Online published: 2021-04-25
Supported by
National Natural Science Foundation of China(42041001)
National Natural Science Foundation of China(41525004)
National Natural Science Foundation of China(41421001)
Copyright
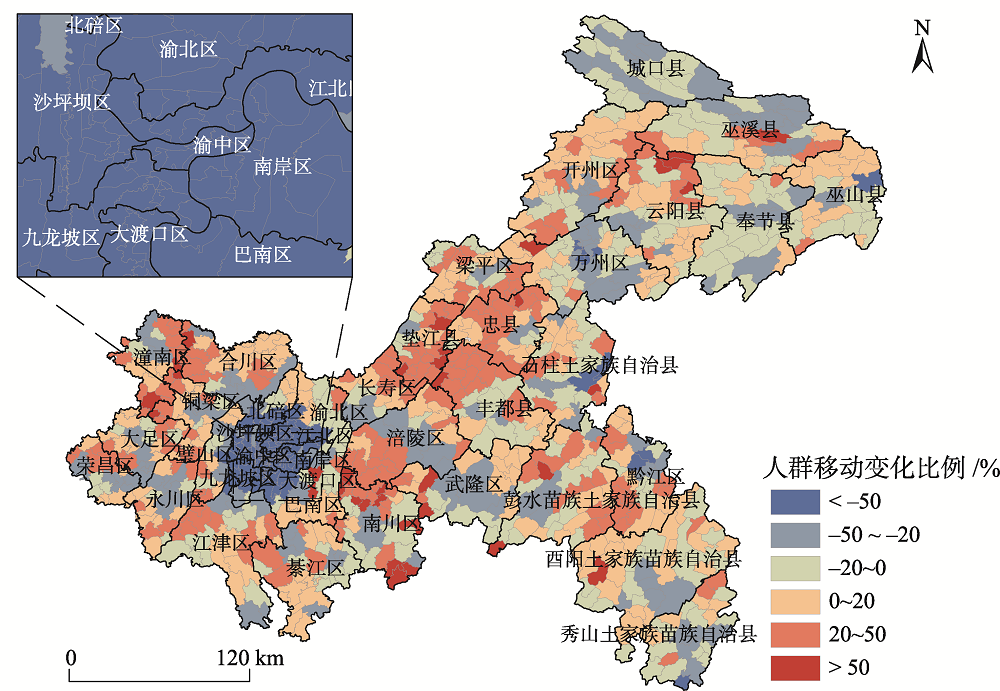
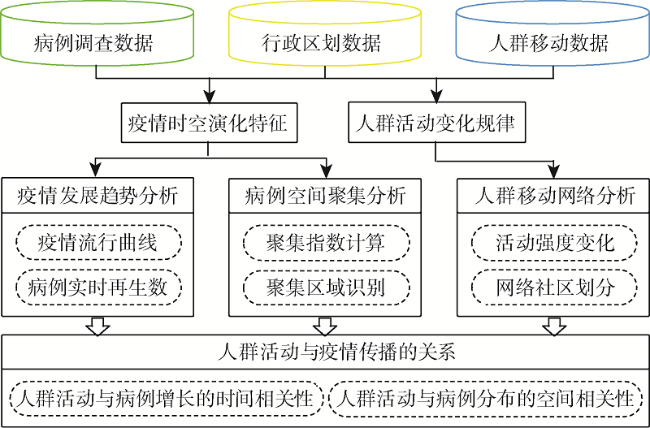
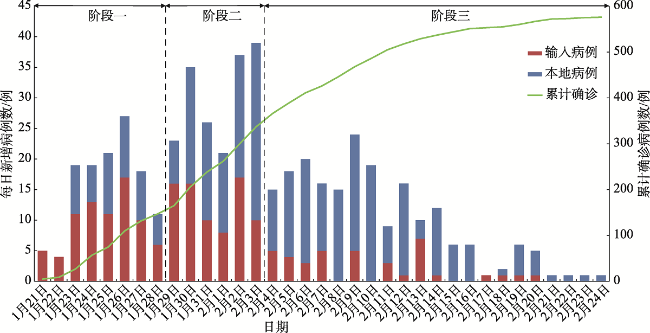
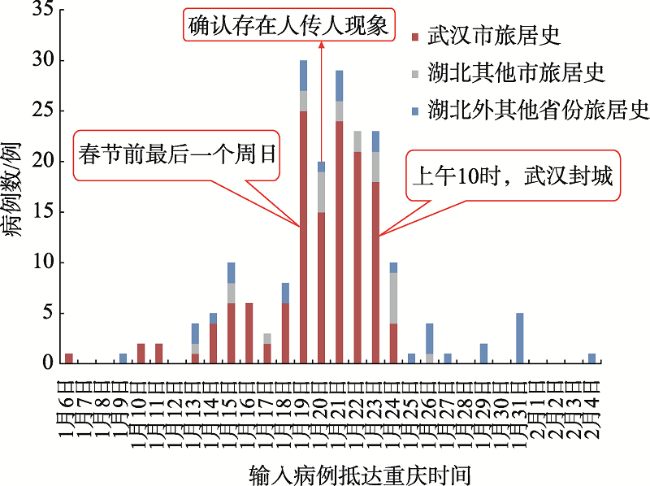
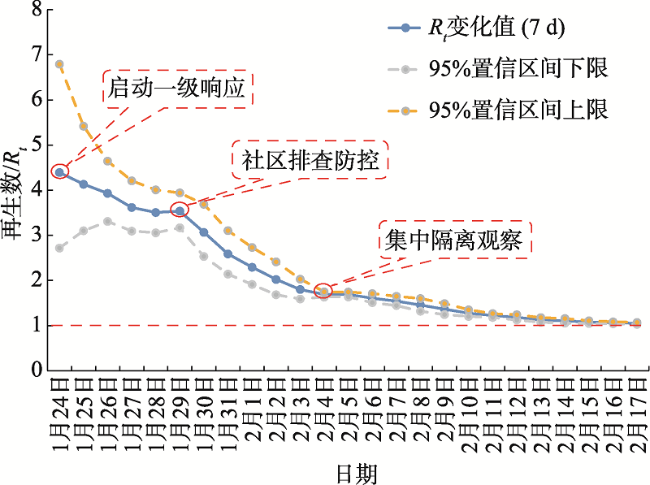
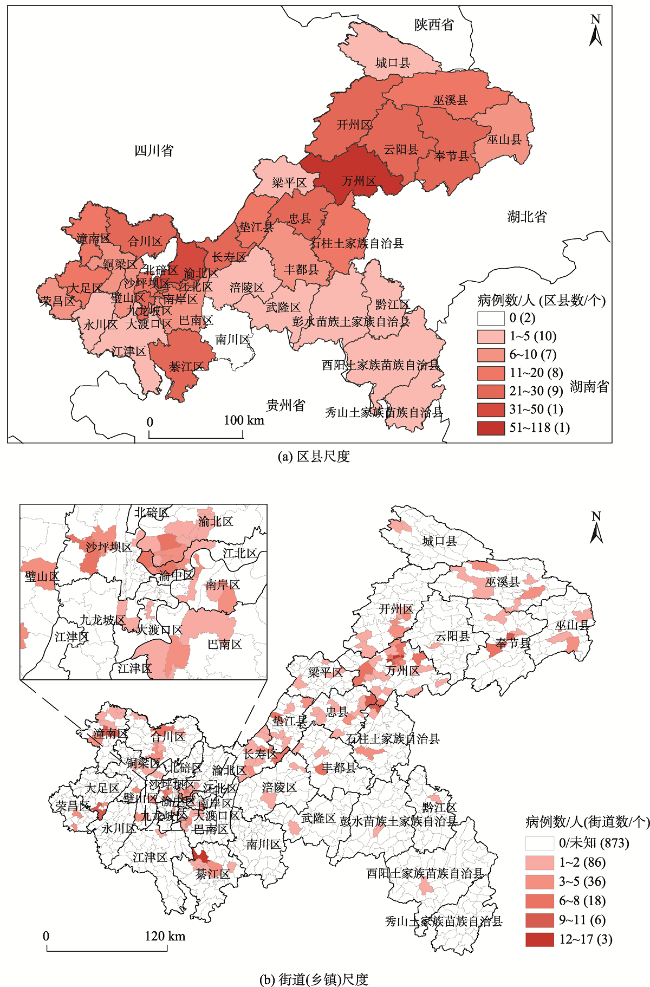
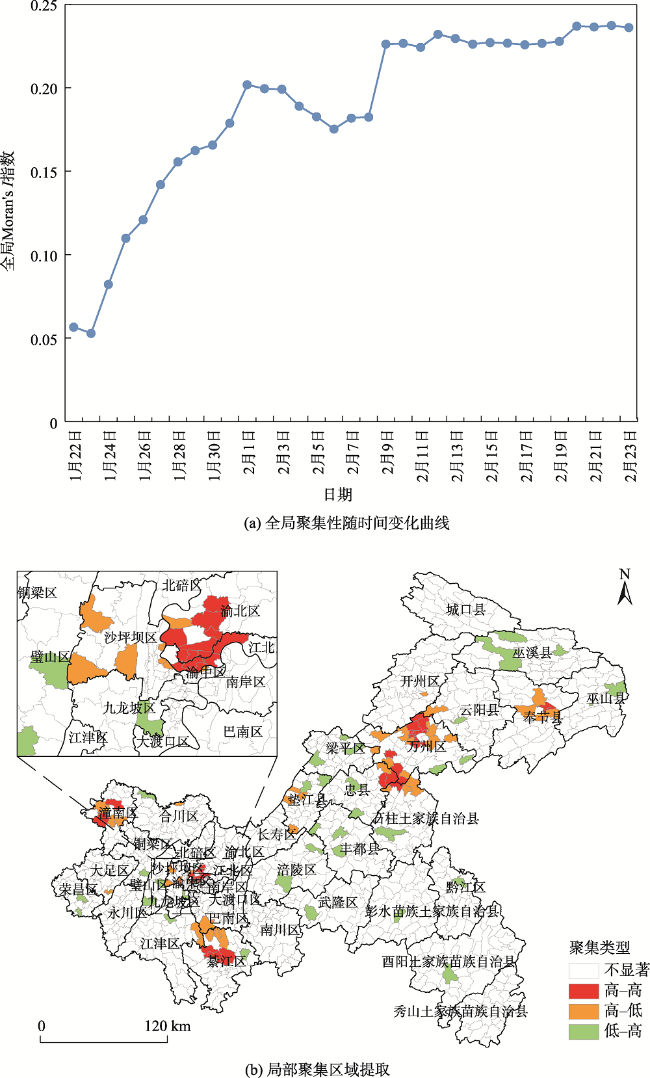
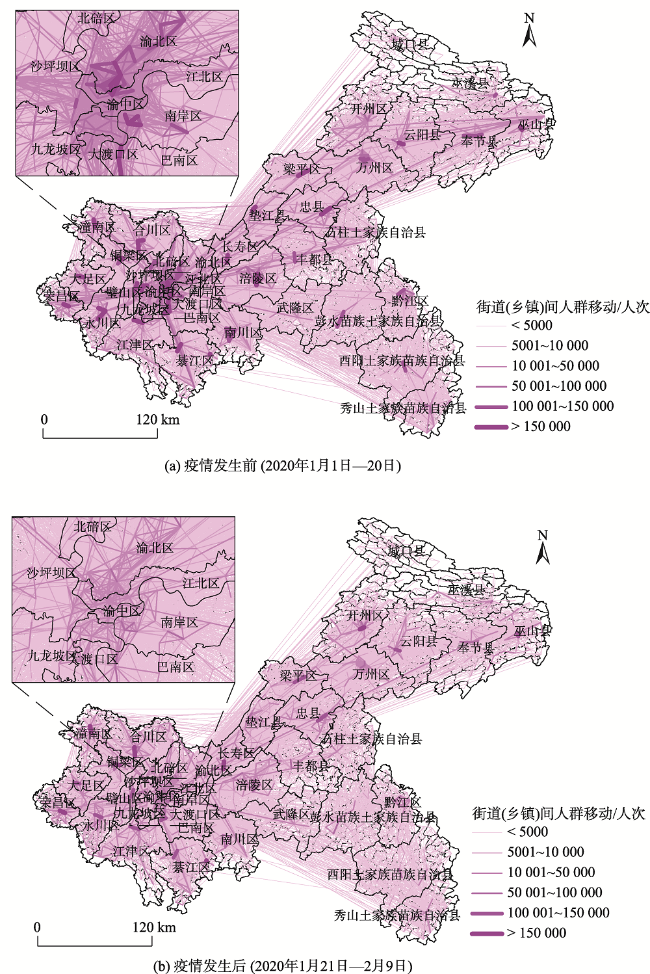
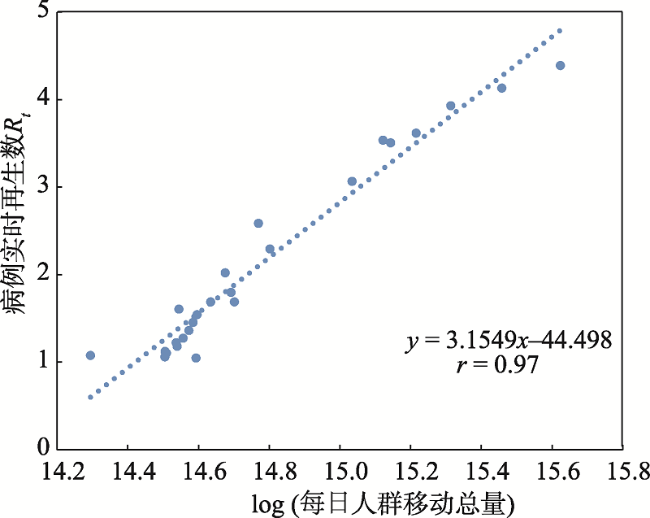
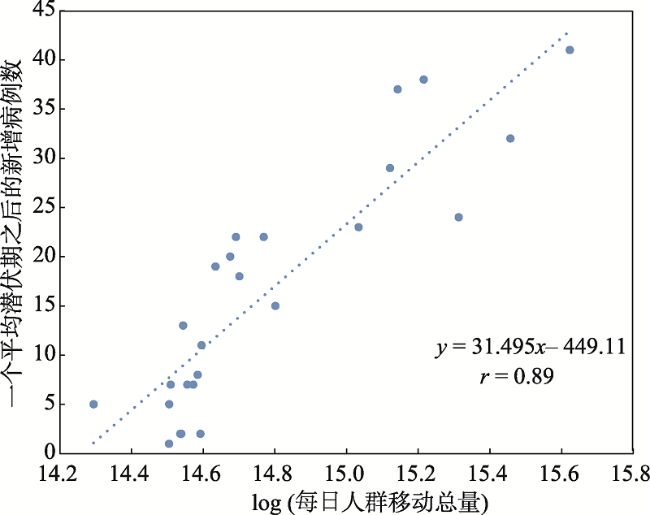
本文收集了重庆市2020年1月21日—2月24日确诊的545例新型冠状病毒肺炎(COVID-19)病例个案信息,结合1500万手机用户在疫情期间的信令轨迹大数据,分析了其疫情的时空演化特征以及人群活动的变化规律,并从复杂网络的角度揭示了疫情分布的异质性,从疫情传播与人群活动之间的关系揭示了异质性的原因。研究发现:① 重庆市疫情在时间上,经历了以输入病例为主、输入和本地病例共存、以本地病例为主3个阶段,病例实时再生数(Rt)初期较高,随着防控措施的实施,逐步减小;空间上,病例分布呈现显著聚集性,病例高聚集区主要分布在以万州区为核心的渝东北地区和以主城区为核心的渝西南地区;② 疫情发生后,重庆市人群移动总量减少为疫情前的53.20%,减少主要集中在主城区以及其他各区县的中心城区,而郊区、农村的人群移动变化不大,甚至有所增加;③ 人群活动与病例发生之间存在不同程度的相关性,具体为:每日人群移动总量与病例实时再生数、一个平均潜伏期(7 d)后的每日新增病例数的相关系数为0.97、0.89,揭示了人群活动与病例增长的时间相关性;各街道(乡镇)人群移动总量与其累计确诊病例数、本地感染病例数之间的相关系数为0.40、0.35,揭示了人群活动与病例空间分布的相关性;病例高聚集区与人群移动网络社区对应,且与网络社区内人群活动较强的区域吻合,揭示了重庆市疫情传播的本地聚集特征。大数据与疫情信息的聚合分析证实,切断人群移动网络社区之间的连接,并遏制疫情高风险社区内部的传播是在城市内部疫情防控的有效措施。
刘亚溪 , 宋辞 , 刘起勇 , 张知新 , 王席 , 马佳 , 陈晓 , 裴韬 . 重庆市新型冠状病毒肺炎流行时空特征及其与人群活动性的关系[J]. 地球信息科学学报, 2021 , 23(2) : 222 -235 . DOI: 10.12082/dqxxkx.2021.200296
Based on the epidemiological investigation data of 545 COVID-19 cases and mobile phone trajectory data of 15 million users during the epidemic ( from 21 January, 2020 to 24 February, 2020 ), this paper analyzed the spatial-temporal characteristics of COVID-19 and the human mobility changes in Chongqing. Furthermore, the correlation relationship between them was explored to explain these characteristics and changes. The results show that: (1) The epidemic pattern in Chongqing can be divided into three stages ( i.e. imported cases stage, imported cases plus local cases stage, and local cases stage ) and the real time reproduction number (Rt) was high at early stage, but declined significantly after prevention and control measures were taken; The spatial distribution of cases presented a significant clustering, and the high clustering areas were mainly distributed in the northeastern and the southwestern of Chongqing; (2) After the epidemic, the total amount of human mobility decreased to 53.20% and the decrease was mainly concentrated in the main urban area, while that of in the suburbs and rural areas did not change, or even increased; (3) The relationship between human mobility and case occurrence lies in two aspects: The correlation coefficient between daily human mobility and Rt, daily increased number of cases after an average incubation period (7 d) were 0.98, 0.87, revealing the time correlation between human mobility and case growth; The correlation coefficient between total amount of human mobility and total number of cases, number of local cases in each street (township) were 0.40, 0.35, revealing the correlation between human mobility and spatial distribution of cases. The cases clustering area corresponds to the network community of human mobility, revealing the local clustering transmission is the major transmission model. By aggregating the big data and the epidemic data, we suggests that cutting off the connection between different human mobility network communities and blocking the local transmission inside the high risk communities is an effective measure for the prevention and control of epidemics in cities.
表1 不同时期内重庆市病例发病-就诊时间间隔及就诊-确诊时间间隔比较Tab. 1 Comparison of case onset-visit interval and visit-confirmation interval during different periods in Chongqing |
| 1月1日—20日 | 1月21日—25日 | 1月26日—31日 | 2月1日—20日 | X 2值 | P值 | |
|---|---|---|---|---|---|---|
| 发病-就诊时间间隔 | 4 (1~6) | 2 (0~4) | 1 (0~4) | 1(0~1) | 21.51 | <0.01 |
| 就诊-确诊时间间隔 | 7 (4~8.25) | 2 (1~4.75) | 2 (1~4) | 1 (1~2) | 46.52 | <0.01 |
注:表中的值为M (P25~P75),其中M为均值,P25和P75分别为25%分位数和75%分位数,单位为天/d。 |
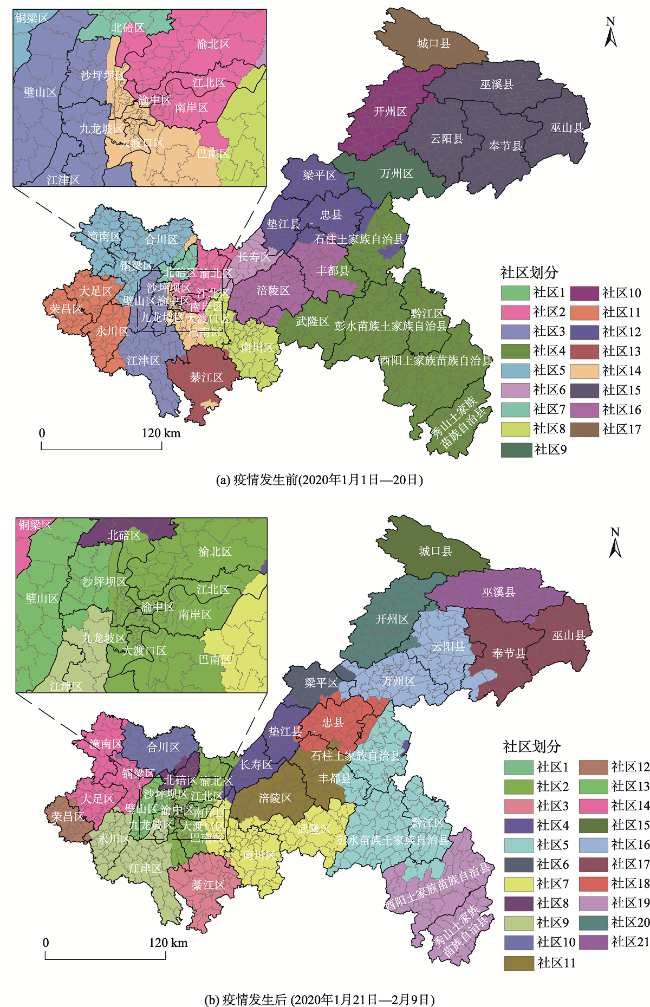
图7 重庆市疫情发生前后街道(乡镇)间人群移动网络对比Fig. 7 Human mobility network in Chongqing before and after the COVID-19 |
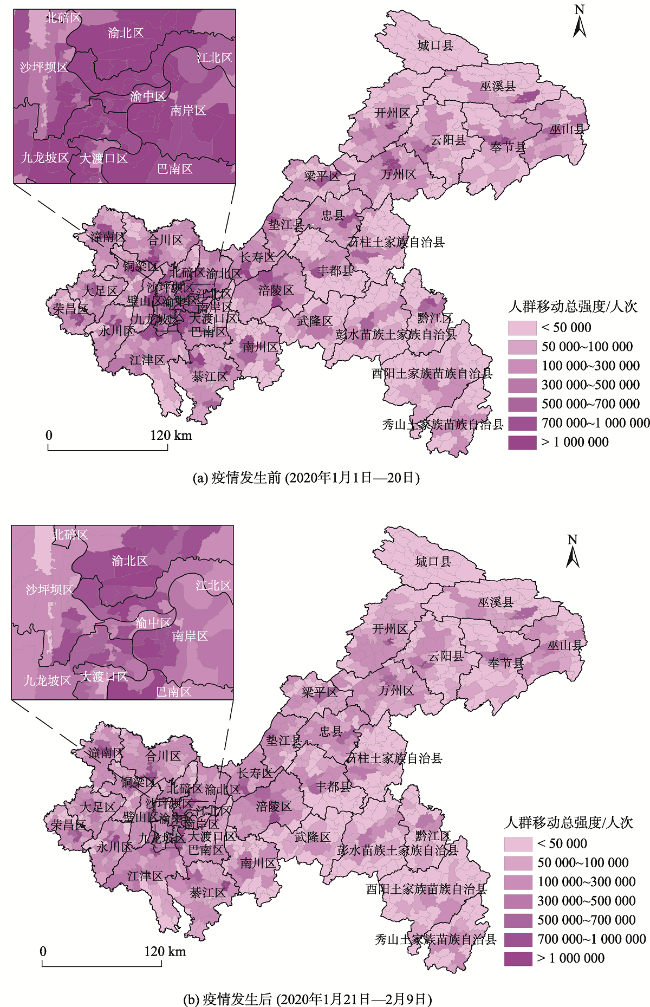
图8 重庆市疫情发生前后各街道(乡镇)人群移动总量对比Fig. 8 Total amount of human mobility of each street (township) in Chongqing before and after the COVID-19 |
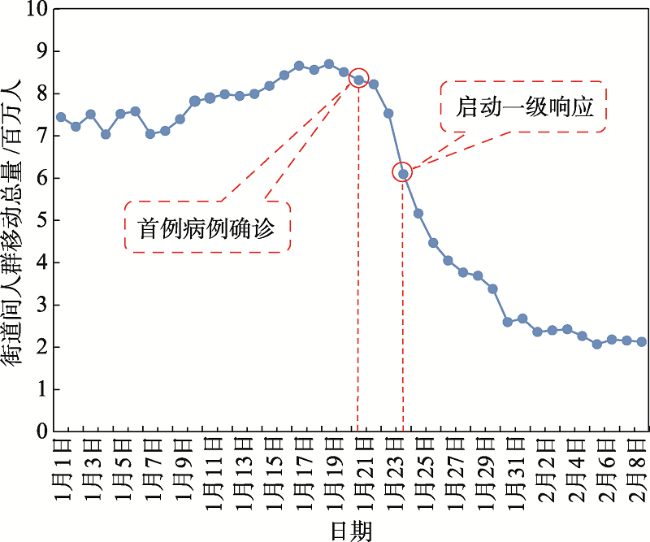
图9 重庆市人群移动总量随时间变化曲线Fig. 9 Temporal change of the total amount of human mobility in Chongqing |
| [1] |
WHO. Coronavirus disease (COVID-19) situation reports[EB/OL].https://www.who.int/docs/default-source/coronaviruse/situation-reports/20200602-covid-19-sitrep-134.pdf?sfvrsn=cc95e5d5_2
|
| [2] |
|
| [3] |
|
| [4] |
|
| [5] |
|
| [6] |
|
| [7] |
|
| [8] |
|
| [9] |
|
| [10] |
|
| [11] |
|
| [12] |
|
| [13] |
王皎贝, 李钢, 王建坡, 等. 陕西省COVID-19疫情时空演化与风险画像[J]. 热带地理, 2020,40(3):432-445.
[
|
| [14] |
刘郑倩, 叶玉瑶, 张虹鸥, 等. 珠海市新型冠状病毒肺炎聚集发生的时空特征及传播路径[J]. 热带地理, 2020,40(3):422-431.
[
|
| [15] |
赵宏波, 魏甲晨, 王爽, 等. 大城市新冠肺炎疫情风险评估与精准防控对策——以郑州市为例[J]. 经济地理, 2020,40(4):103-109,124.
[
|
| [16] |
金安楠, 李钢, 王皎贝, 等. 深圳市新型冠状病毒肺炎(COVID-19)疫情时空演化与防控对策[J]. 陕西师范大学学报(自然科学版), 2020,48(3):18-32.
[
|
| [17] |
刘勇, 杨东阳, 董冠鹏, 等. 河南省新冠肺炎疫情时空扩散特征与人口流动风险评估——基于1243例病例报告的分析[J]. 经济地理, 2020,40(3):24-32.
[
|
| [18] |
冯明翔, 方志祥, 路雄博, 等. 交通分析区尺度上的新型冠状病毒肺炎时空扩散推估方法:以武汉市为例[J]. 武汉大学学报·信息科学版, 2020,45(5):651-657,681.
[
|
| [19] |
|
| [20] |
|
| [21] |
国家卫生健康委办公厅. 新型冠状病毒肺炎防控方案(第六版)[EB/OL]. http://www.nhc.gov.cn/jkj/s3577/202003/4856d5b0458141fa9f376853224d41d7.shtml.
[ General Office of National Health Commission. Prevention and control protocol for COVID-19 (Version 6)[EB/OL]. http://www.nhc.gov.cn/jkj/s3577/202003/4856d5b0458141fa9f376853224d41d7.shtml.]
|
| [22] |
|
/
| 〈 |
|
〉 |
