
中国地级市人为热总量的估算及驱动因素分析
|
蔡一乐(1997- ),男,江苏张家港人,硕士生,主要从事人为热排放格局、过程及机理研究。E-mail: onejoycc@163.com |
收稿日期: 2020-03-02
要求修回日期: 2020-06-12
网络出版日期: 2021-05-25
基金资助
国家自然科学基金项目(41930650)
版权
Estimation and Analysis of Driving Factors of Total AHF in Prefecture-Level of China
Received date: 2020-03-02
Request revised date: 2020-06-12
Online published: 2021-05-25
Supported by
National Natural Science Foundation of China(41930650)
Copyright
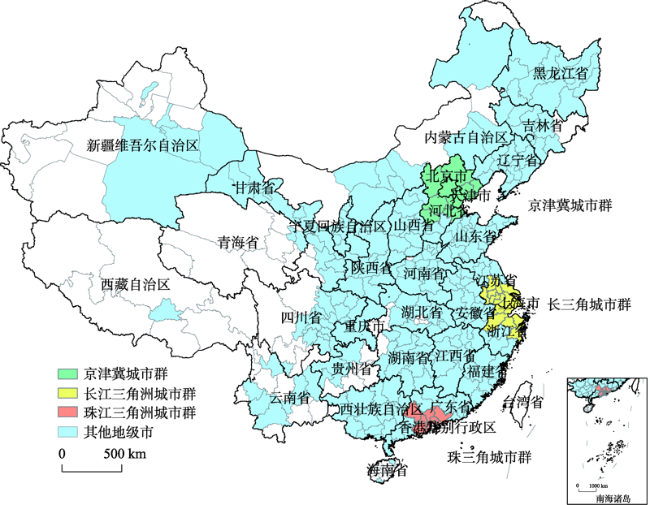
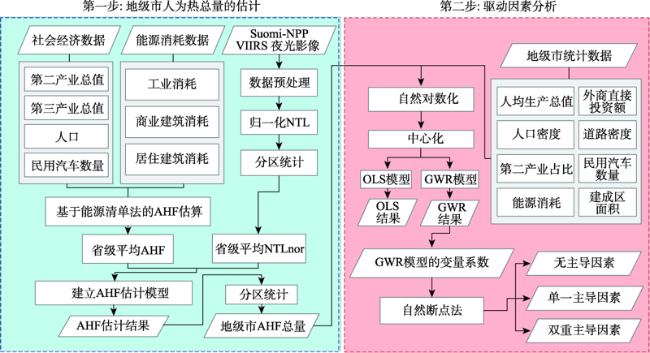
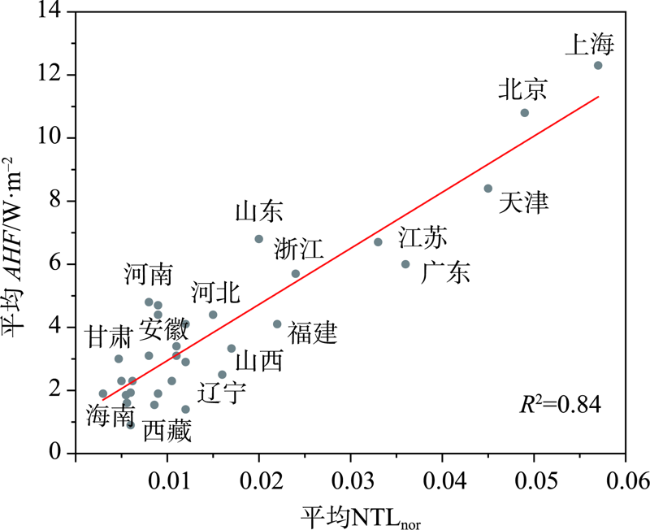
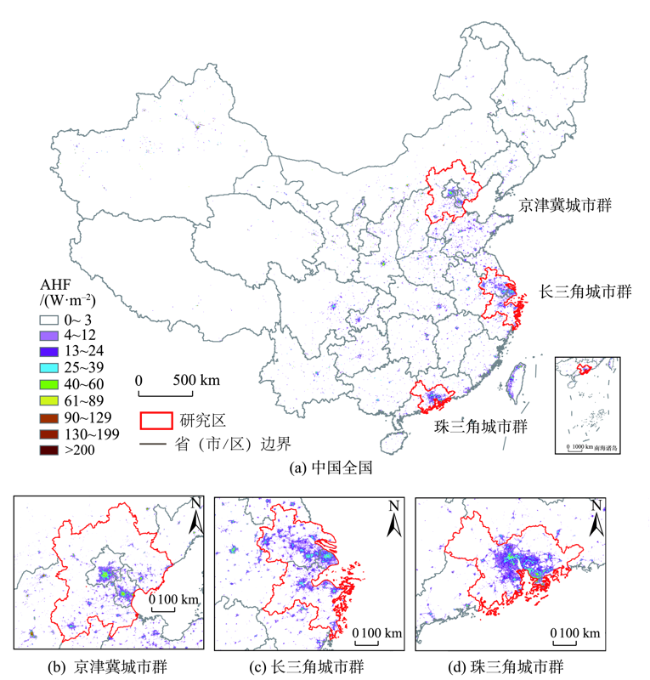
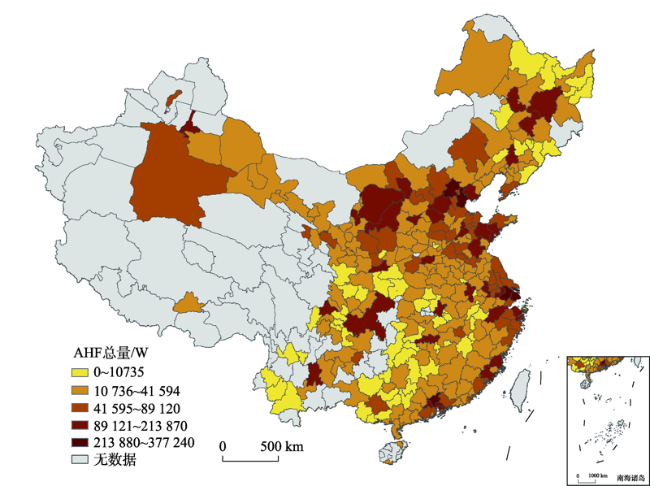
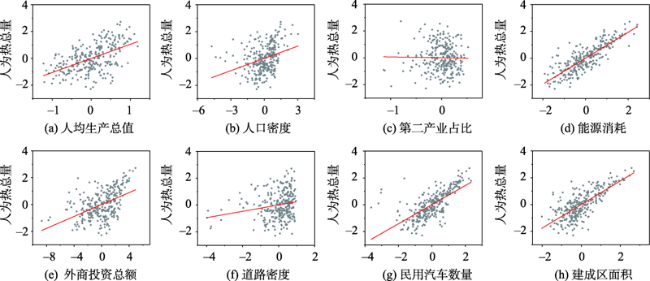
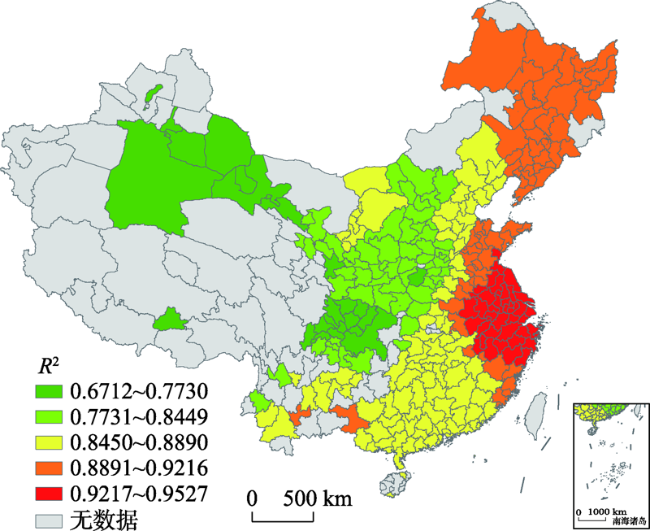
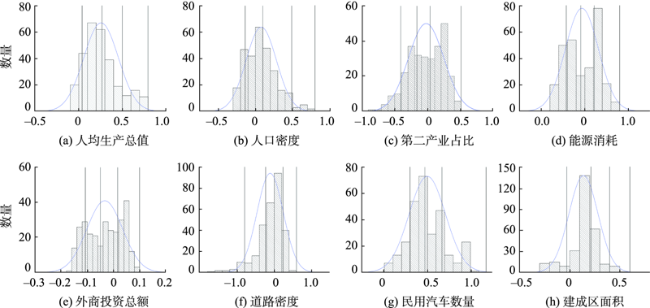
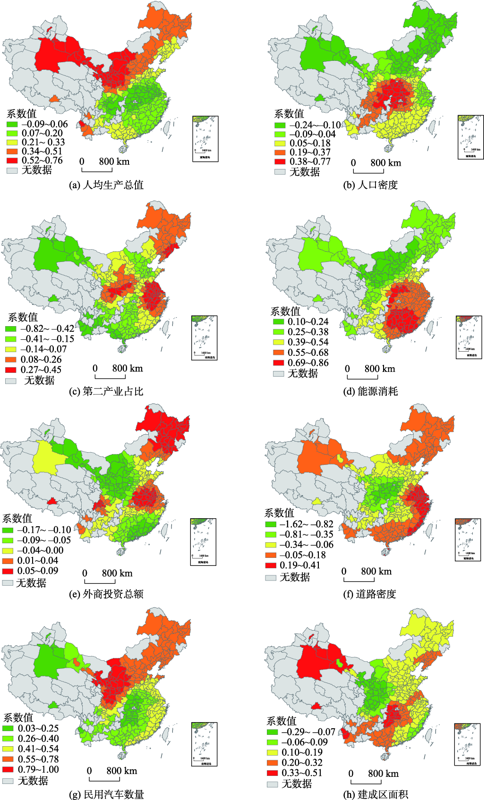
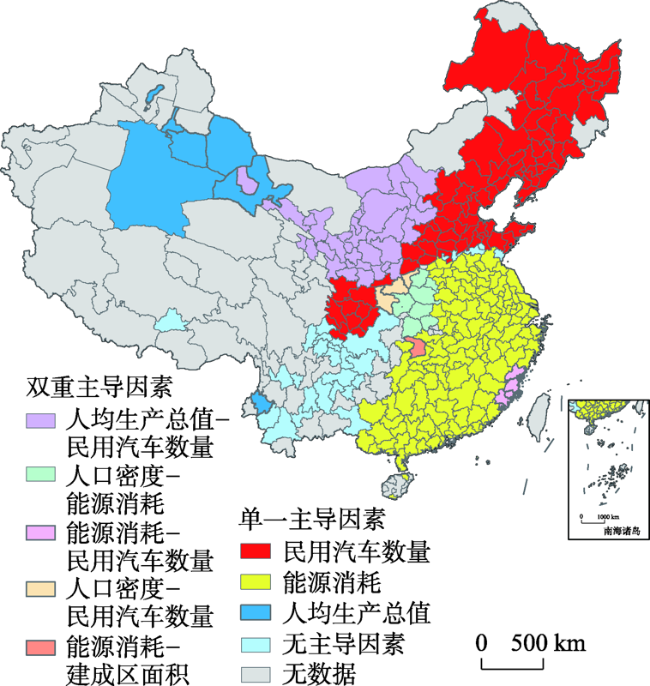
人为热一定程度上影响着城市的局地环境和微气候。以2016年中国地级市为研究对象,首先采用了能源消耗清单法结合Suomi-NPP(National Polar-orbiting Partnership)VIIRS(Visible Infrared Imaging Radiometer Suite)夜间灯光数据的方法估算了格网尺度的人为热通量;其次,分别使用最小二乘法和地理加权回归法模型在全局和局部尺度上研究不同因素对人为热总量的影响;进一步使用自然断点法划分出其中的主导因素。得出以下结论:① 各地级市的人为热总量具有显著的空间差异,京津冀、长江三角洲、珠江三角洲城市群所在的中国东南地区,人为热总量相对较高;② 能源消耗、民用汽车数量、人均生产总值是全局尺度上人为热总量的主要驱动因素;人口密度、第二产业占比、道路密度和建成区面积对人为热总量的影响呈现出较强的空间异质性;外商直接投资额则在全局尺度对人为热总量的影响较低。③ 主导因素分析表明无主导因素的地级市主要位于中国的西南部,以能源消耗、民用汽车数量、人均生产总值为单一主导因素的地级市主要聚集于中国的东南部、中部及东北部、西北部,并在其周边交叉地区形成了一些数量较少的双重主导因素地级市。本文的研究为政府相关部门对于人为热调控政策的制定提供了依据。

蔡一乐 , 曹诗颂 , 杜明义 , 李善飞 , 陈姗姗 . 中国地级市人为热总量的估算及驱动因素分析[J]. 地球信息科学学报, 2021 , 23(3) : 405 -418 . DOI: 10.12082/dqxxkx.2021.200097
Anthropogenic heat emissions significantly affect the sustainable development of cities. So far, studies regarding refined Anthropogenic Heat Flux (AHF) parameterizing have been widely conducted. However, the dominated driving factors of AHF at the prefecture level in China have not been well quantified. In this paper, we estimated the prefecture-level AHF in China and further revealed its driving factors. First, the energy consumption inventory integrated with the nighttime light data from the Suomi-national polar-orbiting partnership visible infrared imaging radiometer suite was adopted to estimate the total AHF for cities in China. Then, various socioeconomic factors of AHF were revealed using ordinary least square and geographically weighted regression models. The dominated factors for each city were identified using a coefficient quartering method which can capture the high value of each coefficient for each city. Results show that: (1) there was an obvious spatial heterogeneity of total AHF among cities, and in particular, the total AHF along the southeast coast of China was higher than those in the other regions; (2) dominated driving factors of total AHF were Energy Consumption (EC), Private car ownership (PV), and Per Capita GDP (PCGDP). In addition, the Population Density (PD), share of Secondary Industries (SI), Road Density (RD), and Urban Expansion (UE) contributed to the spatial variation of AHF across cities. Foreign Direct Investment (FDI) exhibited limited influences on AHFs; and (3) cities can be grouped into three types according to the number of dominated factors, i.e., cities having no dominated, single dominated, and bi-dominated factors. There was a high degree of spatial aggregation of cities in each city type. Cities labeled as no dominated factor were mainly located in southwestern China. Cities labeled as single dominated factor of the EC, PV, or PCGDP concentrated in southeastern, central, northeastern and northwestern China. This study can provide a reference for the government to formulate policies on the emissions of anthropogenic heat.
表1 《中国统计年鉴2017》[23]中290个地级市的数据统计Tab. 1 Statistics of variables of 290 prefecture-level cities in 2017 China statistical yearbook |
| 数据名 | 平均值 | 中位数 | 标准差 | 最小值 | 最大值 |
|---|---|---|---|---|---|
| AHF总量/W | 42 054.04 | 23 349.00 | 51 499.27 | 2528.00 | 378 730.00 |
| 人均生产总值/元 | 68 949.56 | 60 912.50 | 34 483.69 | 17 890.00 | 200 022.00 |
| 人口密度/(人/km2) | 480.80 | 344.52 | 569.18 | 2.71 | 6273.56 |
| 第二产业占比/% | 43.67 | 44.60 | 10.22 | 13.57 | 71.34 |
| 能源消耗/万千瓦时 | 199 5058.48 | 1 232 921.50 | 2 171 124.84 | 197 798.00 | 15 267 700.00 |
| 外商直接投资额/万美元 | 94 437.14 | 24 617.50 | 226 183.58 | 3.00 | 2 432 909.00 |
| 道路密度/% | 109.33 | 106.91 | 54.77 | 1.64 | 230.74 |
| 民用汽车数量/辆 | 762 404.27 | 513 544.00 | 789 434.97 | 13 200.00 | 5 138 074.00 |
| 建成区面积/km2 | 162.08 | 91.00 | 204.34 | 14.00 | 1563.00 |
表3 2016年中国地级市人为热总量与其驱动因素的全局回归分析(OLS模型)Tab. 3 Global regression analysis between total AHF and its driving factors at the prefecture-level in China in 2016 (OLS model) |
| 变量名 | 系数值 | 标准差 | T统计量 | 概率健壮度 | 方差膨胀因子 |
|---|---|---|---|---|---|
| 截距 | -3.547 | 0.895 | -3.963 | 0.000 | |
| 人均生产总值 | 0.249 | 0.078 | 3.177 | 0.005 | 1.835 |
| 人口密度 | -0.125 | 0.047 | -2.683 | 0.012 | 2.920 |
| 第二产业占比 | -0.314 | 0.124 | -2.532 | 0.018 | 1.273 |
| 能源消耗 | 0.627 | 0.059 | 10.706 | 0.000 | 3.008 |
| 外商直接投资额 | -0.052 | 0.020 | -2.624 | 0.038 | 2.176 |
| 道路密度 | -0.054 | 0.051 | -1.066 | 0.237 | 2.053 |
| 民用汽车数量 | 0.247 | 0.054 | 4.581 | 0.000 | 3.187 |
| 建成区面积 | 0.320 | 0.061 | 5.274 | 0.000 | 3.146 |
注:调整后的R2(Adjusted R-Square)为0.759,联合F统计量(Joint F-Statistic)为114.772,P值(P-value)小于0.05。 |
表4 2016年中国地级市人为热总量主导因素类型统计Tab. 4 Statistics of dominated factor types of total AHF at the prefecture-level in China in 2016 |
| 类型 | 变量 | 数量/个 | 占比/% |
|---|---|---|---|
| 无主导因素类型 | 总计 | 28 | 9.66 |
| 单一主导因素类型 | 总计 | 215 | 74.14 |
| 民用汽车数量 | 81 | 37.67 | |
| 能源消耗 | 126 | 58.60 | |
| 人均生产总值 | 8 | 3.72 | |
| 双重主导因素类型 | 总计 | 47 | 16.21 |
| 人均生产总值-民用汽车量 | 31 | 65.96 | |
| 人口密度-能源消耗 | 7 | 14.89 | |
| 能源消耗-民用汽车量 | 5 | 10.64 | |
| 人口密度-民用汽车数 | 3 | 6.38 | |
| 能源消耗-建成区面积 | 1 | 2.13 |
| [1] |
|
| [2] |
王频, 孟庆林. 城市人为热及其影响城市热环境的研究综述[J]. 建筑科学, 2013(8):99-106.
[
|
| [3] |
孙然好, 王业宁, 陈婷婷. 人为热排放对城市热环境的影响研究展望[J]. 生态学报, 2017,37(12):3991-3997.
[
|
| [4] |
|
| [5] |
|
| [6] |
|
| [7] |
李翔, 朱江, 尹向东. 基于夜间灯光数据的中国经济发展时空格局特征[J]. 地球信息科学学报, 2019,21(3):417-426.
[
|
| [8] |
|
| [9] |
|
| [10] |
|
| [11] |
|
| [12] |
|
| [13] |
|
| [14] |
|
| [15] |
|
| [16] |
|
| [17] |
|
| [18] |
|
| [19] |
吴健生, 李博, 黄秀兰. 小城市居民出行行为时空动态及驱动机制研究[J]. 地球信息科学学报, 2017,19(2):176-184.
[
|
| [20] |
|
| [21] |
|
| [22] |
董鹤松, 李仁杰, 李建明, 等. 基于DMSP-OLS与NPP-VIIRS整合数据的中国三大城市群城市空间扩展时空格局[J]. 地球信息科学学报, 2020,22(5):1161-1174.
[
|
| [23] |
国家统计局. 中国统计年鉴2017[M]. 北京: 中国统计出版社, 2018.
[
|
| [24] |
国家统计局. 中国城市统计年鉴2017[J]. 北京: 中国统计出版社, 2017.
[
|
| [25] |
|
| [26] |
|
| [27] |
|
| [28] |
|
| [29] |
|
| [30] |
|
| [31] |
|
| [32] |
|
| [33] |
|
| [34] |
|
| [35] |
|
| [36] |
|
/
| 〈 |
|
〉 |