
SARS与COVID-19时空传播差异性及影响因素分析
|
崔明洁(1997— ),女,河南商丘人,硕士生,研究方向为区域发展。E-mail: cuimingjie19@mails.ucas.ac.cn |
收稿日期: 2021-03-16
要求修回日期: 2021-05-25
网络出版日期: 2021-09-07
基金资助
国家重点研发计划项目(2017YFB0503604)
国家自然科学基金项目(41525004)
国家自然科学基金项目(42041001)
版权
Spatial and Temporal Transmission Differences between SARS and COVID-19 and Analysis of Influence Factors
Received date: 2021-03-16
Request revised date: 2021-05-25
Online published: 2021-09-07
Supported by
National Key R&D Program of China, No(2017YFB0503604)
National Natural Science Foundation of China, No(41525004)
National Natural Science Foundation of China, No(42041001)
Copyright
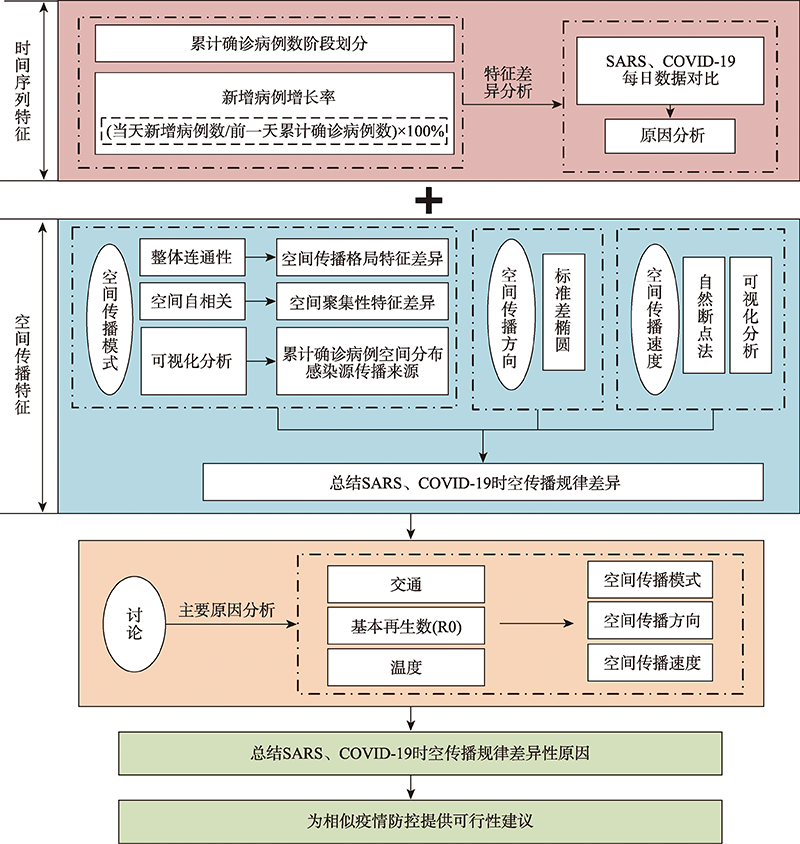
SARS和COVID-19的暴发对我国公众健康、社会经济等造成了严重影响,为揭示呼吸道烈性传染病的时空传播的共性规律和差异特征及背后原因,运用时空统计方法,系统分析并对比了SARS与COVID-19的时空传播差异性特征,并结合病毒本身传播特性及交通、温度等因子进行原因分析。研究表明:① 时间序列上,SARS从发病初始到结束经历了2个阶段,即上升期-平缓期,COVID-19经历了3个阶段,即上升期-急剧上升期-缓升期。② 空间传播模式上,COVID-19传播强度及传播范围大于SARS,且COVID-19的整体连通性较大,各省份与病毒暴发地的联系更为紧密;SARS和COVID-19的传播都存在明显的空间聚集性特征;二者均以邻近传播、远距离飞跃式为主,且SARS存在中次级传播中心,COVID-19扩散中心未发生转移。③ 空间传播方向上,SARS以北京市、香港特别行政区、广东省为中心,空间传播方向性更强,COVID-19仅以湖北省为中心向外扩散。④ 空间传播速度上,SARS各省份首例病例传播时间跨度较大,COVID-19各个省份首例病例传播时间大致以胡焕庸线为分界线,呈现出“东快西慢”的现象,传播时间跨度较短。⑤ R0是造成SARS和COVID-19空间传播范围与空间传播速度差异的主要原因;SARS和COVID-19病毒温度适宜性有所差异,但在温度接近的区域均发生了空间聚集性传播和邻近区域传播;除病毒本身传播能力、温度影响外,交通是影响SARS和COVID-19空间远距离飞跃式传播的主要原因,二者空间传播速度均与路网密度呈负相关关系。
崔明洁 , 姚霞 , 方昊然 , 张杨成思 , 杨德刚 , 裴韬 . SARS与COVID-19时空传播差异性及影响因素分析[J]. 地球信息科学学报, 2021 , 23(11) : 1910 -1923 . DOI: 10.12082/dqxxkx.2021.210133
The outbreaks of SARS and COVID-19 have had a serious impact on public health, social economy and so on in China, in order to reveal the common law and difference characteristics of space-time transmission of respiratory infectious diseases and the reasons behind them, using space-time statistical methods, systematically analyzed and compared the difference characteristics of space-time transmission between SARS and COVID-19, and combined with the transmission characteristics of the virus itself and temperature, traffic and other factors to analyze the causes. The study shows that, ① SARS experiences two stages, the rising period-flat phase, and the COVID-19 experiences three stages, the rising period-sharp rise-slow up period. ② In the mode of spatial transmission, the transmission intensity and range of COVID-19 is greater than that of SARS, and the overall connectivity of COVID-19 is greater and the provinces are more closely related to the outbreak of the virus. Both SARS and COVID-19 transmission have obvious spatial aggregation characteristics. They are based on proximity propagation and long-range leaps, and SARS has a secondary communication center, and COVID-19 diffusion center has not been relocated. ③ In the direction of space communication, SARS is centered in Beijing, Hong Kong and Guangdong, the direction of spatial communication is stronger, and COVID-19 is only spread outwards with Hubei as the center. ④ In terms of spatial transmission speed, the spread time of the first case in each province of SARS is relatively large, and the spread time of the first case in each province of COVID-19 is roughly divided by Hu Huanyong Line, showing a phenomenon of "fast in the east and slow in the west", and the spread time span is relatively short. ⑤ R0 is the main reason for the difference between the spatial transmission range of SARS and COVID-19 and the speed of spatial transmission. The temperature suitability of SARS and COVID-19 viruses is different, but spatial aggregation transmission and adjacent area transmission are occurring in areas with similar temperatures. Besides the virus transmission capacity and temperature impact, traffic is the main reason affecting SARS and COVID-19 space long-range leap transmission, and the spatial transmission speed of both is negatively related to the density of the road network.
表1 SARS和COVID-19空间自相关结果Tab. 1 Spatial self-correlation results of SARS and COVID-19 |
| Moran's I | p-value | z-value | E | V | |
|---|---|---|---|---|---|
| SARS | 0.2122 | 0.0167 | 2.3934 | -0.0303 | 0.0103 |
| COVID-19 | 0.2141 | 0.0330 | 2.1311 | -0.0303 | 0.0131 |
表2 SARS和COVID-19时空传播特征对比Tab. 2 Comparison of space-time propagation characteristics between SARS and COVID-19 |
| 时间序列特征 | 空间传播特征 | ||||||
|---|---|---|---|---|---|---|---|
| 累计确诊病例数 | 新增病例增长率 | 空间传播模式 | 空间传播方向 | 空间传播速度 | |||
| 传播中心 | 传播范围 | 各省份首例病例传播 | |||||
| SARS | 上升期-平稳期 | 1月最高 | 广东—香港—北京 | 除新疆等7个地区,整体连通性较低 | 航空网占主导 | 有次级传播中心形成,方向显著 | 历时165 d |
| COVID-19 | 上升期-急剧上升期-缓升期 | 3月最高 | 湖北 | 全国,整体连通性较高 | 高铁网占主导 | 无次级传播中心,方向不显著 | 历时52 d |
表3 2003年和2019交通情况对比Tab. 3 Traffic conditions comparison in 2003 and 2019 |
| 年份 | 客运量总计 /亿人 | 铁路客运量 /亿人 | 民航客运量 /亿人 | 铁路里程数 /万km | 铁路路网密度 /(km/km2) | 航线里程 /万km | ||
|---|---|---|---|---|---|---|---|---|
| 普铁 | 高铁 | 普铁 | 高铁 | |||||
| 2003 | 158.75 | 9.73 | - | 0.88 | 0.88 | - | 0.0076 | 174.95 |
| 2019 | 176.04 | 13.02 | 23.58 | 6.12 | 2.58 | 3.54 | 0.0145 | 948.22 |
表4 SARS和COVID-19 Spearman相关性分析结果Tab. 4 Spearman correlation analysis results of SARS and COVID-19 |
| Ρ | 单尾检验的显著水平 | 显著性程度 | |
|---|---|---|---|
| SARS | -0.48 | 0.05 | 中等程度负相关 |
| COVID-19 | -0.31 | 0.05 | 中等程度负相关 |
表5 SARS和COVID-19疫情主要流行区月均温温度Tab. 5 Average monthly temperature in the main epidemic areas of SARS and COVID-19 |
| COVID-19疫情流行区 | 月均温/℃ | SARS疫情流行区 | 月均温/℃ | |
|---|---|---|---|---|
| 湖北武汉 | 4(1月) | 8(2月) | 广东广州 | 14.3(2月) |
| 河南信阳 | 4(1月) | 8(2月) | 北京 | 13.6(4月) |
| 湖南长沙 | 3(1月) | 10(2月) | 山西太原 | 11.7(4月) |
| 安徽合肥 | 3(1月) | 8(2月) | 香港 | 15.9(2月) |
| [1] |
|
| [2] |
李鹏. 新冠病毒和SARS病毒是什么关系?[N]. 北京科技报, 2020-02-17(5).
[
|
| [3] |
武继磊, 王劲峰, 孟斌, 等. 2003年北京市SARS疫情空间相关性分析[J]. 浙江大学学报(农业与生命科学版), 2005, 31(1):97-101.
[
|
| [4] |
叶沿林, 庞丹阳, 刘循序. SARS疫情分析及对北京疫情走势的预测[J]. 物理, 2003(5):345-347.
[
|
| [5] |
胡碧松, 龚建华, 周洁萍, 等. 疾病传播输入输出流的时空特征分析—以北京SARS流行为例[J]. 中国科学:地球科学, 2013, 43(9):1499-1517.
[
|
| [6] |
|
| [7] |
石耀霖. SARS传染扩散的动力学随机模型[J]. 科学通报, 2003(13):1373-1377.
[
|
| [8] |
刘玉, 牛树海, 刘毅. 中国SARS的时空分布特征[J]. 科学新闻, 2003(9):4-5.
[
|
| [9] |
|
| [10] |
曹志冬, 曾大军, 郑晓龙, 等. 北京市SARS流行的特征与时空传播规律[J]. 中国科学:地球科学, 2010, 40(6):776-788.
[
|
| [11] |
王聪, 严洁, 王旭, 等. 新型冠状病毒肺炎早期时空传播特征分析[J]. 物理学报, 2020, 69(8):249-258.
[
|
| [12] |
张原, 尤翀, 蔡振豪, 等. 新冠肺炎(COVID-19)新型随机传播动力学模型及应用[J]. 应用数学学报, 2020, 43(2):440-451.
[
|
| [13] |
李栋, 白瑞瑞. 新型冠状病毒传播仿真组合模型[J]. 统计与决策, 2020, 36(5):5-10.
[
|
| [14] |
|
| [15] |
邵俊杰, 禹世雄, 高婧婧, 等. 基于SEIR模型的中国山东省与韩国COVID-19疫情早期传播特征比较分析[J]. 华中师范大学学报(自然科学版), 2020, 54(6):1072-1077.
[
|
| [16] |
|
| [17] |
|
| [18] |
|
| [19] |
|
| [20] |
|
| [21] |
周成虎, 裴韬, 杜云艳, 等. 新冠肺炎疫情大数据分析与区域防控政策建议[J]. 中国科学院院刊, 2020, 35(2):200-203.
[
|
| [22] |
|
| [23] |
|
| [24] |
|
| [25] |
|
| [26] |
范新生, 应龙根. 中国SARS疫情的探索性空间数据分析[J]. 地球科学进展, 2005(3):282-291.
[
|
| [27] |
王定明, 冯子建, 杨维中, 等. 中国24省、市、自治区SARS首发临床确诊病例分析[J]. 中华流行病学杂志, 2004, 25(1):37-38.
[
|
| [28] |
中国网[EB/OL]. http://www.sars.china.com.cn.
[China network[EB/OL]. http://www.sars.china.com.cn.
|
| [29] |
世界卫生组织[EB/OL].https://www.who.int/csr/sars/en/.
[Word health organization[EB/OL]. https://www.who.int/csr/sars/en/.]
|
| [30] |
天气网[EB/OL]. https://m.tianqi.com/lishi/.
[Weather network[EB/OL]. https://m.tianqi.com/lishi/.]
|
| [31] |
国家统计局. 中国统计年鉴2004[M]. 北京: 中国统计出版社, 2004.
[National Bureau of Statistics. China statistical yearbook 2004[M]. Beijing: China Statistical Press, 2004.]
|
| [32] |
国家统计局. 中国统计年鉴2020[M]. 北京: 中国统计出版社, 2020.
[National Bureau of Statistics. China statistical yearbook 2020[M]. Beijing: China Statistical Press, 2020. ]
|
| [33] |
OpenStreetMap[EB/OL]. https://www.openstreetmap.org/.
|
| [34] |
|
| [35] |
|
| [36] |
|
| [37] |
|
| [38] |
王劲峰, 廖一兰, 刘鑫. 空间数据分析教程(第二版)[M]. 北京: 科学出版社, 2019.
[
|
| [39] |
沈中健, 曾坚. 闽南三市城镇发展与地表温度的空间关系[J]. 地理学报, 2021, 76(3):566-583.
[
|
| [40] |
李颉, 郑步云, 王劲峰. 2008—2018年中国手足口病时空分异特征[J]. 地球信息科学学报, 2021, 23(3):419-430.
[
|
| [41] |
|
| [42] |
|
| [43] |
|
| [44] |
陈嘉敏, 邱增钊, 钟舒怡, 等. 基于系统综述的新型冠状病毒肺炎与2009年H1N1流感大流行基本传染数研究[J]. 疾病监测, 2020, 35(12):1088-1099.
[
|
| [45] |
|
| [46] |
汪海英, 荣峰, 柯孚久, 等. 严重急性呼吸综合征(SARS)的传播与控制动力学[J]. 科学通报, 2003(18):1933-1935.
[
|
| [47] |
|
| [48] |
|
| [49] |
金凤君, 陈卓. 1978年改革开放以来中国交通地理格局演变与规律[J]. 地理学报, 2019, 74(10):1941-1961.
[
|
| [50] |
王姣娥, 杜德林, 魏冶, 等. 新冠肺炎疫情的空间扩散过程与模式研究[J]. 地理研究, 2020, 39(7):1450-1462.
[
|
| [51] |
万里阳, 万千. 高铁网络与流行病跨城传播——来自COVID-19疫情防控的经验分析[J]. 产业经济评论, 2020(2):37-48.
[
|
| [52] |
张旭, 霍爱梅, 姚晓丽, 等. 空间分析技术在研究传染病时空传播规律中的应用[J]. 测绘与空间地理信息, 2015, 38(7):79-81.
[
|
| [53] |
卓家同, 郑志刚, 耿文奎. SARS病原、宿主及传播途径研究进展[J]. 应用预防医学, 2008(3):187-189.
[
|
| [54] |
|
| [55] |
张亦汉, 刘婉华, 许晓聪, 等. 中国大陆机场的空间分布及其可达性分析[J]. 中山大学学报(自然科学版), 2019, 58(6):56-63.
[
|
| [56] |
王正行, 张建玮, 唐毅南. 北京SARS疫情走势的模型分析与预测[J]. 物理, 2003(5):341-344.
[
|
| [57] |
王铮, 蔡砥, 李山, 等. 中国SARS流行的季节性风险探讨[J]. 地理研究, 2003(5):541-550.
[
|
| [58] |
俞顺章, 谈建国, 穆丽娜. 影响SARS爆发和流行的气象因素浅析[J]. 上海预防医学杂志, 2003, 15(12):600-601.
[
|
| [59] |
|
/
| 〈 |
|
〉 |


