
2015—2020年辽东湾海冰冰情时空特征及其影响因素
|
赵泉华(1978— ),女,河北承德人,教授,主要从事遥感影像专题信息提取及应用研究。E-mail: zqhlby@163.com |
收稿日期: 2020-04-25
要求修回日期: 2021-06-27
网络出版日期: 2021-09-07
基金资助
辽宁省教育厅科学技术研究一般项目(LR2019JL001)
版权
Temporal and Spatial Characteristics of Sea Ice Condition and Its Influencing Factors in Liaodong Bay from 2015 to 2020
Received date: 2020-04-25
Request revised date: 2021-06-27
Online published: 2021-09-07
Copyright
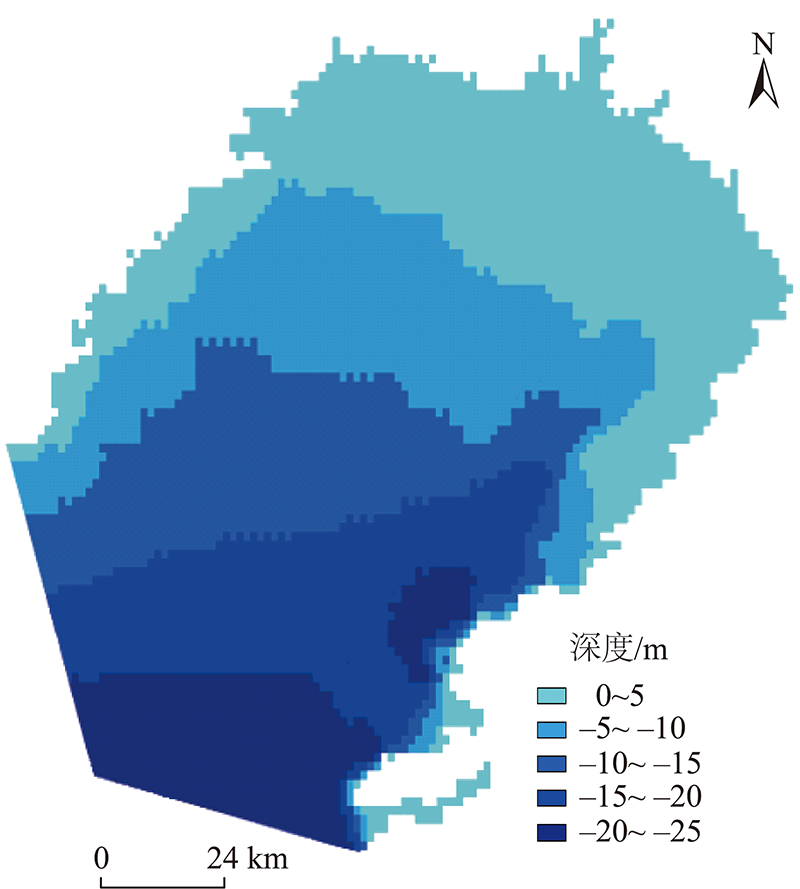
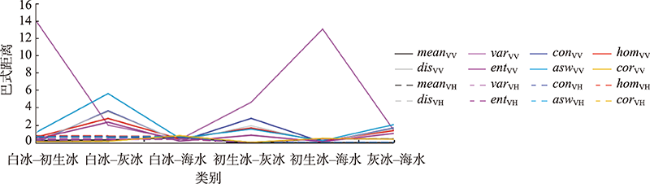
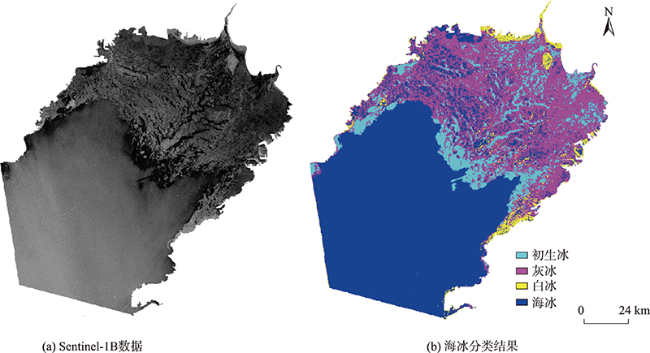
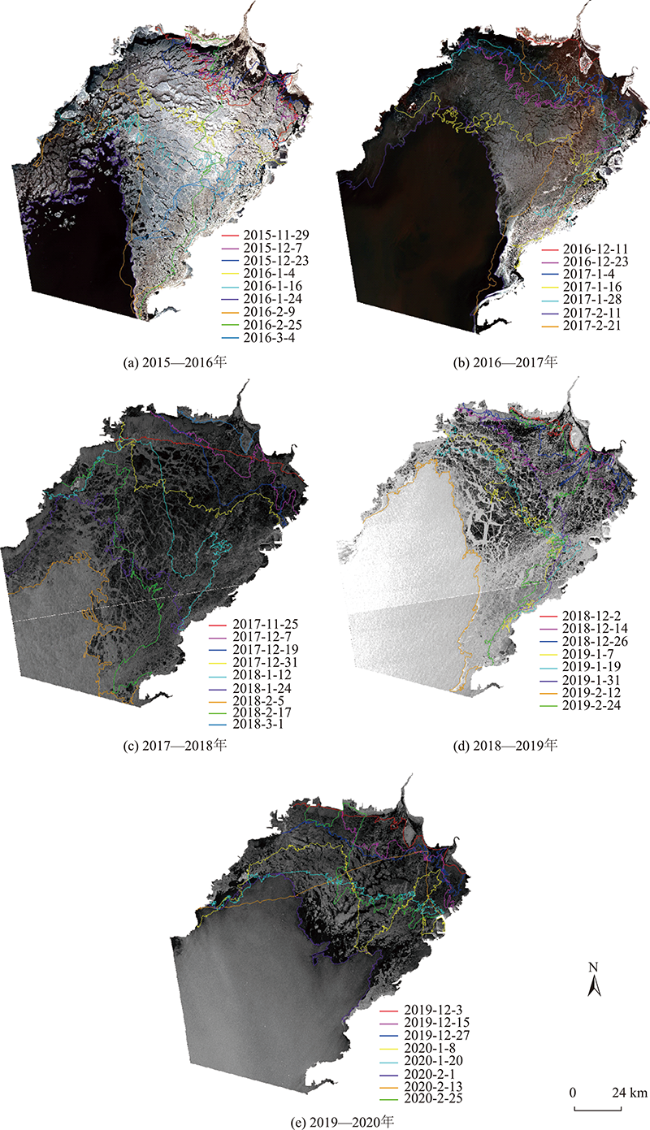
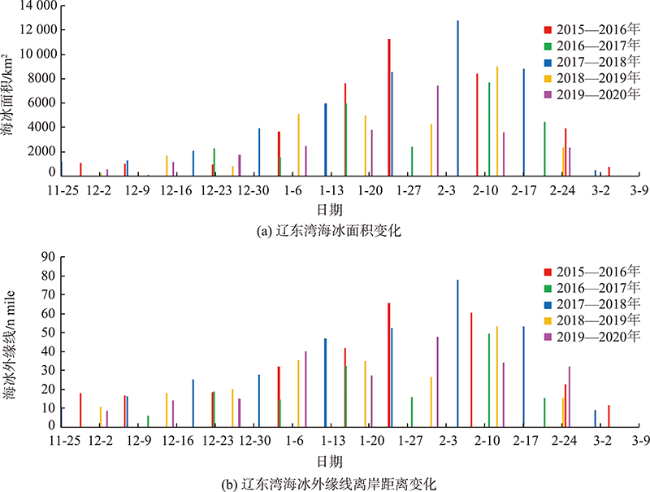
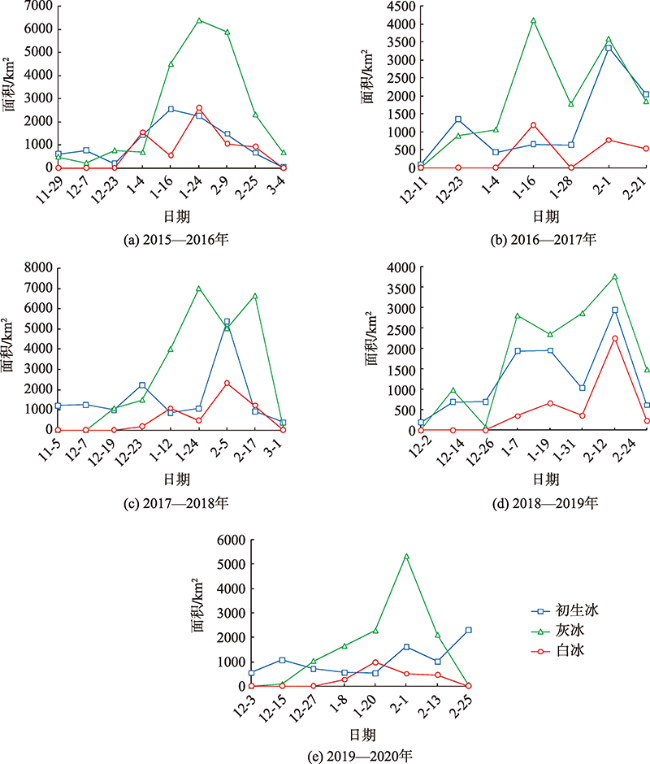
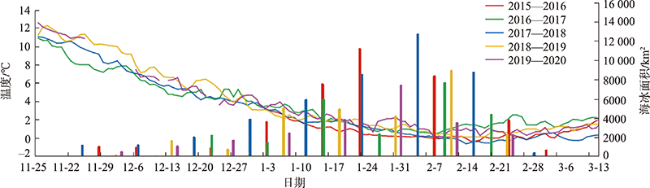
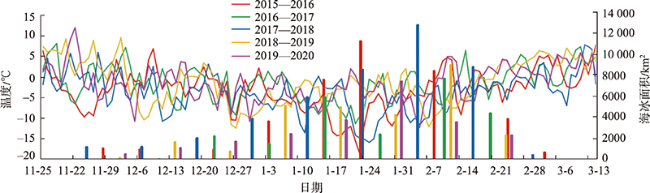
受冬季强寒潮侵袭,辽东湾会出现大范围结冰现象。为了分析2015—2020年辽东湾海冰冰情的变化规律与影响因素,本文选取Sentinel-1A/B数据开展辽东湾海冰监测。首先,采用巴氏距离选择最优纹理特征组合,再利用最大似然方法实现海冰分类;然后,根据上述海冰分类结果,分析海冰冰情等级、海冰外缘线、海冰面积、海冰类型和海冰结冰概率等冰情特征的变化规律;最后,研究海水深度、海温、气温和风速与海冰冰情的关系。主要结论如下:① 采用不同纹理特征组合方法和本文方法对2020年2月1日Sentinel-1B影像进行实验,结果表明本文方法的总体分类精度和Kappa系数分别为93.16%和0.85,分类精度最高。② 11月末到12月海冰类型以初生冰为主,间有灰冰;1月到2月中上旬以灰冰为主,间有初生冰和白冰;2月下旬到3月上旬的海冰类型以灰冰和初生冰为主。辽东湾内部结冰概率存在差异,北部沿岸结冰概率高于南部,东部结冰概率高于西部。辽东湾海冰冰情受海水深度、海温和气温影响明显,受风速影响较小。
赵泉华 , 王肖 , 王雪峰 , 李玉 . 2015—2020年辽东湾海冰冰情时空特征及其影响因素[J]. 地球信息科学学报, 2021 , 23(11) : 2025 -2041 . DOI: 10.12082/dqxxkx.2021.210225
Under the attack of strong cold wave in winter, a large-scale freezing phenomenon appears in Liaodong Bay. In order to analyze the change rules of sea ice condition and the environmental influencing factors in Liaodong Bay from 2015 to 2020, Sentinel-1A/B data are selected to carry out sea ice monitoring in Liaodong Bay. First, the Gray Level Co-occurrence Matrix is used to count the texture features. Then the optimal feature combination is selected based on the Bhattacharyya Distance, and the Maximum Likelihood method is adopted to classify sea ice. Then, according to the classification results of sea ice, the sea ice condition levels of Liaodong Bay in recent 5 years are determined. The change rules of ice condition characters such as the outer edge of sea ice, area, type, and freezing probability are analyzed. Finally, the influence of sea water depth on sea ice condition is discussed, the relationship between sea ice condition and sea temperature, air temperature, and wind speed is studied through correlation analysis. The main conclusions are as follows. Firstly, the Sentinel-1B image on February 1, 2020 is tested using the proposed method and different texture feature combination methods. The results show that the overall classification accuracy and Kappa coefficient of the proposed method are 93.16% and 0.85, respectively, which is the highest classification accuracy among all methods. The overall classification accuracy and Kappa coefficient of all images from 2015 to 2020 are above 85% and 0.80, respectively, which meet the accuracy requirements for sea ice monitoring. Secondly, in last November and December, the sea ice types are mainly primary ice, with gray ice in between. Gray ice is the main ice in January and early February, with primary and white ice in between. Gray and primary ice is dominant in late February and early March. There are differences in the sea ice freezing probability in Liaodong Bay. The sea ice freezing probability in the north coast is higher than that in the south, and the probability in the east is higher than that in the west. Sea depth in Liaodong Bay has different effects on sea ice development in different ranges of [-10, 0], [-20, -10], and [-30, -20]. The Pearson correlation coefficients of sea ice condition with sea temperature, air temperature, and wind speed in Liaodong Bay are -0.55 (P<0.01)、-0.59 (P<0.01)、and -0.22 (P=0.19), indicating that the sea ice condition is negatively correlated with sea temperature and air temperature, and has a low correlation with wind speed.
表1 Sentinel-1A/B和Landsat-8数据参数Tab. 1 The parameters of Sentinel-1A/B and Landsat-8 images |
| 卫星传感器 | 时段 | 获取日期 | 轨道号 | 成像模式 | 分辨率/m | 极化方式/波段 | |
|---|---|---|---|---|---|---|---|
| Sentinel-1A | 2015—2016 | 2015-11-29 | 2015-12-23 | 3-458 | IW | 10×10 | VV/VH |
| 2016-01-04 | 2016-01-16 | ||||||
| 2016-03-04 | |||||||
| Sentinel-1B | 2016—2017 | 2016-12-11 | 2016-12-23 | 3-455、 3-460 | IW | 10×10 | VV/VH |
| 2017-01-04 | 2017-01-16 | ||||||
| 2017-01-28 | 2017-02-21 | ||||||
| Sentinel-1A | 2017—2018 | 2017-11-25 | 2017-12-07 | 98-124、 98-129 | IW | 10×10 | VV/VH |
| 2017-12-19 | 2017-12-31 | ||||||
| 2018-01-12 | 2018-01-24 | ||||||
| 2018-02-05 | 2018-02-17 | ||||||
| 2018-03-01 | |||||||
| Sentinel-1A | 2018—2019 | 2018-12-02 | 2018-12-14 | 98-124、 98-129 | IW | 10×10 | VV/VH |
| 2018-12-26 | 2019-01-07 | ||||||
| 2019-01-19 | 2019-01-31 | ||||||
| 2019-02-12 | 2019-02-24 | ||||||
| Sentinel-1B | 2019—2020 | 2019-12-03 | 2019-12-15 | 98-127 | IW | 10×10 | VV/VH |
| 2019-12-27 | 2020-01-08 | ||||||
| 2020-01-20 | 2020-02-01 | ||||||
| 2020-02-13 | 2020-02-25 | ||||||
| Landsat-8 | 2015—2016 | 2015-12-07 | 2016-01-24 | 120-32 | - | 30×30 | 1-5, 7 |
| 2016-02-09 | 2016-02-25 | ||||||
| Landsat-8 | 2016—2017 | 2017-02-11 | 120-32 | - | 30×30 | 1-5, 7 | |
表2 灰度共生矩阵纹理特征统计量表Tab. 2 Statistics of texture characters of GLCM |
| 特征统计量 | 表达式 | 变量说明 | 物理含义 | 编号 |
|---|---|---|---|---|
| meanVV | M、N分别表示灰度共生矩阵的行列数 | 该区域内的平均亮度的情况 | (4) | |
| varVV | 和 分别像素i的VV和VH后向散射系数 | 该区域内灰度值的波动情况 | (5) | |
| conVV | VH后向散射系数;θ为2个像素连线向量的角度 | 像素灰度值的分布情况和局部变化情况 | (6) | |
| homVV | d为2个像素的距离; | 图像中纹理的同质性,可用于衡量纹理的局部变化情况 | (7) | |
| disVV | 表示灰度为从 的像元出发,统计与其灰度为 、距离为d的像元对出现的概率 | 设定大小窗口内像素灰度值分布的不规则程度 | (8) | |
| entVV | 同上 | 图像的信息量 | (9) | |
| aswVV | 同上 | 图像像素灰度值分布的均匀程度和纹理的粗细程度 | (10) | |
| corVV | 同上 | 图像的局部相关性和纹理的细致程度 | (11) |
注:表中仅列出了VV极化的上述8个特征,类似的,可以计算VH极化对应的8个特征,因此,VV和VH极化下共对应16个特征。 |
表3 2020年2月1日Sentinel-1B数据分类结果评价Tab. 3 Evaluation of Sentinel-1B data classification results on Ferbruary 1, 2020 |
| 不同特征组合编号 | 特征组合 | 总体分类精度/% | Kappa系数 |
|---|---|---|---|
| 1 | varVV, aswVV, corVV, conVV | 90.47 | 0.82 |
| 2 | varVV, aswVV, corVV, disVV | 88.26 | 0.79 |
| 3 | 所有特征 | 84.75 | 0.77 |
| 本文方法 | varVV, aswVV, corVV | 93.16 | 0.85 |
表4 海冰冰情等级标准Tab. 4 Standard for sea ice levels |
| 冰级 | 1级 | 2级 | 3级 | 4级 | 5级 |
|---|---|---|---|---|---|
| 最大海冰外缘线/n mile | <45 | 45~60 | 61~80 | 81~110 | >110 |
表5 辽东湾冰情等级Tab. 5 Sea ice condition level in Liaodong Bay |
| 时段 | 初冰日 | 终冰日 | 冰期/d | 最大海冰外缘线/n mile | 冰情 |
|---|---|---|---|---|---|
| 2015—2016 | 11-23 | 3-12 | 111 | 65.55 | 常冰年(3级) |
| 2016—2017 | 11-22 | 3-30 | 102 | 49.35 | 偏轻冰年(2级) |
| 2017—2018 | 11-25 | 3-14 | 110 | 77.50 | 常冰年(3级) |
| 2018—2019 | 12-2 | 3-70 | 96 | 53.13 | 偏轻冰年(2级) |
| 2019—2020 | 12-3 | 2-27 | 87 | 47.46 | 偏轻冰年(2级) |
Tab. 6 The comparison table between the basic sea ice condition information calculated in this paper and Bulletin of China Marine Disaster |
| 年度 | 海冰面积最大日 | 最大海冰面积/km2 | 海冰外缘线最大日 | 最大海冰外缘线/n mile | |||||||
|---|---|---|---|---|---|---|---|---|---|---|---|
| 本文 | 《中国海洋灾害公报》 | 本文 | 《中国海洋灾害公报》 | 本文 | 《中国海洋灾害公报》 | 本文 | 《中国海洋灾害公报》 | ||||
| 2015—2016 | 2016-01-24 | 2016-02-01 | 11 212.80 | 21 594.00 | 2016-01-24 | 2016-02-01 | 65.55 | 79.00 | |||
| 2016—2017 | 2017-02-11 | 2017-01-24 | 7682.56 | 10 515.00 | 2017-02-11 | 2017-01-24 | 49.35 | 49.00 | |||
| 2017—2018 | 2018-02-05 | 2018-02-06 | 12 738.70 | 18 041.00 | 2018-02-05 | 2018-01-28 | 77.50 | 74.00 | |||
| 2018—2019 | 2019-02-12 | 2019-02-13 | 8958.80 | 12 058.00 | 2019-02-12 | 2019-02-14 | 53.13 | 52.00 | |||
| 2019—2020 | 2020-02-01 | 2020-02-06 | 7428.120 | 9165.00 | 2020-02-01 | 2020-02-06 | 47.46 | 45.00 | |||
表7 辽东湾海冰冰情与环境因素的相关系数Tab. 7 Correlation coefficient between sea ice and influencing factors in Liaodong Bay |
| 海温 | 气温 | 风速 | |
|---|---|---|---|
| 相关系数 | -0.55 | -0.59 | -0.22 |
| [1] |
焦艳, 黄菲, 高松, 等. 基于长短时记忆神经网络的辽东湾海冰延伸期预报方法研究[J]. 中国海洋大学学报(自然科学版), 2020, 50(6):1-11.
[
|
| [2] |
颜钰, 徐粒, 许映军, 等. 基于MODIS的渤海海冰资源量估算[J]. 资源科学, 2017, 39(11):2166-2175.
[
|
| [3] |
刘眉洁, 戴永寿, 张杰, 等. 高分辨率全极化合成孔径雷达数据海冰二次分类方法研究[J]. 海洋学报(中文版), 2013, 35(4):80-87.
[
|
| [4] |
邹斌, 林明森, 石立坚, 等. 遥感技术在海洋灾害监测中的应用[J]. 城市与减灾, 2018(6):61-65.
[
|
| [5] |
郑小莉, 杨晓梅, 刘兴权. 卫星遥感影像对海洋监测能力的评估分析——以渤海海区为例[J]. 地球信息科学学报, 2009, 11(6):860-866.
[
|
| [6] |
王志勇, 王丽华, 刘健, 等. 基于多源中高分辨率遥感数据提取渤海辽东湾海冰要素信息[J]. 自然灾害学报, 2021, 30(1):174-182.
[
|
| [7] |
郭衍游, 谢宏全, 杨光. 基于MODIS影像渤海2012年海冰变化分析[J]. 海洋科学, 2014, 38(6):60-64.
[
|
| [8] |
张树德, 兰志刚. 基于卫星遥感图像的辽东湾海冰参数反演及空间分布特征分析[J]. 中国海上油气, 2019, 31(4):147-153.
[
|
| [9] |
|
| [10] |
崔艳荣, 邹斌, 韩震, 等. 卷积神经网络在SAR遥感海冰分类中的应用可行性分析[J]. 海洋预报, 2019, 36(5):77-85.
[
|
| [11] |
|
| [12] |
赵泉华, 郭世波, 李晓丽, 等. 利用目标分解特征的全极化SAR海冰分类[J]. 测绘学报, 2018, 47(12):1609-1620.
[
|
| [13] |
|
| [14] |
|
| [15] |
刘成, 车达升, 李晓东. 黄渤海海冰分布特征及其影响因子[J]. 资源科学, 2019, 41(6):1167-1175.
[
|
| [16] |
郭东琳, 赵鹏, 王彬, 等. 基于卫星观测的辽东湾冰情统计分析[J]. 海洋与湖沼, 2019, 50(1):31-40.
[
|
| [17] |
王焕松, 雷坤, 李子成, 等. 辽东湾海域水体富营养化的模糊综合评价[J]. 环境科学研究, 2010, 23(4):413-419.
[
|
| [18] |
GB/T 14914.2-2019,海洋观测规范第2部分:海滨观测B/T 14914.2-2019,海洋观测规范第2部分:海滨观测[S]. 北京:国家市场监督管理总局;中国国家标准化管理委员会, 2019.
[GB/T 14914.2-2019, The specification for marine observation-Part 2: Offshore observationB/T 14914.2-2019, The specification for marine observation-Part 2: Offshore observation[S]. Beijing: State Administration of Market Supervision and Administration; China National Standardization Administration Committee, 2019.]
|
| [19] |
刘眉洁, 戴永寿, 张杰, 等. 高分辨率全极化合成孔径雷达数据海冰二次分类方法研究[J]. 海洋学报(中文版), 2013, 35(4):80-87.
[
|
| [20] |
|
| [21] |
邓鸿儒, 崔宸洋, 单文龙, 等. 基于高分三号卫星SAR影像的城市建筑区提取[J]. 地理信息世界, 2018, 25(6):79-84.
[
|
| [22] |
张晰, 张杰, 纪永刚. 基于纹理特征分析的辽东湾SAR影像海冰检测[J]. 海洋科学进展, 2008, 26(3):386-393.
[
|
| [23] |
宣国荣, 柴佩琪. 基于巴氏距离的特征选择[J]. 模式识别与人工智能, 1996, 9(4):324-329.
[
|
| [24] |
自然资源部, 中国海洋灾害公报[EB/OL]. { HYPERLINK “ http://www.mnr.gov.cn/sj/sjfw/hy/gbgg/zghyzhgb/” 2021-04-26.
[ Ministry of Natural Resources of the People’s Republic of China, Bulletin of China Marine Disaster[EB/OL]. {HYPERLINK “ 2021-04-26.]
|
| [25] |
刘成, 曹祥村, 尹朝晖, 等. 2007—2018年黄渤海海冰气候特征及其对气象因子的响应[J]. 海洋通报, 2019, 38(2):173-178.
[
|
| [26] |
武浩, 夏芸, 许映军, 等. 2004年以来中国渤海海冰灾害时空特征分析[J]. 自然灾害学报, 2016, 25(5):81-87.
[
|
| [27] |
许宁, 袁帅, 闫启仑. 渤海海冰及其对渤海生态环境的影响[J]. 环境保护, 2019, 47(7):20-25.
[
|
| [28] |
庞海洋. 近50年来渤海海冰时空变化与气候因子关系研究[D]. 烟台:鲁东大学, 2018.
[
|
| [29] |
|
/
| 〈 |
|
〉 |

