
AIS数据在集装箱港口服务效率的应用研究
|
陈伟杰(1991— ),男,河南信阳人,博士,助理研究员,主要从事港口发展、航运中心建设研究。E-mail: 18817338520@163.com |
收稿日期: 2021-03-23
修回日期: 2021-05-23
网络出版日期: 2022-03-25
基金资助
国家社会科学基金一般项目(20BJY177)
版权
Research on Service Efficiency of Container Ships at Port based on AIS Data
Received date: 2021-03-23
Revised date: 2021-05-23
Online published: 2022-03-25
Supported by
National Social Science Fund of China(20BJY177)
Copyright
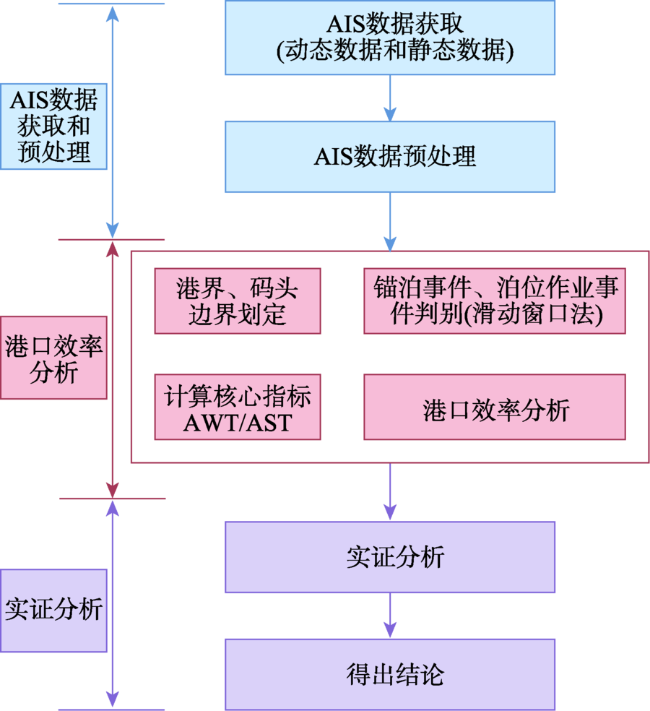
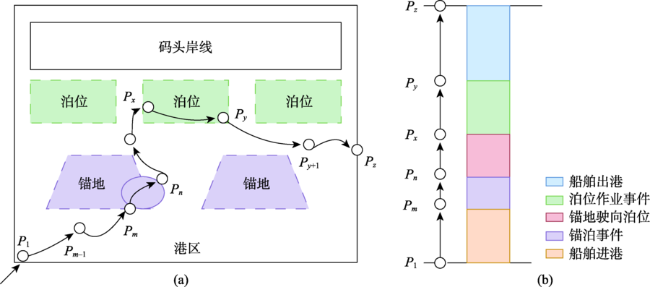
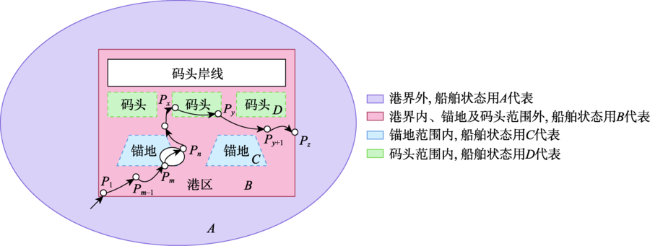
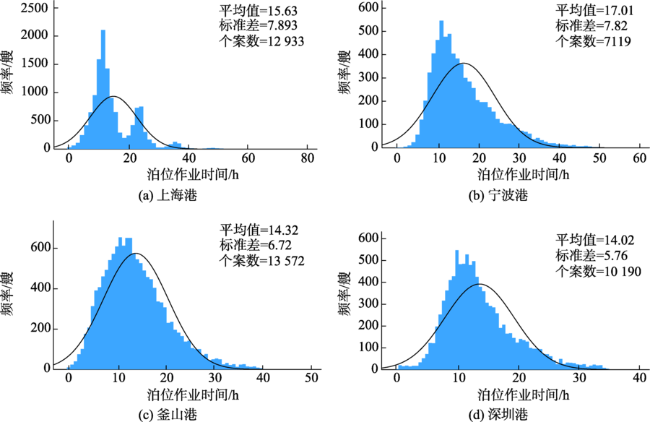
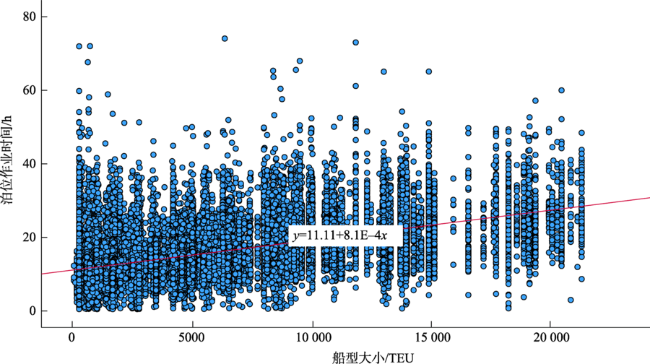
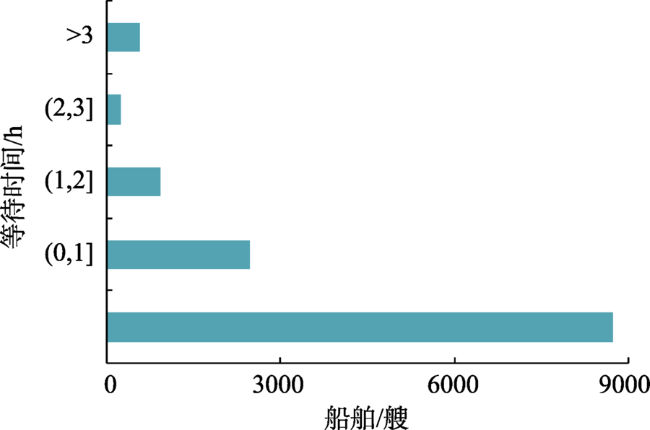
港口是物流供应链中的核心环节,港口服务效率会决定整个物流供应链的效率。本文提出了一种基于海量船舶AIS(Automatic Identification System)轨迹数据的港口服务效率计算框架,利用集装箱船舶AIS轨迹、港口地理信息等海事大数据,采用滑动窗口算法等数据挖掘方法判断船舶在港内的状态,估算出反映港口服务效率的AWT/AST指标,从时间维度对港口服务效率评价,为港口管理运营部门和航运公司决策提供参考。并以上海港、宁波港、深圳港、釜山港为例,采用2018年全年全球5600余艘集装箱船舶的AIS轨迹数据,量化评价4个亚洲集装箱港口的服务效率。结果显示:① 船舶抵港泊位作业时间近似正太分布,正太分布均值在14~18 h之间,船舶泊位作业时间集中在10~30 h;② 船舶泊位作业时间与船舶船型大小成正相关,船型越大则泊位作业时间越长;③ 32%的船舶抵达上海港会发生等待时间,体现上海港集装箱码头整体处于供不应求的状态。宁波港整体服务效率较高,船舶发生等待事件较少。作为区域性枢纽港,釜山港近洋区域性运输频繁使得釜山港抵港船舶频率较高。④ 洋山四期码头为自动化码头,其港口装卸工艺与其他码头不同,但其码头作业效率并未高很多。

陈伟杰 , 赵楠 , 张婕姝 , 宋炳良 . AIS数据在集装箱港口服务效率的应用研究[J]. 地球信息科学学报, 2022 , 24(1) : 153 -164 . DOI: 10.12082/dqxxkx.2022.210144
As the key node of logistics supply chain, port service plays a very important role in the flow of cargos. In this paper, we introduce a computation framework of port service efficiency based on maritime big data. We use ship AIS trajectories and port geographic information to detect the status of the ship based on the sliding window algorithm and estimate the service efficiency of container ships in port. The service efficiency of the container ports, including Shanghai, Ningbo, Shenzhen, and Busan, is evaluated based on the statistical analysis. The results of this paper show that: (1) The ship's arrival berthing time is approximately normally distributed. The average value of the normal distribution is between 14~18 h, and the ship's berthing time ranges between 10~30 h; (2) Ship berthing time is positively correlated with ship size, the berth operation time increases with larger ship sizes; (3) In Shanghai Port, nearly 32% of the ships suffered from port congestion because of waiting for berth. The service efficiency of Ningbo Port is relatively high, and there are fewer waiting incidents for ships. Busan Port also shows a higher frequency of ship arrivals; (4) The Phase IV of Yangshan Deepwater Port is an automated container terminal, having a different port handling technology from other terminals. However, its terminal service efficiency doesn't increase.
表1 AIS船舶数据结构Tab. 1 The AIS data introduction |
| 数据分类 | 数据 | 数据说明 |
|---|---|---|
| 静态数据 | MMSI编号 | MMSI编号为9位阿拉伯数字编号,全球船舶MMSI编号唯一 |
| 船名 | 中国船舶登记船名要求不能与登记在先的船舶重名或者同音,但国际上可能会有重名 | |
| 船舶总长 | 船舶最前端至最后端之间包括外板和两端永久性固定突出物在内的水平距离/m | |
| 船舶型宽 | 船体中横剖面上两舷的最大水平距离/m | |
| 载重吨 | 船舶允许装载货物的重量/t | |
| 船舶类型 | 分油轮、散货、集装箱船等 | |
| 动态数据 | 船舶状态 | 在航、锚泊、失控、靠泊、捕捞作业等 |
| 数据来源 | 主要来源于AIS基站、卫星数据、码头TOS系统等 | |
| 采集时间 | 采用UTC标准时间 | |
| 经纬度 | 经纬度是经度与纬度的合称组成一个坐标系统/° | |
| 船舶速度 | AIS数据发送时船舶的瞬时速度/节 |
表2 2018年上海港、宁波港、深圳港、釜山港停泊事件筛选Tab. 2 Stop events screening at Shanghai, Ningbo, Busan port in 2018 |
| 船舶MMSI编号 | 开始时间(时间戳) | 开始纬度/ºE | 开始经度/ºN | 结束时间(时间戳) | 结束纬度/ºE | 结束经度/ºN | 停泊时间/s |
|---|---|---|---|---|---|---|---|
| 211331640 | 1515797137 | 31.56 | 121.50 | 1515801957 | 31.56 | 121.50 | 4820 |
| 211387390 | 1517063120 | 30.62 | 122.06 | 1517071456 | 30.62 | 122.06 | 8336 |
| 212151000 | 1516975163 | 30.62 | 122.06 | 1516980418 | 30.62 | 122.06 | 5255 |
| 218566000 | 1516366319 | 30.62 | 122.06 | 1516369740 | 30.62 | 122.06 | 3421 |
| 219018271 | 1515422473 | 30.63 | 122.05 | 1515467078 | 30.63 | 122.05 | 44605 |
| 219018864 | 1516622247 | 30.63 | 122.05 | 1516628353 | 30.62 | 122.06 | 6106 |
| 219019094 | 1516866363 | 30.63 | 122.06 | 1516880704 | 30.63 | 122.06 | 14341 |
| …… | …… | …… | …… | …… | …… | …… | …… |
表3 采用Pearson相关系数对船舶泊位作业时间与船型大小的相关性分析Tab. 3 Using Pearson's correlation coefficient to analyze the correlation between berthing time and ship size |
| 泊位作业时间 | 船型大小 | ||
|---|---|---|---|
| 泊位作业时间 | Pearson相关性 | 1 | 0.536** |
| 显著性(双尾) | 0 | ||
| 个案数 | 43 778 | 43 778 | |
| 船型大小 | Pearson相关性 | 0.536** | 1 |
| 显著性(双尾) | 0 | ||
| 个案数 | 43 778 | 43 778 | |
注:**表在0.01级别(双尾),相关性显著。 |
表4 采用Spearman相关系数对船舶泊位作业时间与船型大小的非参数相关性分析Tab. 4 Using Spearman's correlation coefficient to analyze the correlation between berthing time and ship size |
| 泊位作业时间 | 船型大小 | ||
|---|---|---|---|
| 泊位作业时间 | Spearman相关性 | 1 | 0.514** |
| 显著性(双尾) | 0 | ||
| 个案数 | 43 778 | 43 778 | |
| 船型大小 | Spearman相关性 | 0.514** | 1 |
| 显著性(双尾) | 0 | ||
| 个案数 | 43 778 | 43 778 | |
注:**表在0.01级别(双尾),相关性显著。 |
表5 上海港、宁波港、深圳港、釜山港港口效率指标统计Tab. 5 Data for Service Efficiency of Shanghai container port and Singapore container port |
| 船舶抵港艘次 | 抵港作业事件 | 等待事件 | 等待事件占比 | 平均等待时间/h | 平均服务时间/h | 港口服务效率(AWT/AST) |
|---|---|---|---|---|---|---|
| 上海港 | 12 933 | 4143 | 0.32 | 1.39 | 15.6 | 0.089 |
| 宁波港 | 7119 | 836 | 0.12 | 1.06 | 17.0 | 0.055 |
| 深圳港 | 10 190 | 2361 | 0.23 | 0.83 | 14.0 | 0.059 |
| 釜山港 | 13 572 | 2146 | 0.16 | 0.90 | 14.3 | 0.063 |
表6 上海港各个码头服务效率统计Tab. 6 Service efficiency statistics of various terminals of Shanghai container port |
| 码头 | 平均服务 时间/h | 平均等待 时间/h | 港口服务效率AWT/AST |
|---|---|---|---|
| 张华浜 | 21.4 | 2.4 | 0.112 |
| 军工路 | 20.4 | 2.9 | 0.144 |
| 外高桥一、二期码头 | 15.8 | 0.6 | 0.035 |
| 外高桥四、五期码头 | 13.2 | 0.6 | 0.044 |
| 洋山一、二、三期码头 | 20.7 | 1.1 | 0.053 |
| 洋山四期码头 | 17.7 | 1.2 | 0.044 |
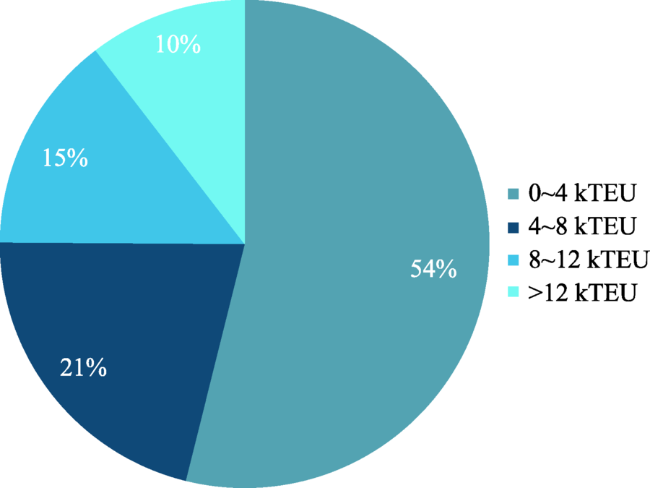
图10 2018年上海港抵港集装箱船型结构Fig. 10 Composition of container ships arriving at Shanghai Port in 2018 |
| [1] |
|
| [2] |
|
| [3] |
|
| [4] |
|
| [5] |
|
| [6] |
|
| [7] |
|
| [8] |
|
| [9] |
|
| [10] |
|
| [11] |
|
| [12] |
|
| [13] |
|
| [14] |
|
| [15] |
|
| [16] |
|
| [17] |
|
| [18] |
|
| [19] |
|
| [20] |
|
| [21] |
陈龙彪, 张大庆, 李石坚, 等. 基于海事大数据的港口感知计算[J]. 地球信息科学学报, 2016, 18(11):1485-1493.
[
|
| [22] |
|
| [23] |
|
| [24] |
|
| [25] |
|
| [26] |
|
| [27] |
张奇, 成毅, 徐立, 等. 顾及运动特征的滑动窗口轨迹数据压缩改进算法[J]. 测绘科学技术学报, 2020, 37(6):622-627.
[
|
| [28] |
|
/
| 〈 |
|
〉 |