
基于多源数据的夜间经济时空分布格局研究方法
|
曾磊鑫(1997— ),男,湖南益阳人,硕士生,主要从事时空数据挖掘。E-mail: 364030102@qq.com |
收稿日期: 2021-04-21
修回日期: 2021-07-17
网络出版日期: 2022-03-25
基金资助
国家重点研发计划课题(2016YFC0803106)
国家自然科学基金项目(41761088)
版权
Research Method of Temporal and Spatial Distribution Pattern of Night-time Economy based on Multi-source Data
Received date: 2021-04-21
Revised date: 2021-07-17
Online published: 2022-03-25
Supported by
National Key Research and Development Program of China(2016YFC0803106)
National Natural Science of China(41761088)
Copyright
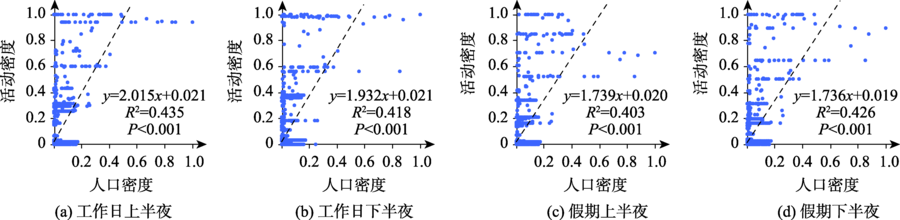
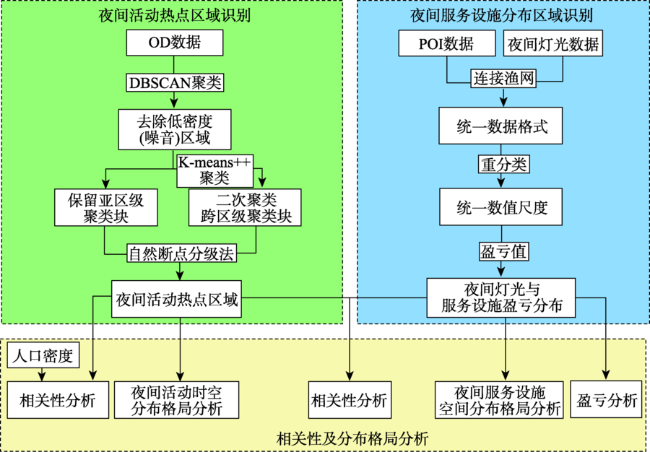
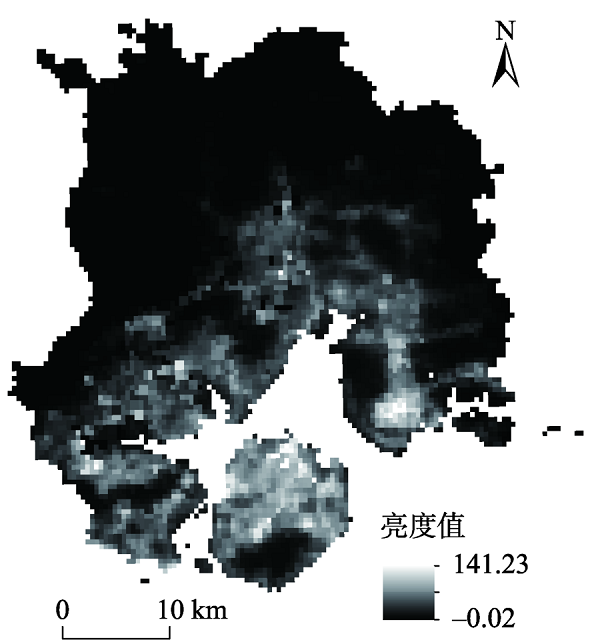
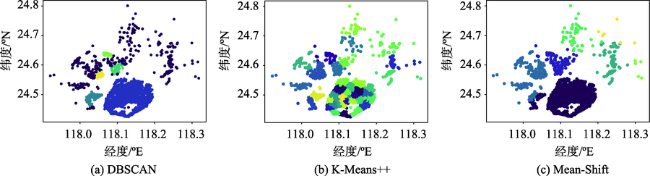
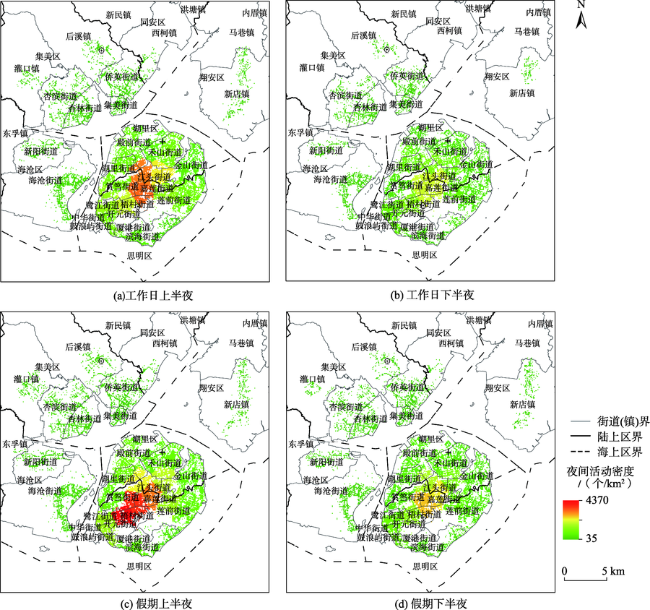
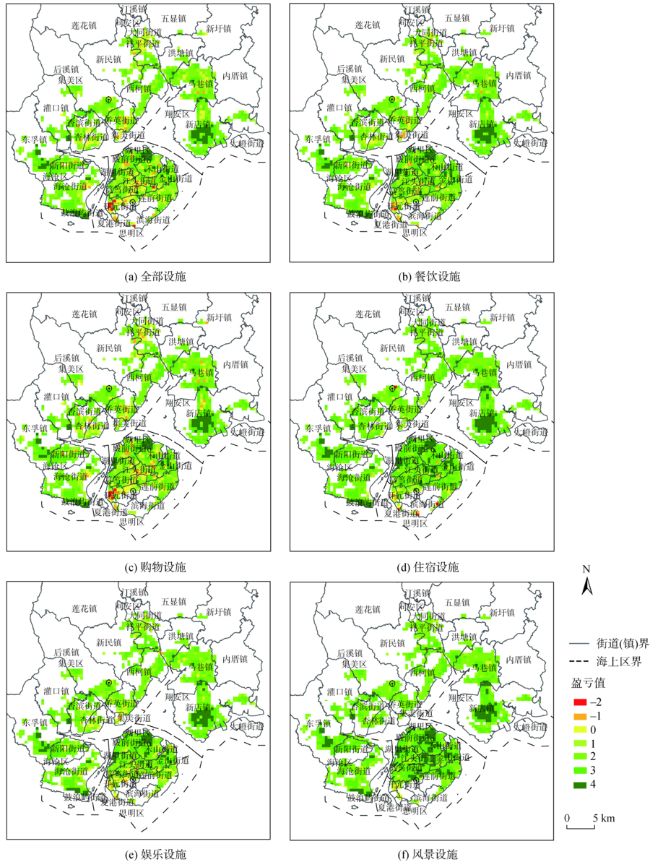
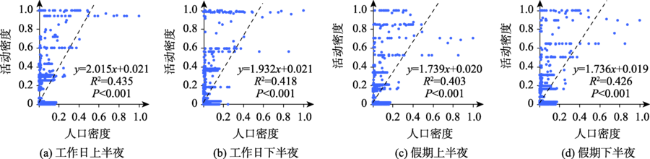
夜间经济是一个城市经济发展和消费水平的重要表征。目前国内外研究者对夜间经济的研究多停留在理论层面,或基于市场调研和问卷调查的小范围精细化研究。本文融合多源数据为夜间经济提供了新的视角,相较于传统的调查数据,具有更加快速、高效、广泛的特点,适合于夜间经济大范围研究。本文基于夜间灯光、POI、OD流等多源数据,采用DBSCAN、K-Means++等空间聚类算法和研究供需关系的盈亏法,分别从消费者角度和商户角度识别厦门市夜间活动热点区域和夜间服务设施分布区域,分析厦门市夜间经济时空分布格局及相关性。研究表明:① 厦门市夜间活动在空间上呈多环状分布并向四周递减,夜间活动热点区域分布受假期的影响因地而异;② 厦门市部分区域已有服务设施未能很好地服务于夜间经济,现有的照明、夜景等夜间灯光基础设施存在供给不足之处;③ 居住人口密度与夜间活动密度呈中度正相关,研究结果具有有效性,夜间服务设施盈亏值及数量、夜间灯光与夜间活动密度呈中、弱度相关,并且餐饮设施更加依赖于夜间灯光。最后,为厦门市未来夜间经济建设提出了根据不同的消费人群和心理提供不同的夜间服务、加强夜间灯光基础设施建设以及市场扶持的举措。研究结论对促进社会就业、增强基础设施使用率有积极意义,同时也能够为城市夜间经济发展和政策制定提供参考。
曾磊鑫 , 刘涛 , 杜萍 . 基于多源数据的夜间经济时空分布格局研究方法[J]. 地球信息科学学报, 2022 , 24(1) : 38 -49 . DOI: 10.12082/dqxxkx.2022.210212
Night-time economy refers to the related economic activities mainly in the services taking place in urban space and at night, which is an important representation of a city's economic development and consumption level. Currently, researchers at home and abroad mostly rest on the theoretical level, or small-scale refined research based on market research and questionnaire survey, lacking in-depth mining using models and mathematical statistics methods, and rarely intuitively show the specific temporal and spatial distribution of large-scale night-time economy. With the development of information technology, night lighting data and perception big data provide new data sources for quantitative research of night-time economy. This paper provides a new perspective for night-time economy by fusing multi-source data. Compared with the traditional survey data, it is more rapid, efficient, and extensive, which is suitable for large-scale research of night-time economy. Based on taxi OD flow, this paper uses spatial clustering algorithms such as DBSCAN and K-Means ++ to identify hot areas of night-time activities in Xiamen City from the perspective of consumers. Based on the night-time lighting image and POI, this paper analyzes the supply and demand relationship by the method of profit and loss and identifies the distribution area of night service facilities from the perspective of merchants. Then we analyze the temporal and spatial distribution pattern of night-time economy in Xiamen City. The results show that: ① The spatial distribution of night activities in Xiamen City is multi ring and decreases to the surrounding areas. The distribution of hot spots of night activities varies from place to place; ② The existing service facilities in some areas of Xiamen City fail to serve the night economy well, and the existing lighting infrastructure, such as lighting and nightscape, is insufficient; ③ There is a moderate positive correlation between residential population density and night activity density, and the results are valid. The profit and loss value and quantity of night service facilities, night lighting, and night activity density are moderately and weakly correlated, and catering facilities are more dependent on night lighting. Finally, we put forward some suggestions for Xiamen's future night-time economic construction, such as providing different night-time services according to different consumer groups and psychology, strengthening the construction of night light infrastructure and market support. The research conclusions are of positive significance to promote social employment, and enhance the utilization rate of infrastructure. At the same time, they can also provide reference for urban economic development and policy formulation.
表1 2019年厦门市POI数据Tab. 1 POI data of Xiamen City in 2019 |
| 类型 | 内容 | 数量/个 | 比重/% |
|---|---|---|---|
| 购物 | 商业广场、各类超市等 | 62 039 | 52.33 |
| 餐饮 | 中餐厅、快餐店等 | 44 033 | 37.14 |
| 住宿 | 星级宾馆等 | 5686 | 4.80 |
| 娱乐 | 酒吧迪厅、KTV等 | 4526 | 3.82 |
| 风景 | 公园、寺庙等 | 2271 | 1.91 |
| 总计 | - | 118 555 | 100 |
表2 2019年6月3日至6月9日厦门市出租车OD数据Tab. 2 Example of taxi OD flows in Xiamen City from June 3 to June 9, 2019 |
| 研究时段 | 日期 | 时段 | 出行量/人 |
|---|---|---|---|
| 工作日上半夜 | 2019年6月3日至6月5日 | 19:00—00:00 | 181 348 |
| 工作日下半夜 | 2019年6月4日至6月6日 | 00:00—05:00 | 93 099 |
| 假期上半夜 | 2019年6月6日至6月8日 | 19:00—00:00 | 196 569 |
| 假期下半夜 | 2019年6月7日至6月9日 | 00:00—05:00 | 115 040 |
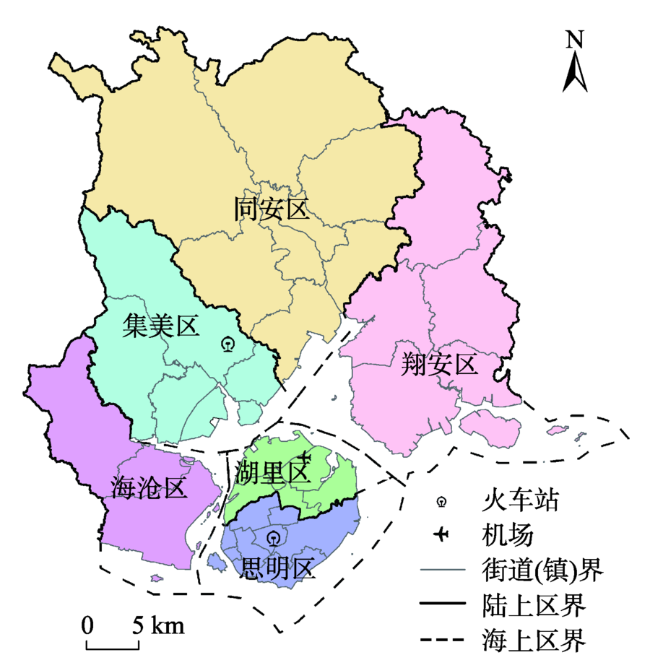
表3 2019年6月3日至6月9日厦门市夜间活动不同等级聚类簇主要分布区域及相关指标Tab. 3 Main distribution areas and related indicators of different levels of nocturnal activity cluster in Xiamen City from June 3 to June 9, 2019 |
| 聚类簇 | 主要分布区域 | 平均夜间活动密度/(人/km2) | 假期外来消费者增量/人 | 假期外来消费者占比/% |
|---|---|---|---|---|
| 高密度区域 | 嘉莲 | 2768 | 3159 | 9.2 |
| 梧村 | 2490 | 11 060 | 35.8 | |
| 江头 | 2096 | 1705 | 5.0 | |
| 筼筜 | 1829 | 3895 | 13.8 | |
| 开元 | 1810 | 5253 | 35.8 | |
| 中密度区域 | 鹭江 | 1073 | 1005 | 11.5 |
| 湖里 | 1067 | 1585 | 7.6 | |
| 中华 | 1012 | 1601 | 20.0 | |
| 厦港 | 1012 | 679 | 15.0 | |
| 莲前 | 919 | 3953 | 12.9 | |
| 殿前 | 853 | 2240 | 11.4 | |
| 禾山 | 835 | 3344 | 11.8 | |
| 金山 | 829 | 1614 | 8.5 | |
| 低密度区域 | 滨海 | 381 | 3920 | 27.9 |
| 海沧 | 99 | 1453 | 17.5 | |
| 集美 | 78 | 338 | 19.5 | |
| 侨英 | 78 | 696 | 18.1 | |
| 杏林 | 75 | 537 | 18.5 | |
| 西柯镇 | 74 | 190 | 37.8 | |
| 杏滨 | 74 | 500 | 21.2 |
表4 2019年6月3日至6月9日厦门市夜间服务设施及灯光基础设施与夜间活动密度相关性Tab. 4 Correlation between night service facilities, lighting infrastructure and night activity density in Xiamen City from June 3 to June 9, 2019 |
| 自变量 | 活动密度 | ||||
|---|---|---|---|---|---|
| 工作日上半夜 | 工作日下半夜 | 假期上半夜 | 假期下半夜 | ||
| 归一化 盈亏值 | 餐饮 | 0.270 | 0.251 | 0.293 | 0.227 |
| 购物 | -0.068 | -0.073 | -0.089 | -0.058 | |
| 住宿 | -0.146 | -0.133 | -0.157 | -0.132 | |
| 休闲 | -0.069 | -0.053 | -0.038 | -0.038 | |
| 风景 | -0.038 | -0.042 | -0.052 | -0.039 | |
| 归一化 数量值 | 餐饮 | 0.039 | 0.110 | 0.144 | 0.083 |
| 购物 | 0.666 | 0.622 | 0.449 | 0.541 | |
| 住宿 | -0.216 | -0.223 | -0.164 | -0.193 | |
| 休闲 | 0.720 | 0.688 | 0.764 | 0.666 | |
| 风景 | 0.042 | 0.031 | 0.012 | 0.010 | |
| 灯光 | 0.322 | 0.285 | 0.2526 | 0.245 | |
| R2 | 0.412 | 0.397 | 0.390 | 0.390 | |
注:红色数值为未通过10%显著性检验。 |
| [1] |
毛中根, 龙燕妮, 叶胥. 夜间经济理论研究进展[J]. 经济学动态, 2020(2):103-116.
[
|
| [2] |
|
| [3] |
|
| [4] |
|
| [5] |
|
| [6] |
|
| [7] |
来有为. 上海夜间经济的发展特征、存在的主要问题及相关政策建议[J]. 上海经济, 2019(5):5-14.
[
|
| [8] |
董晓峰, 董妮, 刘理臣, 等. 敦煌市夜晚经济时空变化规律研究——以敦煌夜市为例[J]. 城市发展研究, 2018, 25(9):后插5-后插9.
[
|
| [9] |
隗剑秋, 彭玉玲, 周鹏, 等. POE评价在城市公共空间修补更新中作用初探[J]. 华中建筑, 2019, 37(9):70-73.
[
|
| [10] |
靳泓, 应文. 重庆夜间经济分析研究[J]. 灯与照明, 2017, 41(2):18-22.
[
|
| [11] |
吴敏. 河北省城市夜经济研究[D]. 天津:河北工业大学, 2015.
[
|
| [12] |
白艳, 朱安然, 杨滢钰, 等. 基于微博位置大数据的合肥城区夜生活空间研究[J]. 建筑与文化, 2018(10):185-186.
[
|
| [13] |
郭恒梅, 马晓冬. 基于夜间灯光数据的淮海经济区经济空间格局演化及中心性测度[J]. 地理与地理信息科学, 2020, 36(2):34-40,125.
[
|
| [14] |
曾冰. 基于NPP/VIIRS夜间灯光数据的湘鄂赣省际交界区县域经济空间格局及影响因素[J]. 地理科学, 2020, 40(6):900-907.
[
|
| [15] |
|
| [16] |
唐锦玥, 何益珺, 塔娜. 基于POI数据的上海市餐饮业空间分布特征及影响因素[J]. 热带地理, 2020, 40(6):1015-1025.
[
|
| [17] |
高岩辉, 杨晴青, 梁璐, 等. 基于POI数据的西安市零售业空间格局及影响因素研究[J]. 地理科学, 2020, 40(5):710-719.
[
|
| [18] |
杨文军, 孟凡冬, 李游, 等. 基于车辆轨迹OD数据分析乘客出行特征的研究[J]. 测绘与空间地理信息, 2020, 43(S1):144-147,150.
[
|
| [19] |
牟乃夏, 张恒才, 陈洁, 等. 轨迹数据挖掘城市应用研究综述[J]. 地球信息科学学报, 2015, 17(10):1136-1142.
[
|
| [20] |
涂伟, 曹劲舟, 高琦丽, 等. 融合多源时空大数据感知城市动态[J]. 武汉大学学报·信息科学版, 2020, 45(12):1875-1883.
[
|
| [21] |
程浩然, 蒙吉军, 朱利凯. 基于多源地理数据融合的黑河中游土地多功能性时空格局与权衡研究[J]. 干旱区地理, 2021, 44(1):208-220.
[
|
| [22] |
赵晓旭. 融合多源时空数据的城市火灾危险性评估[J]. 测绘通报, 2020(5):101-106.
[
|
| [23] |
崔晓临, 张佳蓓, 吴锋, 等. 基于多源数据融合的北京市人口时空动态分析[J]. 地球信息科学学报, 2020, 22(11):2199-2211.
[
|
| [24] |
李志林, 刘启亮, 唐建波. 尺度驱动的空间聚类理论[J]. 测绘学报, 2017, 46(10):1534-1548.
[
|
| [25] |
王劲峰, 葛咏, 李连发, 等. 地理学时空数据分析方法[J]. 地理学报, 2014, 69(9):1326-1345.
[
|
| [26] |
郭名静, 边少锋, 单潮龙, 等. 位置数据中的城市行业空间特征挖掘[J]. 测绘科学, 2020, 45(10):127-134,142.
[
|
| [27] |
|
| [28] |
章永来, 周耀鉴. 聚类算法综述[J]. 计算机应用, 2019, 39(7):1869-1882.
[
|
| [29] |
杨俊闯, 赵超. K-Means聚类算法研究综述[J]. 计算机工程与应用, 2019, 55(23):7-14,63.
[
|
| [30] |
苏延平. 依赖混合型位置大数据的均值漂移聚类算法[J]. 山西能源学院学报, 2020, 33(2):97-99.
[
|
| [31] |
|
| [32] |
武增海, 李涛. 高新技术开发区综合绩效空间分布研究——基于自然断点法的分析[J]. 统计与信息论坛, 2013, 28(3):82-88.
[
|
| [33] |
刘丹丹, 黄安民, 杨飞飞. 基于多源数据的旅游公共设施空间分布特征及供需平衡研究——以福建省厦门市为例[J]. 资源开发与市场, 2020, 36(10):1178-1184.
[
|
| [34] |
2019中国夜间经济发展报告[EB/OL]. https://www.sohu.com/a/354486191_120291586, 2019-11-16.
[
|
| [35] |
Monthly Cloud-free DNB Composite[DB/OL]. https://eogdata.mines.edu/download_dnb_composites.html.
|
| [36] |
Amap[DB/OL]. https://lbs.amap.com.
|
| [37] |
Big Data Security Open Innovation Application Competition of Xiamen[DB/OL]. https://data.xm.gov.cn/opendata-contest.
|
| [38] |
Population Density[DB/OL] https://www.worldpop.org.
|
/
| 〈 |
|
〉 |