
基于交通大数据的南昌市中心城区等时圈划分及特征分析
|
刘琳琳(1992— ),女,河南信阳人,博士生,主要从事城市数据分析及模拟。E-mail: divine@csu.edu.cn |
收稿日期: 2021-07-03
要求修回日期: 2021-10-19
网络出版日期: 2022-04-25
基金资助
国家自然科学基金面上项目(51478470)
中南大学研究生自主探索创新项目(2019zzts840)
版权
Division and Feature Analysis of Nanchang Urban Center Isochrone Maps based on Traffic Big Data
Received date: 2021-07-03
Request revised date: 2021-10-19
Online published: 2022-04-25
Supported by
National Natural Science Foundation of China(51478470)
Fundamental Research Funds for the Central Universities of Central South University(2019zzts840)
Copyright
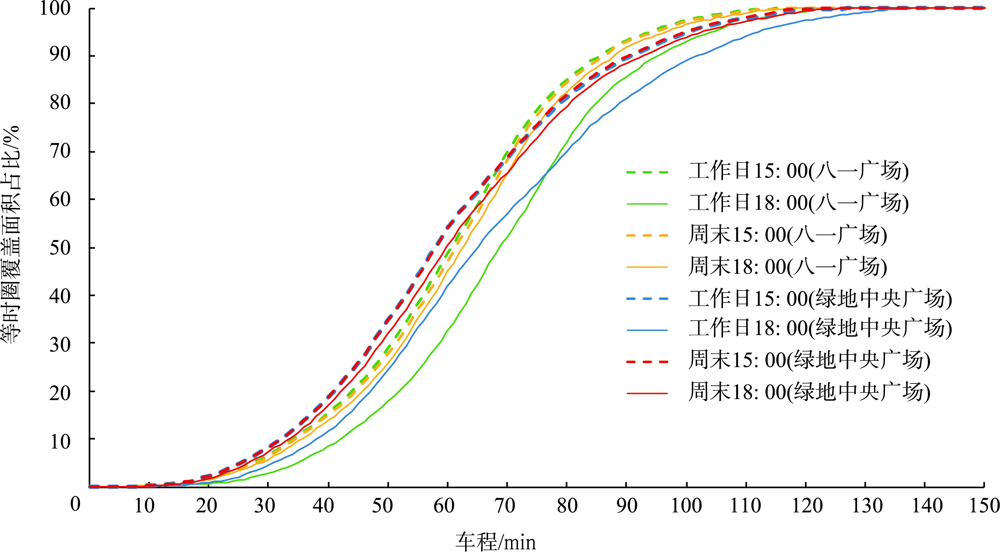
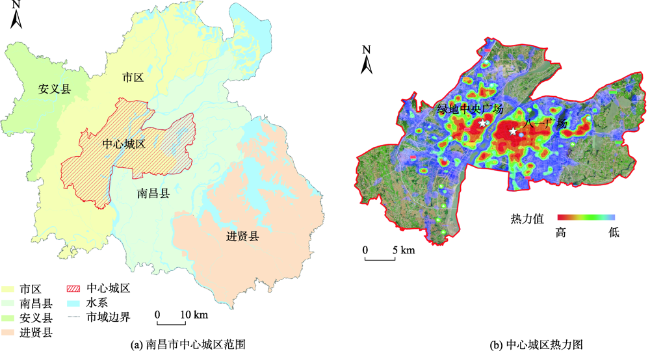
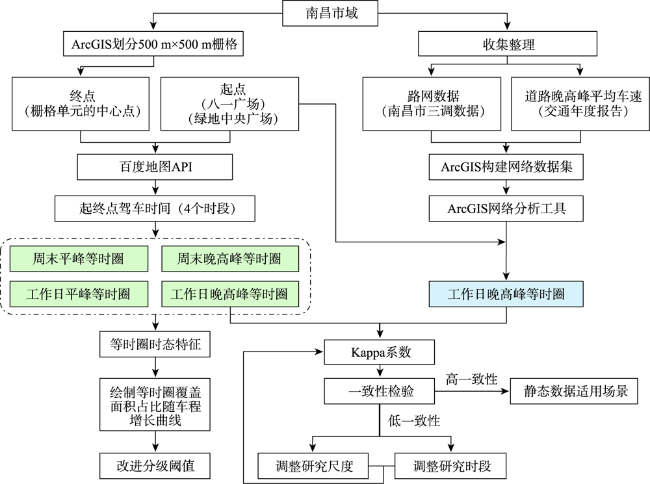
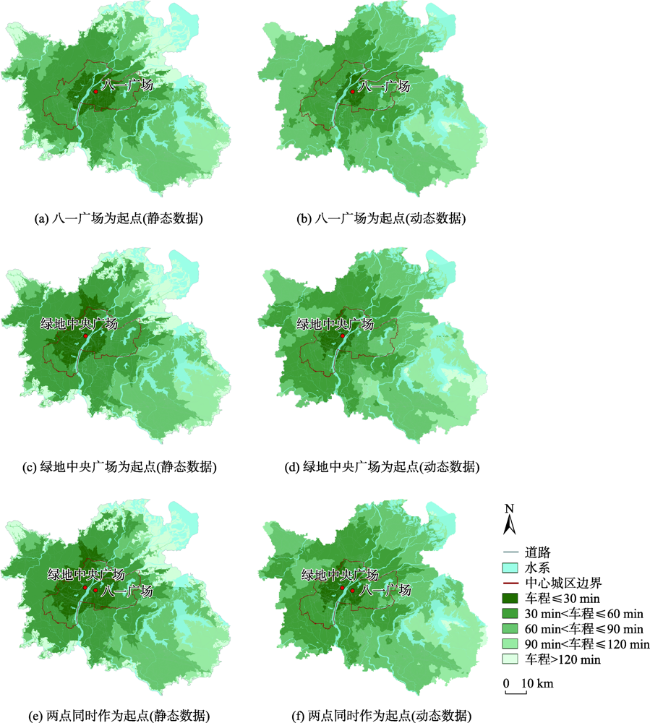
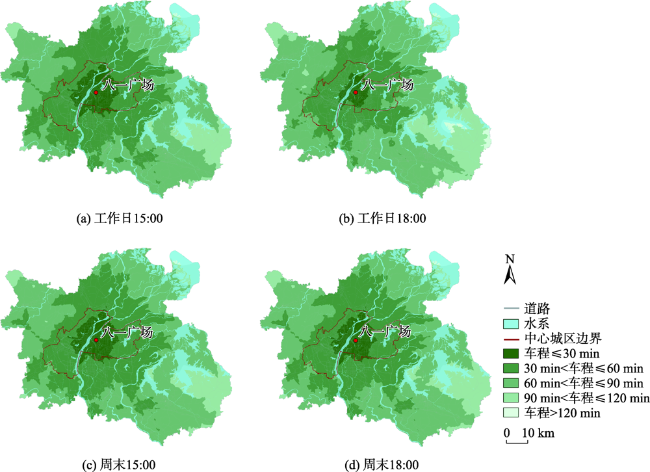
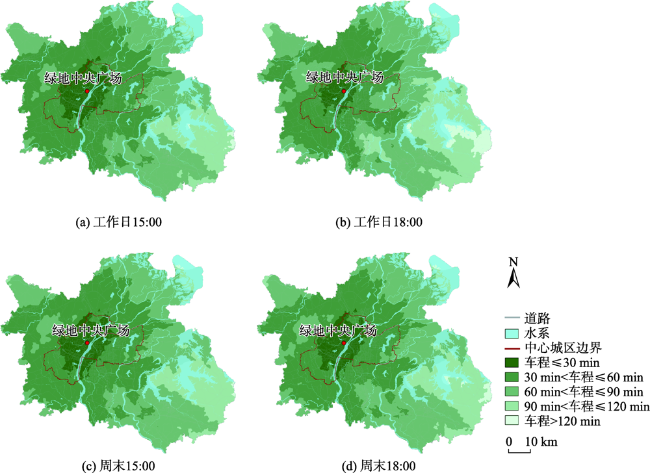
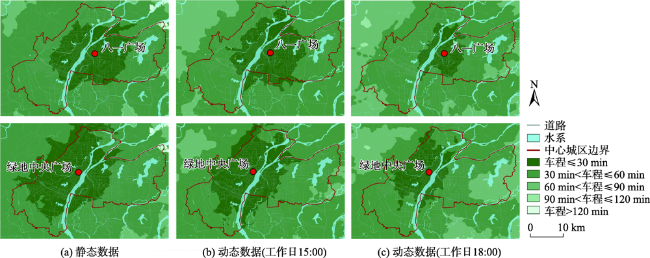
在当前国土空间规划的背景下,自然资源部提出了基于等时圈的中心城区可达性评价方法。本文以南昌市为研究对象,利用静态交通数据和从开放地图平台获取的工作日15:00(平峰)、18:00(晚高峰)和周末的15:00、18:00的动态交通数据分别生成中心城区等时圈,随后使用混淆矩阵及Kappa系数对两种数据的结果进行一致性检验。研究发现:南昌市中心城区大部分区域都位于以八一广场或绿地中央广场为起点的60 min等时圈内,南昌市域大部分区域则位于120 min等时圈内;静态数据生成的等时圈与对应的工作日晚高峰的动态数据生成的等时圈相比仅具有一般一致性,但前者在中心城区尺度与工作日平峰的动态数据生成的等时圈达到了高度的一致性,更适合在中心城区层面评价工作日平峰的可达性;4个时段的动态数据的等时圈结果表明工作日15:00的中心城区可达性明显优于其他3个时段,但各个时段的等时圈覆盖面积占市域面积的比例随车程的增加都呈现出Logistic曲线特征,各曲线增长的关键时间节点能够为等时圈划分提供更有针对性的分级阈值。
刘琳琳 , 郑伯红 , 骆晨 . 基于交通大数据的南昌市中心城区等时圈划分及特征分析[J]. 地球信息科学学报, 2022 , 24(2) : 220 -234 . DOI: 10.12082/dqxxkx.2022.210372
For the current territory development planning in China, the Ministry of Natural Resources has put forward a method to evaluate the accessibility of urban centers based on isochrone maps. The use of dynamic traffic data in isochrone maps studies is becoming more and more recurrent, but comparative analyses between dynamic and static data are still rare. In this paper, Nanchang city is taken as a case study to generate the urban center isochrone maps using static and dynamic traffic data. The city is divided into 500 m×500 m grids, with each grid center point representing a given destination while Bayi Square and Greenland Central Square are set as origins. Using the above origins and destinations, the dynamic data were obtained daily from the Baidu open map platform at 15:00 and at 18:00 over nine days-time (Saturday-next Sunday). Subsequently, the confusion matrix and Kappa coefficient are used to test the consistency between the isochrone maps generated by the two datasets. The results suggest that most of Nanchang urban central areas are within a 60 min-circle and most of Nanchang's urban areas are within a 120 min-circle, when taking Bayi Square or Greenland Central Square as the origin. The isochrone maps generated by the static data has just a fair consistency with those generated by the dynamic data at evening peak time on workdays. Within the urban central areas, the isochrone maps generated by the static data have reached a substantial consistency with those generated by the dynamic data at off-peak time on workdays, indicating that the static data is more suitable for evaluating the urban center accessibility at off-peak time on workdays. Besides, the dynamic data can display the temporal characteristics of the isochrone maps. The isochrone maps of the dynamic data at 4 time-points show that the urban center accessibility at 15:00 on workdays is significantly better than others. But the proportions of isochrone surfaces to the total urban areas are found to increase with the drivetime, and their growth curves are in accordance with the trend of the Logistic curve. The key time nodes of each growth curve can provide more targeted division thresholds for isochrone maps. This research highlights the accuracy of the isochrone maps generated by the dynamic data and explores the applicability of the static data. The research also shows that using the key time nodes of the Logistic curve contributes to a more reasonable subdivision of the isochrone map.
表1 中心城区可达性评价分级参考阈值Tab. 1 Division reference thresholds for evaluation of urban center accessibility |
| 评价指标 | 分级参考阈值 | 赋值 |
|---|---|---|
| 中心城区可达性 | 车程≤30 min | 5 |
| 30 min<车程≤60 min | 4 | |
| 60 min<车程≤90 min | 3 | |
| 90 min<车程≤120 min | 2 | |
| 车程>120min | 1 |
表2 6个场景中各级等时圈覆盖面积占市域面积的比例Tab. 2 Proportions of the isochrone maps to the total urban areas in six scenarios (%) |
| 分级 | 以八一广场为起点 | 以绿地中央广场为起点 | 两点同时作为起点 | |||||
|---|---|---|---|---|---|---|---|---|
| 静态数据 | 动态数据 | 静态数据 | 动态数据 | 静态数据 | 动态数据 | |||
| 车程≤30 min | 6.52 | 2.44 | 10.10 | 3.96 | 11.76 | 5.16 | ||
| 车程≤60 min | 45.56 | 30.65 | 51.20 | 39.97 | 53.44 | 43.78 | ||
| 车程≤90 min | 81.24 | 84.77 | 80.61 | 80.23 | 81.84 | 86.69 | ||
| 车程≤120 min | 92.70 | 99.17 | 92.64 | 97.19 | 92.72 | 99.17 | ||
表3 2种数据生成的各级等时圈内终点数量的混淆矩阵(以八一广场为起点)Tab. 3 Confusion matrix of the number of destinations in different isochrone maps generated by the two datasets (with Bayi Square as the origin) |
| 动态数据 | 静态数据 | ||||
|---|---|---|---|---|---|
| ≤30 min | 30~60 min | 60~90 min | 90~120 min | >120 min | |
| ≤30 min | 597 | 15 | 0 | 0 | 0 |
| 30~60 min | 853 | 5501 | 427 | 41 | 240 |
| 60~90 min | 1 | 3728 | 6518 | 679 | 2628 |
| 90~120 min | 0 | 48 | 1082 | 1602 | 873 |
| >120 min | 0 | 0 | 0 | 145 | 63 |
表4 2种数据生成的各级等时圈内的终点数量的混淆矩阵(以绿地中央广场为起点)Tab. 4 Confusion matrix of the number of destinations in different isochrone maps generated by the two datasets (with Greenland Central Square as the origin) |
| 动态数据 | 静态数据 | ||||
|---|---|---|---|---|---|
| ≤30 min | 30~60 min | 60~90 min | 90~120 min | >120 min | |
| ≤30 min | 971 | 20 | 0 | 0 | 0 |
| 30~60 min | 1378 | 6630 | 481 | 93 | 435 |
| 60~90 min | 0 | 3011 | 4104 | 442 | 2525 |
| 90~120 min | 0 | 144 | 1890 | 1510 | 704 |
| >120 min | 0 | 0 | 29 | 519 | 155 |
表5 2种数据生成的各级等时圈内的终点数量的混淆矩阵(两点同时作为起点)Tab. 5 Confusion matrix of the number of destinations in different isochrone maps generated by the two datasets (with Bayi Square and Greenland Central Square as the origins) |
| 动态数据 | 静态数据 | ||||
|---|---|---|---|---|---|
| ≤30 min | 30~60 min | 60~90 min | 90~120 min | >120 min | |
| ≤30 min | 1266 | 26 | 0 | 0 | 0 |
| 30~60 min | 1466 | 7128 | 449 | 30 | 145 |
| 60~90 min | 1 | 2745 | 4856 | 437 | 2510 |
| 90~120 min | 0 | 24 | 966 | 1311 | 1008 |
| >120 min | 0 | 0 | 0 | 538 | 135 |
图4 使用动态数据生成的以八一广场为起点的4个时段的等时圈Fig. 4 Isochrone maps at four time-points generated by the dynamic traffic data with Bayi Square as the origin |
表6 4个时段的各级等时圈覆盖面积占市域面积的比例Tab. 6 Proportions of the isochrone maps to the total urban areas at four time-points (%) |
| 分级 | 起点 | 工作日15:00 | 工作日18:00 | 周末15:00 | 周末18:00 |
|---|---|---|---|---|---|
| 车程≤30 min | 八一广场 | 5.91 | 2.44 | 5.77 | 5.16 |
| 绿地中央广场 | 7.54 | 3.96 | 7.51 | 6.64 | |
| 车程≤60 min | 八一广场 | 46.51 | 30.65 | 44.90 | 42.69 |
| 绿地中央广场 | 52.02 | 39.97 | 52.01 | 48.40 | |
| 车程≤90 min | 八一广场 | 92.73 | 84.77 | 92.40 | 91.00 |
| 绿地中央广场 | 88.99 | 80.23 | 89.31 | 87.82 | |
| 车程≤120 min | 八一广场 | 99.93 | 99.17 | 99.93 | 99.93 |
| 绿地中央广场 | 99.57 | 97.19 | 99.82 | 99.20 |
图7 等时圈覆盖面积占比随车程变化曲线Fig. 7 Growth curves of the proportions of isochrone surfaces to the total urban area with drivetime |
表7 SPSS中求解的各曲线对应的a、b值Tab. 7 a and b values of each curve solved in SPSS |
| 以八一广场为起点 | 以绿地中央广场为起点 | ||||||||
|---|---|---|---|---|---|---|---|---|---|
| 工作日15:00 | 工作日18:00 | 周末15:00 | 周末18:00 | 工作日15:00 | 工作日18:00 | 周末15:00 | 周末18:00 | ||
| a | 216.885 | 357.323 | 222.771 | 234.425 | 95.569 | 106.236 | 98.559 | 102.937 | |
| b | 0.088 | 0.084 | 0.087 | 0.086 | 0.076 | 0.069 | 0.076 | 0.075 | |
表8 各曲线增长的关键时间节点Tab. 8 Key time-nodes of each growth curve (min) |
| 以八一广场为起点 | 以绿地中央广场为起点 | ||||||||
|---|---|---|---|---|---|---|---|---|---|
| 工作日15:00 | 工作日18:00 | 周末15:00 | 周末18:00 | 工作日15:00 | 工作日18:00 | 周末15:00 | 周末18:00 | ||
| t1 | 46 | 54 | 47 | 48 | 43 | 49 | 43 | 44 | |
| t | 61 | 70 | 62 | 63 | 60 | 68 | 60 | 62 | |
| t2 | 76 | 86 | 77 | 79 | 77 | 87 | 78 | 79 | |
| [1] |
张童, 姚士谋, 胡伟平, 等. 基于交通可达性的广佛都市区城市扩展的模拟与分析[J]. 地理科学, 2018, 38(5):737-746.
[
|
| [2] |
江世雄. 城市公共交通系统可达性评价与优化方法[D]. 北京:北京交通大学, 2019.
[
|
| [3] |
刘正兵, 张超, 戴特奇. 北京多种公共服务设施可达性评价[J]. 经济地理, 2018, 38(6):77-84.
[
|
| [4] |
|
| [5] |
丁愫, 陈报章. 城市医疗设施空间分布合理性评估[J]. 地球信息科学学报, 2017, 19(2):185-196.
[
|
| [6] |
仝德, 孙裔煜, 谢苗苗. 基于改进高斯两步移动搜索法的深圳市公园绿地可达性评价[J]. 地理科学进展, 2021, 40(7):1113-1126.
[
|
| [7] |
谢双玉, 张琪, 龚箭, 等. 城市旅游景点可达性综合评价模型构建及应用——以武汉市主城区为例[J]. 经济地理, 2019, 39(3):232-239.
[
|
| [8] |
中华人民共和国自然资源部. 资源环境承载能力和国土空间开发适宜性评价指南(试行)[EB/OL]. (http://gi.mnr.gov.cn/202001/t20200121_2498502.html),2020-1-19.
[ Ministry of Natural Resources of the People's Republic of China. Guidelines for evaluating the carrying capacity of resources and environment and the suitability of territorial space development (trial implementation) [EB/OL]. (http://gi.mnr.gov.cn/202001/t20200121_2498502.html),2020-1-19.
|
| [9] |
|
| [10] |
陈洁, 陆锋, 程昌秀. 可达性度量方法及应用研究进展评述[J]. 地理科学进展, 2007, 26(5):100-110.
[
|
| [11] |
|
| [12] |
|
| [13] |
|
| [14] |
|
| [15] |
|
| [16] |
|
| [17] |
|
| [18] |
宋小冬, 钮心毅. 再论居民出行可达性的计算机辅助评价[J]. 城市规划汇刊, 2000(3):18-22,75-79.
[
|
| [19] |
|
| [20] |
|
| [21] |
浩飞龙, 王士君, 谢栋灿, 等. 基于互联网地图服务的长春市商业中心可达性分析[J]. 经济地理, 2017, 37(2):68-75.
[
|
| [22] |
熊刚, 董西松, 朱凤华, 等. 城市交通大数据技术及智能应用系统[J]. 大数据, 2015, 1(4):81-96.
[
|
| [23] |
|
| [24] |
中国城市规划设计研究院, 南昌市城市规划设计研究总院. 南昌市城市总体规划(2016-2035)[R]. 2017.
[ China academy of urban planning & design, Nanchang urban planning & design institute. Overall planning of Nanchang city (2016-2035)[R]. 2017. ]
|
| [25] |
杨育军, 宋小冬. 基于GIS的可达性评价方法比较[J]. 建筑科学与工程学报, 2004(4):27-32.
[
|
| [26] |
陆化普, 王继峰, 张永波. 城市交通规划中交通可达性模型及其应用[J]. 清华大学学报(自然科学版), 2009, 49(6):781-785.
[
|
| [27] |
南昌市交通规划研究所. 2019年南昌市交通发展年度报告暨交通运行分析年度报告[R]. 2019.
[ Nanchang transportation planning institute. 2019 Nanchang transport development and traffic operation analysis annual report[R]. 2019. ]
|
| [28] |
|
| [29] |
旷俭, 葛雯斐, 张全, 等. 基于手机内置传感器的车辆组合定位方法[J]. 中国惯性技术学报, 2020, 28(6):701-708.
[
|
| [30] |
|
| [31] |
|
| [32] |
百度地图开放平台[EB/OL]. (https://lbsyun.baidu.com).
[ Baidu map open platform[EB/OL]. (http://lbsyun.baidu.com).]
|
| [33] |
|
| [34] |
|
| [35] |
|
| [36] |
崔党群. Logistic曲线方程的解析与拟合优度测验[J]. 数理统计与管理, 2005, 24(1):112-115.
[
|
| [37] |
|
/
| 〈 |
|
〉 |
