
正六边形格网DEM下的等高线生成算法及质量评价
|
肖 坤(1996— ),男,河北沧州人,硕士生,主要从事地图综合、六边形DEM格网研究。E-mail: 2019202050048@whu.edu.cn |
收稿日期: 2021-07-17
修回日期: 2021-08-13
网络出版日期: 2022-06-25
基金资助
国家自然科学基金重点项目(41531180)
版权
Contour Generation Algorithm and Quality Evaluation of Regular Hexagon Grid DEM
Received date: 2021-07-17
Revised date: 2021-08-13
Online published: 2022-06-25
Supported by
Key Projects of National Natural Science Foundation of China National Natural Science Foundation of China(41531180)
Copyright
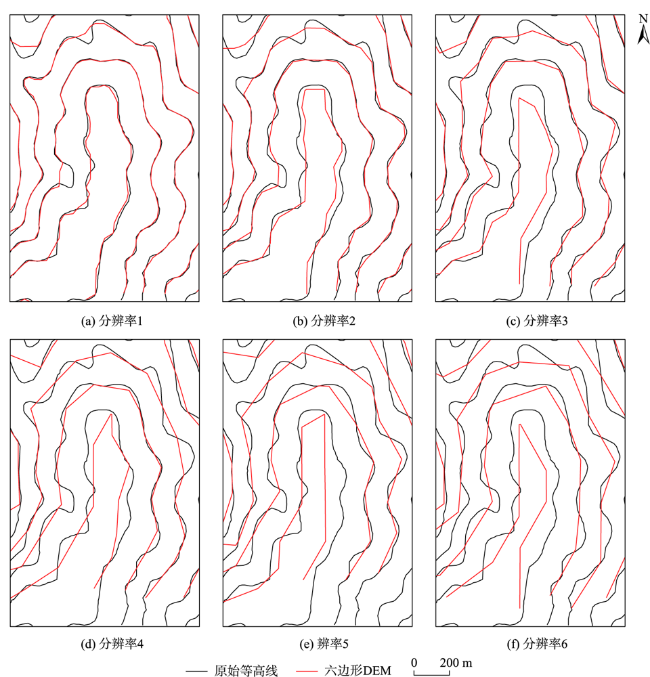
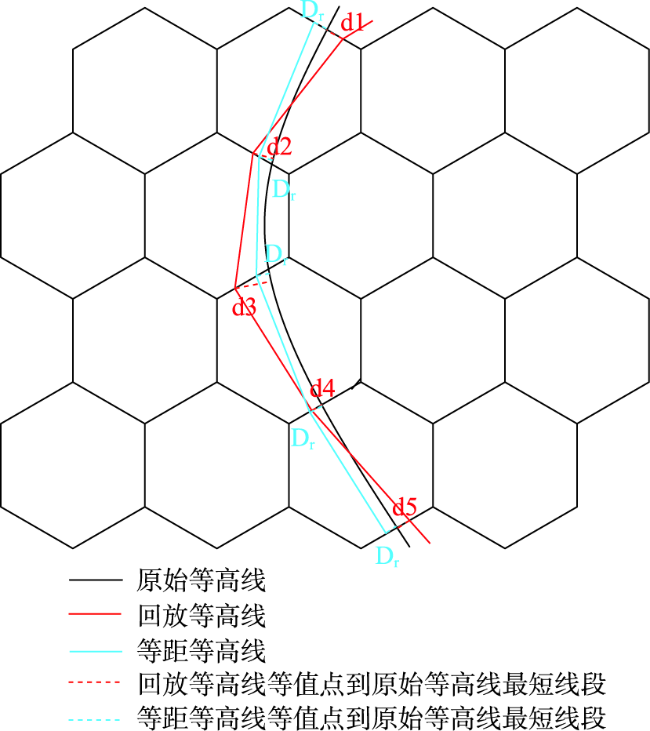
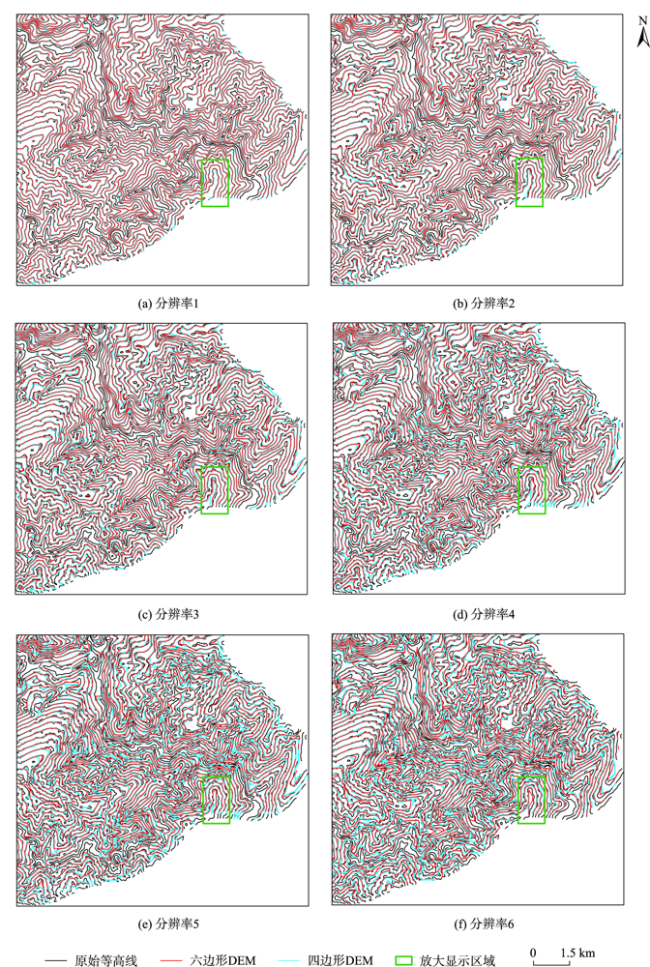
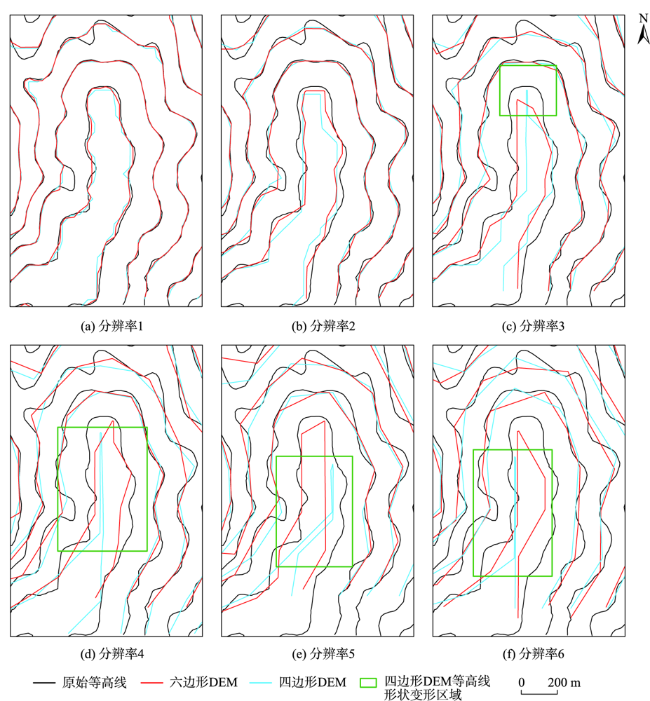
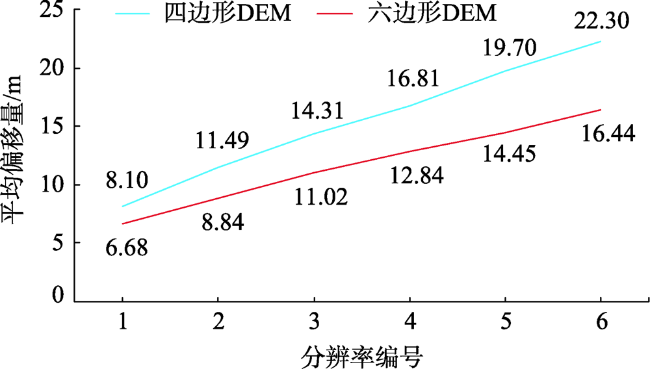
正六边形格网由于各向同性、邻接等效、拟合精度高等优点,被作为规则格网DEM数据结构的格网单元,已应用到流向分析、谷地线提取等数字地形分析中,但是其质量检测评价仍没有得到很好的研究,DEM的质量直接影响到后续数据分析结果以及相关决策的正确性与可靠性。使用常规的方法如检查点法、剖面法只能在局部评价DEM的误差情况,无法全面的评价DEM的质量。而等高线能够反映地形地貌的整体情况,因此等高线回放法通过分析回放等高线的质量,进而检测评价DEM的质量,是评价DEM质量的一种相对全面准确的方法。因此,本文将顶点高差标记法应用到六边形DEM格网结构中,为正六边形规则格网DEM提出了一种等高线生成算法,并对正六边形格网DEM的数据质量进行评价和分析。首先,本文利用生成等高线拓扑正确性、与原始等高线贴合度以及弯曲特征保持情况3个指标以评价六边形格网结构下的基于顶点高差标记法所追踪的等高线,其具有无自相交等拓扑错误、与原始等高线贴合度高、弯曲特征保持情况良好等特点,证明了该算法的可行性。此外,本文将该生成方法应用到不同规则格网DEM质量对比中,即基于顶点高差标记方法分别生成四边形DEM和六边形DEM的等高线,并基于上述3个指标对比六边形DEM和四边形DEM生成等高线的质量,从而进行六边形DEM和四边形DEM的质量差异比较,实验比较表明,在相同分辨率下,六边形DEM回放的等高线与原始等高线的贴合度更高,弯曲特征保持情况更好,并且随着分辨率的降低,其贴合度降低幅度较小,弯曲特征丧失较少,并未出现尖角化、形状过度变形等情况,因此六边形DEM的质量优于四边形DEM,并且随着分辨率降低,六边形DEM的精度折损程度更小。
肖坤 , 艾廷华 , 王璐 . 正六边形格网DEM下的等高线生成算法及质量评价[J]. 地球信息科学学报, 2022 , 24(4) : 643 -656 . DOI: 10.12082/dqxxkx.2022.210405
Due to the advantages of isotropy, adjacency equivalence, and high fitting accuracy, regular hexagonal grid is used as the grid unit of regular grid DEM data structure and has been applied to digital terrain analysis such as flow direction analysis and valley line extraction. However, its quality detection and evaluation has not been well studied, and the quality of DEM directly affects the correctness and reliability of subsequent data analysis results and related decisions. Conventional methods such as checkpoint method and profile method can only evaluate the error of DEM locally, and cannot comprehensively evaluate the quality of DEM. Contour lines can reflect the overall situation of topography. Therefore, contour playback method is a relatively comprehensive and accurate method to evaluate the quality of DEM by analyzing the quality of playback contour lines and then detecting and evaluating the quality of DEM. Therefore, this paper applies the vertex height difference marking method to the grid structure of hexagonal DEM, proposes a contour generation algorithm for regular hexagonal grid DEM, and evaluates and analyzes the data quality of regular hexagonal grid DEM. Firstly, this paper uses three indexes: the topological correctness of the generated contour, the fit with the original contour, and the maintenance of bending features to evaluate the contour tracked by the vertex height difference marking method under the hexagonal grid structure. It has no topological errors such as self-intersection, fits well with the original contour, and maintains the bending features well, which proves the feasibility of the algorithm. In addition, this generation method is applied to the quality comparison of DEM with different regular grids, that is, the contour lines of quadrilateral DEM and hexagonal DEM are generated respectively based on the vertex height difference marking method, and the quality of contour lines generated by hexagonal DEM and quadrilateral DEM is compared based on the above three indexes, so as to compare the quality difference between hexagonal DEM and quadrilateral DEM. The experimental comparison shows that under the same resolution, the contour played back by hexagonal DEM has a higher fit with the original contour, and the bending feature is maintained better, and with the decrease of resolution, the decrease of fit is smaller, the loss of bending feature is less, there is no sharp angle, excessive shape deformation, etc. Therefore, the quality of hexagonal DEM is better than that of quadrilateral DEM, and with the decrease of resolution, the accuracy loss of hexagonal DEM is smaller.
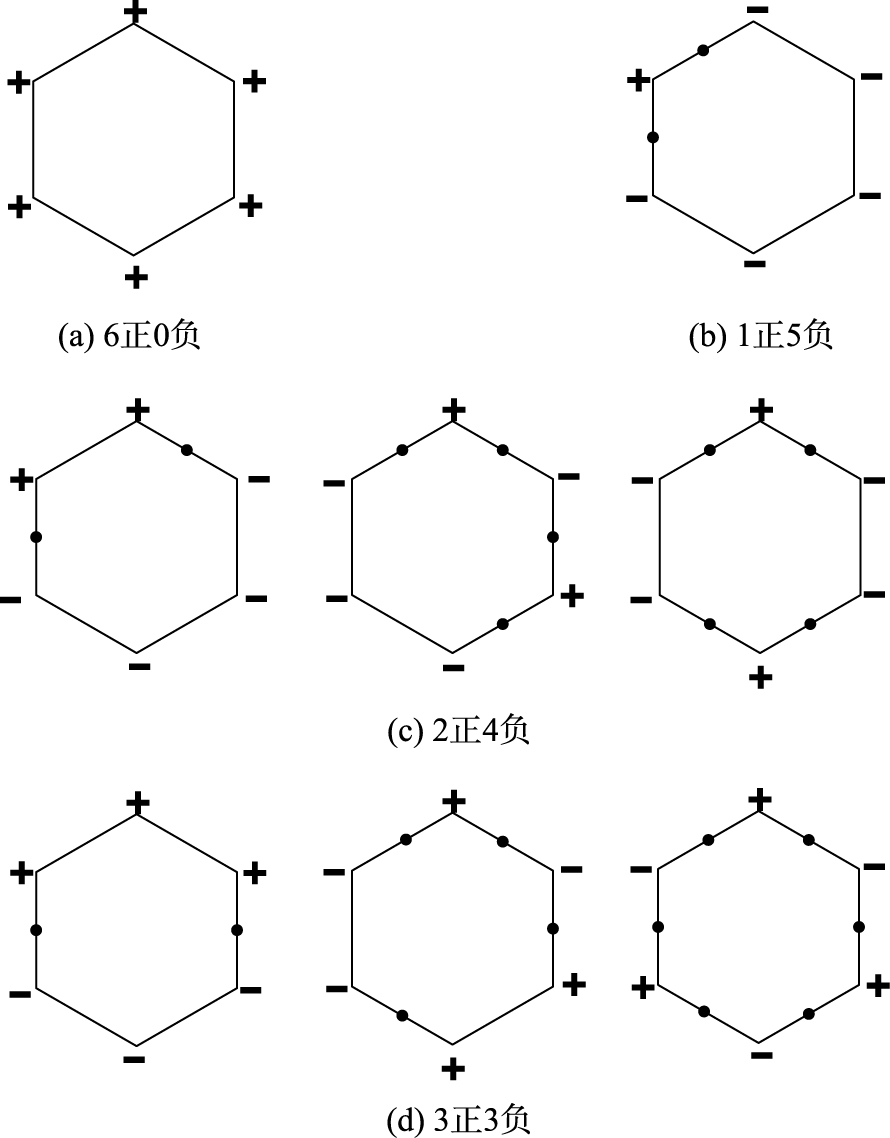
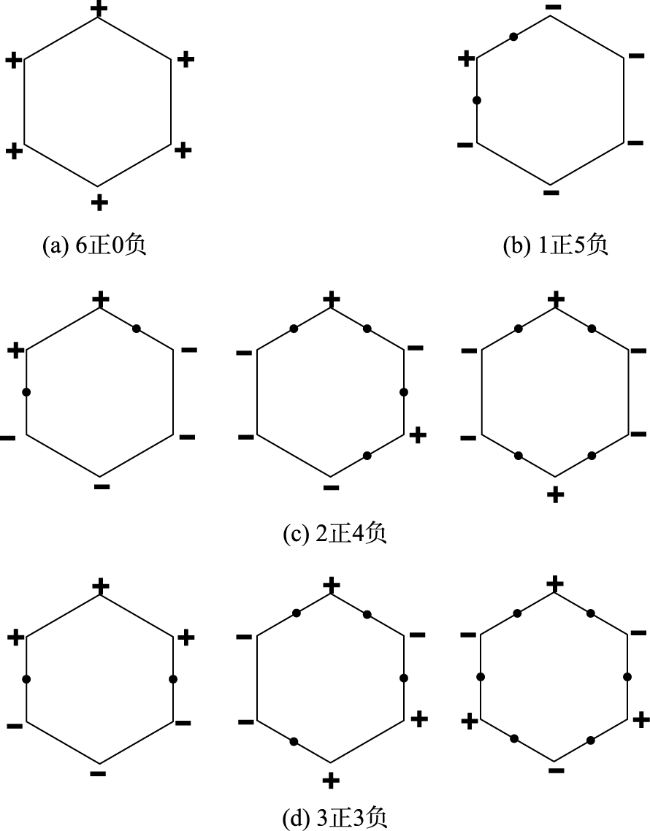
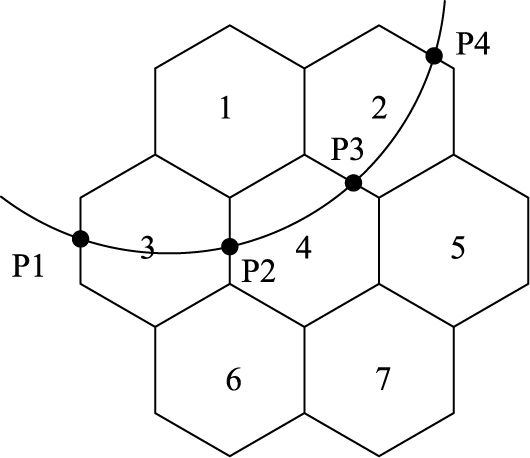
表1 六边形DEM等值点存在情况Tab. 1 The existence of hexagon DEM equivalent points |
| 顶点高差标记情况 | 等值点可能存在个数/个 |
|---|---|
| 情况① 6正0负/6负0正 | 0 |
| 情况② 1正5负/1负5正 | 2 |
| 情况③ 2正4负/2负4正 | 2/4 |
| 情况④ 3正3负 | 2/4/6 |
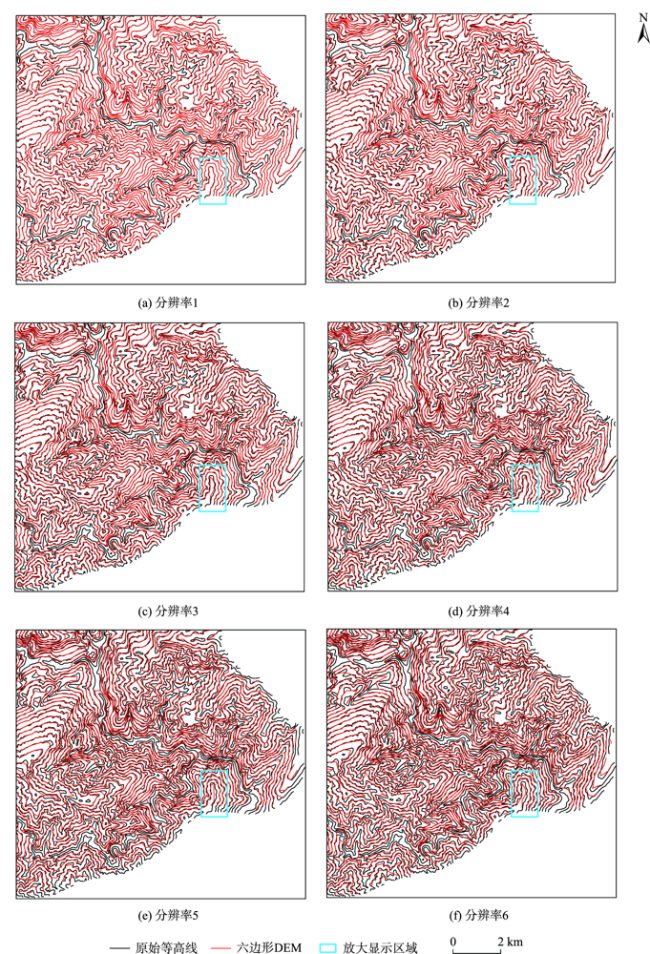
表2 6种分辨率下2种DEM格网边长对比Tab. 2 Comparison of grid side length of two kinds of DEM under six resolutions |
| 分辨率编号 | 格网单元边长/m | |
|---|---|---|
| 六边形 | 四边形 | |
| 1 | 50.0 | 46.5 |
| 2 | 100.0 | 93.0 |
| 3 | 150.0 | 139.5 |
| 4 | 200.0 | 186.0 |
| 5 | 250.0 | 232.5 |
| 6 | 300.0 | 279.0 |
表3 6种分辨率下六边形DEM生成的等高线平均偏移量Tab. 3 Average offset of contour lines generated by hexagon DEM at six resolutions |
| 分辨率编号 | 1 | 2 | 3 | 4 | 5 | 6 |
|---|---|---|---|---|---|---|
| 平均偏移量/m | 6.68 | 8.84 | 11.02 | 12.84 | 14.45 | 16.44 |
| [1] |
汤国安, 龚健雅, 陈正江, 等. 数字高程模型地形描述精度量化模拟研究[J]. 测绘学报, 2001,30(4):361-365.
[
|
| [2] |
胡鹏, 黄杏元, 华一新. 地理信息系统教程[M]. 武汉: 武汉大学出版社, 2002.
[
|
| [3] |
|
| [4] |
|
| [5] |
|
| [6] |
|
| [7] |
|
| [8] |
林辉, 彭长辉. 地理信息系统中栅格单元大小和形状的选择[J]. 遥感信息, 2001(1):21-23.
[
|
| [9] |
|
| [10] |
|
| [11] |
王璐, 艾廷华. 正六边形规则格网表达的DEM谷地线提取[J]. 测绘学报, 2019,48(6):780-790.
[
|
| [12] |
|
| [13] |
|
| [14] |
|
| [15] |
汤国安, 刘学军, 闾国年. 数字高程模型及地学分析的原理与方法[M]. 北京: 科学出版社, 2005.
[
|
| [16] |
|
| [17] |
肖雁峰. DEM质量检查与精度评定研究[D]. 成都:西南交通大学, 2008.
[
|
| [18] |
|
| [19] |
|
| [20] |
王涛, 毋河海, 刘纪平. 基于区间树索引的等高线提取算法[J]. 武汉大学学报·信息科学版, 2007,32(2):131-134.
[
|
| [21] |
|
| [22] |
张显全, 刘忠平. 基于格网模型的等高线算法[J]. 计算机科学, 2005,32(9):199-201.
[
|
| [23] |
王欢, 王峰. 基于格网DEM生成等高线算法的一种改进[C]. 创新与发展高校gis论坛.中国地理信息系统协会, 2006:349-352.
[
|
| [24] |
|
/
| 〈 |
|
〉 |