
结合“珞珈一号”夜间灯光与城市功能分区的广州市碳排放空间分布模拟及其影响因素分析
|
卢奕帆(1998— ),女,广东潮州人,硕士生,主要从事资源环境与遥感应用研究。E-mail: 2112101083@e.gzhu.edu.cn |
收稿日期: 2021-11-15
修回日期: 2021-12-01
网络出版日期: 2022-08-25
基金资助
国家自然科学基金项目(41801307)
国家自然科学基金项目(42007406)
广州市科技计划项目(202102020666)
Spatialization of Carbon Emissions in Guangzhou City by Combining Luojia1-01 Nighttime Light and Urban Functional Zoning Data
Received date: 2021-11-15
Revised date: 2021-12-01
Online published: 2022-08-25
Supported by
National Natural Science Foundation of China(41801307)
National Natural Science Foundation of China(42007406)
Guangzhou Science and Technology Plan Project(202102020666)
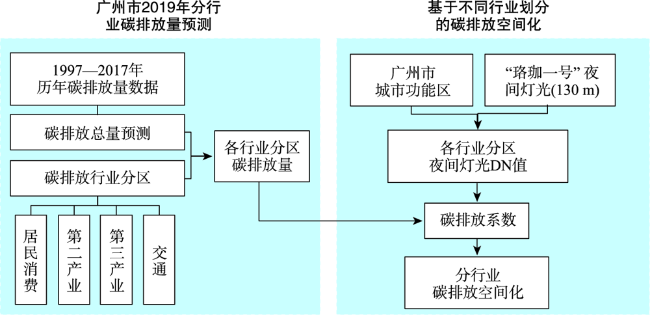
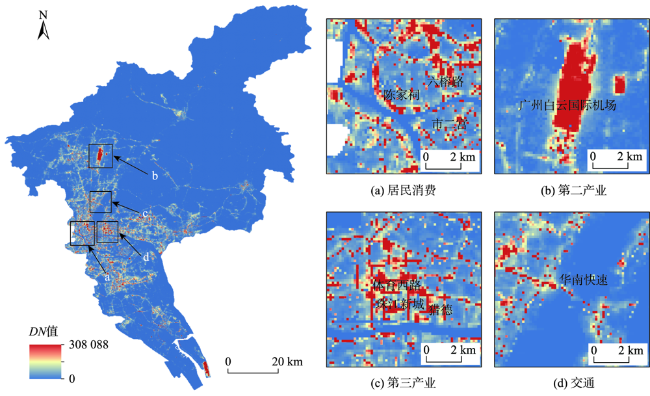
合理模拟城市内部的碳排放空间分布情况,是制定清晰明确的碳减排政策的重要前提。由于以往相关研究所用数据分辨率较低,且未考虑行业差异,因此所得结果较难精细地反映碳排放空间分布特征。为解决以上不足,本文提出一种更为合理的碳排放空间分布模拟方法。首先利用时间序列法预测2019年广州市各行业碳排放量;然后结合“珞珈一号”夜间灯光及城市功能分区数据,在精细尺度下实现分行业的碳排放空间化;在此基础上进行空间自相关分析,揭示广州市碳排放空间分布规律;最后采用随机森林模型分析影响广州市分行业碳排放的社会经济驱动因素。结果表明:① 广州市碳排放量在2011年后呈缓慢增长趋势,2019年碳排放量达83.12百万吨,其主要贡献来源为交通行业;② 与常用的ODIAC(1 km)、EDGAR(10 km)碳排放产品及基于NPP-VIIRS的碳排放空间化结果(500 m)相比,结合高分辨率(130 m)夜间灯光数据以及城市功能分区实现的碳排放空间化结果可以在更精细的尺度上呈现区域内部的空间碳排放差异;③ 广州市碳排放呈显著的全局空间正相关,形成了以第二和第三产业集中区域为依托的高高聚集区;④ 广州市2019年第二产业碳排放的主要影响因素是一般公共预算收入、第二产业GDP、一般公共预算支出、固定资产投资额;第三产业碳排放的主要影响因素是社会消费品零售额、第三产业GDP、各个行政区总GDP以及人口数量。综上,本研究从城市内部行业结构差异出发,结合高分辨率的夜间灯光数据,展现区域内部的碳排放分布格局,所得结果将有利于相关部门制定精准的碳减排和产业优化升级策略。

卢奕帆 , 梁颖然 , 卢思言 , 肖钺 , 何小钰 , 林锦耀 . 结合“珞珈一号”夜间灯光与城市功能分区的广州市碳排放空间分布模拟及其影响因素分析[J]. 地球信息科学学报, 2022 , 24(6) : 1176 -1188 . DOI: 10.12082/dqxxkx.2022.210610
A reasonable spatialization of urban carbon emissions is an important prerequisite for formulating clear carbon emission reduction policies. However, previous studies relied heavily on the nighttime light data with coarse spatial resolution and did not consider the huge differences of carbon emissions between various industry sectors. Therefore, the corresponding results cannot accurately reflect the spatial distribution of carbon emissions. To solve the disadvantages of previous methods, this study proposed a more reasonable method for the spatialization of carbon emissions. Firstly, three statistical models were used to estimate the carbon emissions of various industry sectors for Guangzhou in 2019. Next, the spatial distribution of carbon emissions was simulated based on the combined use of Luojia1-01 nighttime light and urban functional zoning data. Based on the spatialization result, both the global and local spatial autocorrelation analyses were carried out to reveal the spatial characteristics of carbon emissions in Guangzhou. Finally, the random forest model was used to investigate the socio-economic driving factors behind the carbon emissions in Guangzhou. The results are summarized as follows: (1) Although the carbon emissions of Guangzhou increased slowly after 2011, the total emission volume still reached 83.12 million tons in 2019, in which the transportation sector played a dominant role; (2) Compared with the commonly-used ODIAC (1 km), EDGAR (10 km) carbon emission products and the carbon emission spatialization results based on NPP-VIIRS (500 m), the result generated by high resolution (130 m) nighttime light and urban functional zoning data can more accurately characterize the spatial differences of carbon emissions; (3) There was a significant positive global spatial autocorrelation of carbon emissions in Guangzhou, resulting in highly concentration areas of secondary and tertiary sectors; (4) The main influencing factors for the secondary sector's carbon emissions were public budget revenue, GDP of the secondary sector, public budget expenditure, and fixed asset investment. In comparison, the major contributors to the tertiary sector's emissions were retail sales of consumer goods, GDP of the tertiary sector, GDP per district, and population. In summary, this study carefully considers the differences in industry structure, and then utilizes the high-resolution nighttime light data to investigate the distribution pattern of carbon emissions. The results will be helpful for policy-makers to formulate reasonable carbon emission reduction and industrial optimization strategies.
表1 本研究所需数据及其来源Tab. 1 Data and sources for this study |
| 数据 | 时间 | 来源 |
|---|---|---|
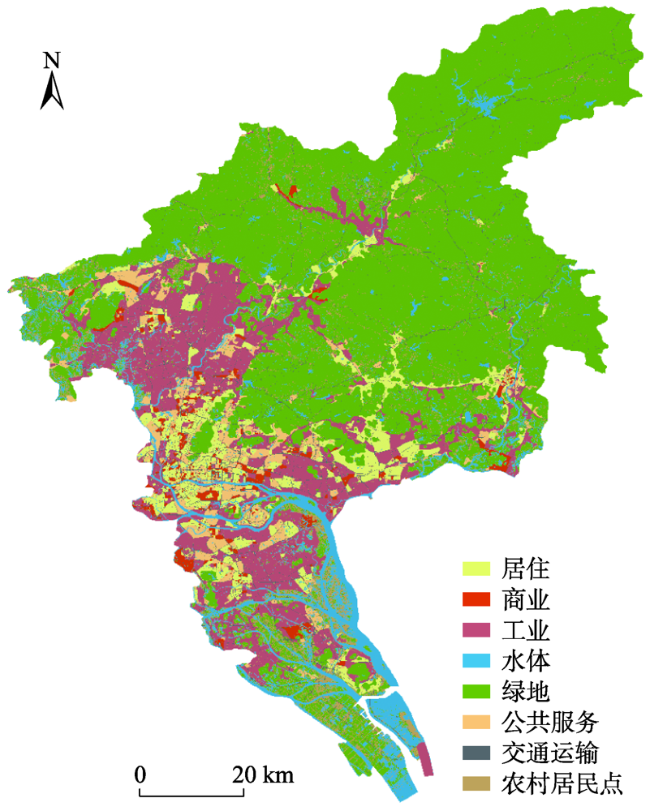
| 城市功能分区[25] | 2019年 | 清华大学地球系统科学系 |
| “珞珈一号”夜间灯光[26] | 2018年 | 武汉大学测绘遥感信息 工程国家重点实验室 |
| NPP-VIIRS夜间灯光数据 | 2019年 | 美国国家海洋和大气管理局 |
| 广州市碳排放总量 | 1997—2017年 | 中国碳核算数据库 |
| 广州市各行业碳排放量比例 | 2019年 | 《广州市碳排放达峰和“十四五”低碳发展战略路径研究》报告 |
| ODIAC碳排放产品 | 2019年 | Open-source Data Inventory for Anthropogenic CO2 Emissions Database for Global Atmospheric Research |
| EDGAR碳排放产品 | 2019年 | |
| 各行政区的社会经济指标 | 2019 | 广州市统计局 |
表2 广州市2019年分行业碳排放预测Tab. 2 Carbon emissions forecast of various industry sectors for Guangzhou in 2019 |
| 居民生活消费 | 第一产业 | 第二产业 | 第三产业(不含交通) | 交通 | |
|---|---|---|---|---|---|
| 产业碳排放结构/% | 15.4 | 0.6 | 41.2 | 5.8 | 37.0 |
| 分产业碳排放量/百万吨 | 12.8003 | 0.4987 | 34.2450 | 4.7943 | 30.7806 |
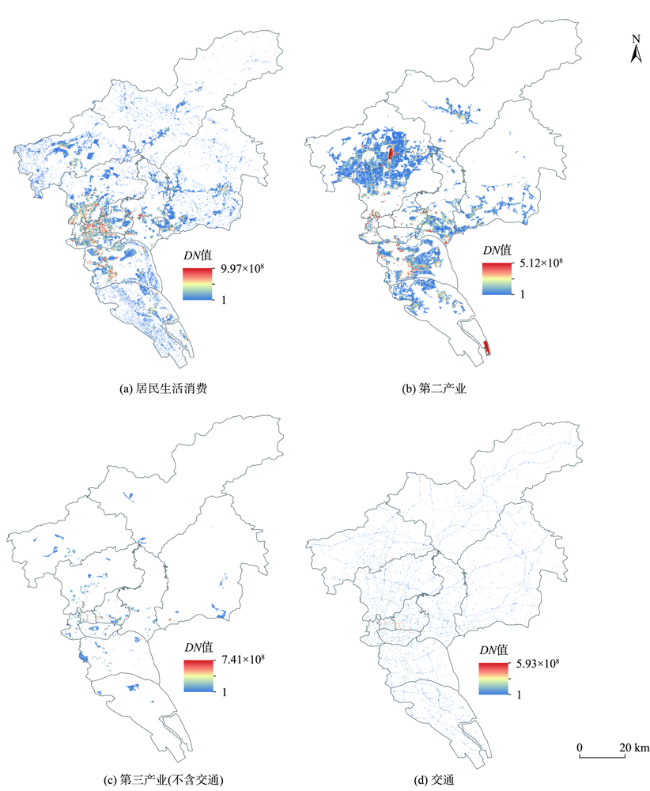
图3 2018年广州市夜间灯光数据分区结果Fig. 3 Partition of the nighttime light data based on urban functional zoning for Guangzhou in 2018 |
表3 广州市2019年各行业碳排放系数Tab. 3 Carbon emission coefficients of various industry sectors for Guangzhou in 2019 |
| 行业分区 | 灯光碳排放系数(t碳/单位DN值) |
|---|---|
| 居民生活消费 | 0.45×10⁻⁴ |
| 第二产业 | 1.36×10⁻⁴ |
| 第三产业(不含交通) | 0.80×10⁻⁴ |
| 交通 | 5.20×10⁻⁴ |
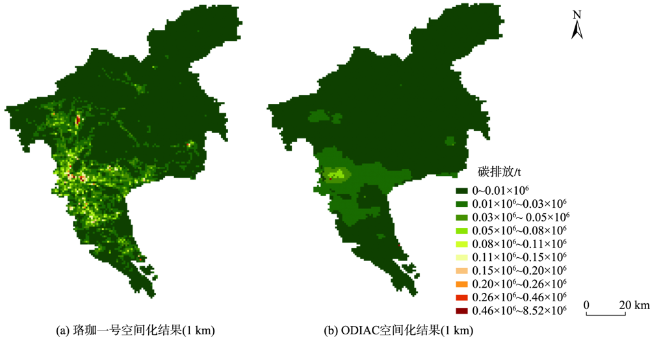
图5 广州分行业碳排放空间分布模拟结果与ODIAC产品结果对比Fig. 5 Comparison between our result and the result of ODIAC products in Guangzhou |
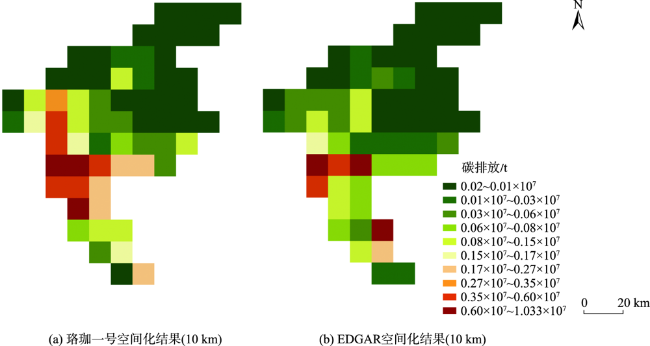
图6 广州分行业碳排放空间分布模拟结果与EDGAR产品结果对比Fig. 6 Comparison between our result and the result of EDGAR products in Guangzhou |
表4 第二、三产业碳排放影响因素重要性Tab. 4 Importance of the driving factors behind carbon emissions of the secondary and tertiary industry sectors |
| 影响因素 | 第二产业碳排放影响因素重要性(排序) | 第三产业碳排放影响因素重要性(排序) |
|---|---|---|
| 一般公共预算收入 | 4.32(1) | 0.55(8) |
| 一般公共预算支出 | 2.64(3) | 1.41(5) |
| 总GDP | 0.79(8) | 2.07(3) |
| 产业GDP | 3.74(2) | 2.69(2) |
| 城镇化率 | 1.40(5) | 0.50(9) |
| 固定资产投资额 | 2.34(4) | 1.07(6) |
| 消费品零售总额 | 1.40(6) | 4.36(1) |
| 常住人口密度 | 1.10(7) | 0.82(7) |
| 常住人口数量 | 0.40(9) | 1.76(4) |
| [1] |
邓祥征, 蒋思坚, 刘冰, 等. 全球二氧化碳浓度非均匀分布条件下碳排放与升温关系的统计分析[J]. 自然资源学报, 2021, 36(4):934-947.
[
|
| [2] |
张永年, 潘竟虎. 基于Dmsp/Ols数据的中国碳排放时空模拟与分异格局[J]. 中国环境科学, 2019, 39(4):1436-1446.
[
|
| [3] |
|
| [4] |
邓祥征, 丹利, 叶谦, 等. 碳排放和减碳的社会经济代价研究进展与方法探究[J]. 地球信息科学学报, 2018, 20(4):405-413.
[
|
| [5] |
蔡博峰, 王金南. 基于1km网格的天津市二氧化碳排放研究[J]. 环境科学学报, 2013, 33(6):1655-1664.
[
|
| [6] |
|
| [7] |
|
| [8] |
|
| [9] |
郭忻怡, 闫庆武, 谭晓悦, 等. 基于Dmsp/Ols与Ndvi的江苏省碳排放空间分布模拟[J]. 世界地理研究, 2016, 25(4):102-110.
[
|
| [10] |
武娜, 沈镭, 钟帅. 基于夜间灯光数据的晋陕蒙能源消费碳排放时空格局[J]. 地球信息科学学报, 2019, 21(7):1040-1050.
[
|
| [11] |
余柏蒗, 王丛笑, 宫文康, 等. 夜间灯光遥感与城市问题研究:数据、方法、应用和展望[J]. 遥感学报, 2021, 25(1):342-364.
[
|
| [12] |
李建豹, 黄贤金, 孙树臣, 等. 长三角地区城市土地与能源消费CO2排放的时空耦合分析[J]. 地理研究, 2019, 38(9):2188-2201.
[
|
| [13] |
王少剑, 苏泳娴, 赵亚博. 中国城市能源消费碳排放的区域差异、空间溢出效应及影响因素[J]. 地理学报, 2018, 73(3):414-428.
[
|
| [14] |
|
| [15] |
|
| [16] |
|
| [17] |
苏泳娴, 陈修治, 叶玉瑶, 等. 基于夜间灯光数据的中国能源消费碳排放特征及机理[J]. 地理学报, 2013, 68(11):1513-1526.
[
|
| [18] |
|
| [19] |
于博, 杨旭, 吴相利. 哈长城市群县域碳排放空间溢出效应及影响因素研究--基于Npp-Viirs夜间灯光数据的实证[J]. 环境科学学报, 2020, 40(2):697-706.
[
|
| [20] |
牛亚文, 赵先超, 胡艺觉. 基于Npp-Viirs夜间灯光的长株潭地区县域土地利用碳排放空间分异研究[J]. 环境科学学报, 2021, 41(9):3847-3856.
[
|
| [21] |
|
| [22] |
|
| [23] |
吴健生, 牛妍, 彭建, 等. 基于DMSP/OLS夜间灯光数据的1995-2009年中国地级市能源消费动态[J]. 地理研究, 2014, 33(4):625-634.
[
|
| [24] |
唐建荣, 陈实. 基于随机森林方法的碳足迹及其影响因素研究[J]. 统计与信息论坛, 2013, 28(10):70-74.
[
|
| [25] |
|
| [26] |
李德仁, 张过, 沈欣, 等. 珞珈一号01星夜光遥感设计与处理[J]. 遥感学报, 2019, 23(6):1011-1022.
[
|
| [27] |
|
| [28] |
杜海波, 魏伟, 张学渊, 等. 黄河流域能源消费碳排放时空格局演变及影响因素--基于DMSP/OLS与NPP/VIIRS夜间灯光数据[J]. 地理研究, 2021, 40(7):2051-2065.
[
|
| [29] |
李建豹, 黄贤金, 揣小伟, 等. 江苏省人口城镇化与能源消费CO2排放耦合协调度时空格局及影响因素[J]. 经济地理, 2021, 41(5):57-64.
[
|
| [30] |
张雨欣, 李熙, 宋杨, 等. 基于“珞珈一号”夜光遥感影像的粤港澳大湾区城市空间形态分析[J]. 应用科学学报, 2020, 38(3):466-477.
[
|
| [31] |
林中立, 徐涵秋, 林丛华, 等. 基于珞珈一号夜间灯光数据的福建省人为热通量估算[J/OL]. 遥感学报, 2021.
[
|
| [32] |
廖翠萍. 广州市碳排放达峰和“十四五”低碳发展战略路径研究[R]. 广州: 中国能源研究会能源系统工程专业委员会, 2020.
[
|
| [33] |
杨莉, 张雪磊. 江苏居民消费碳排放测度与影响因素研究--基于GTWR模型的实证分析[J]. 生态经济, 2020, 36(5):31-38.
[
|
| [34] |
范建双, 虞晓芬, 周琳. 南京市土地利用结构碳排放效率增长及其空间相关性[J]. 地理研究, 2018, 37(11):2177-2192.
[
|
| [35] |
|
| [36] |
邢晓语, 杨秀春, 徐斌, 等. 基于随机森林算法的草原地上生物量遥感估算方法研究[J]. 地球信息科学学报, 2021, 23(7):1312-1324.
[
|
/
| 〈 |
|
〉 |