
时空Moran散点图及其在中国干旱时空聚集区识别中的应用
|
王 峥(1999— ),女,河北廊坊人,博士生,主要从事灾害数据及方法分析相关研究。E-mail: 202131051043@mail.bnu.edu.cn |
收稿日期: 2021-10-15
修回日期: 2021-12-27
网络出版日期: 2022-09-25
基金资助
国家重点研发计划重点专项(2019YFA0606901)
Spatio-temporal Moran Scatter Plot and its Application in Identifying Drought Spatio-temporal Aggregation Areas in China
Received date: 2021-10-15
Revised date: 2021-12-27
Online published: 2022-09-25
Supported by
National Key Research and Development Program in China(2019YFA0606901)
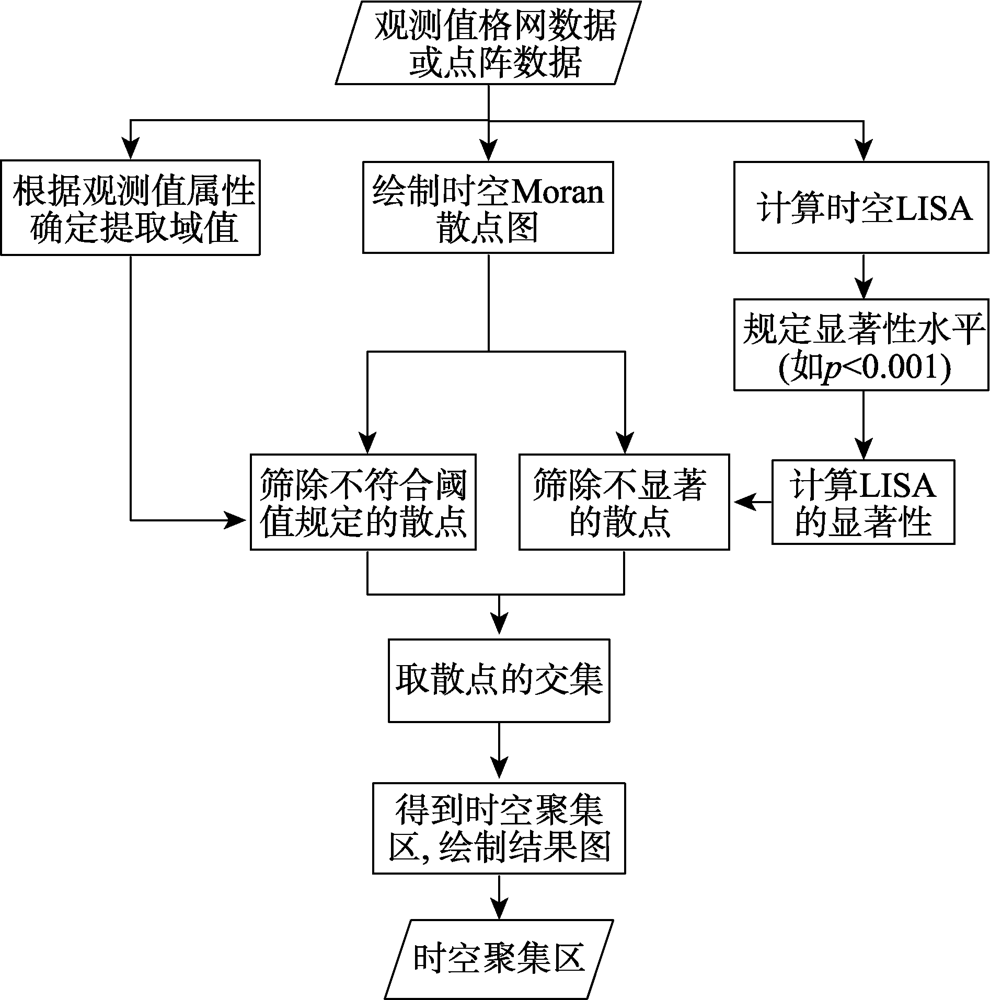
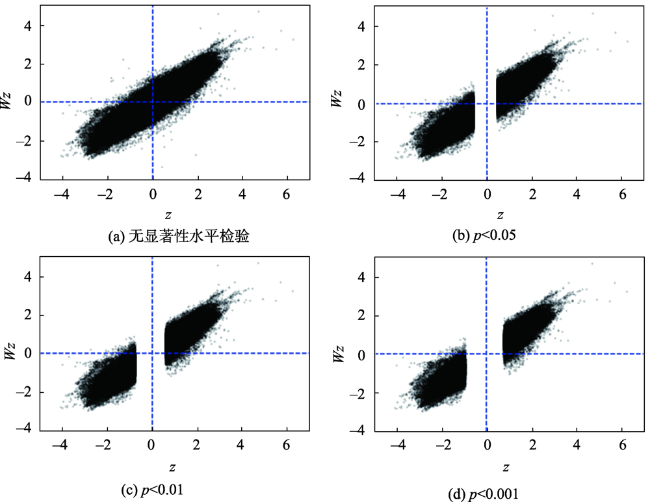
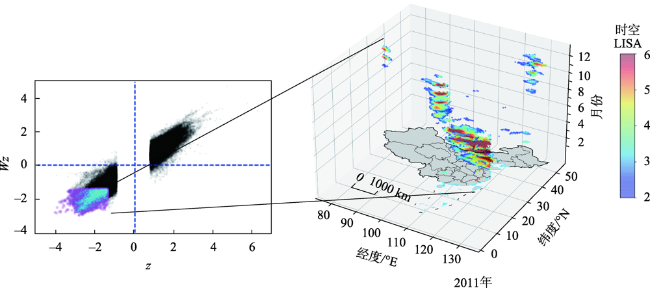
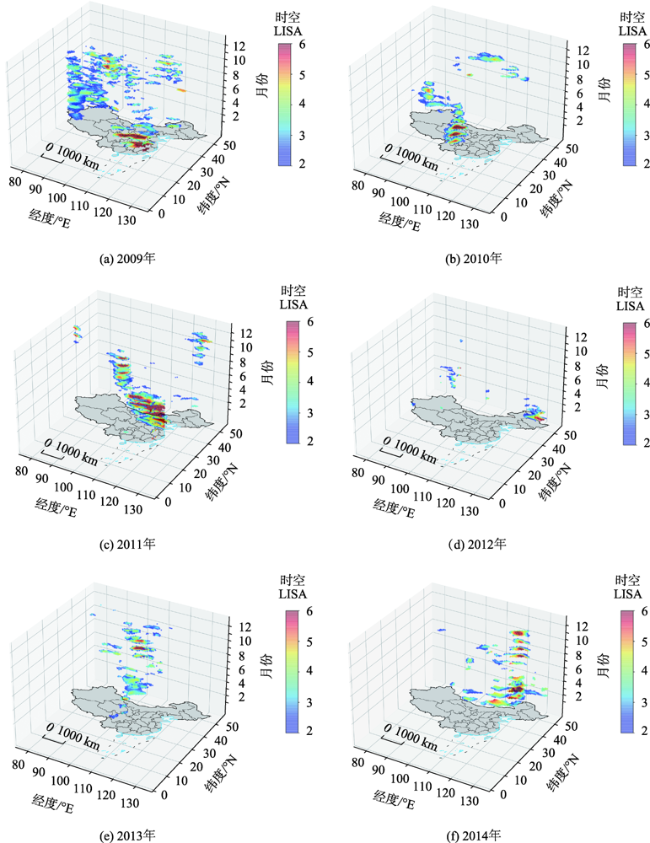
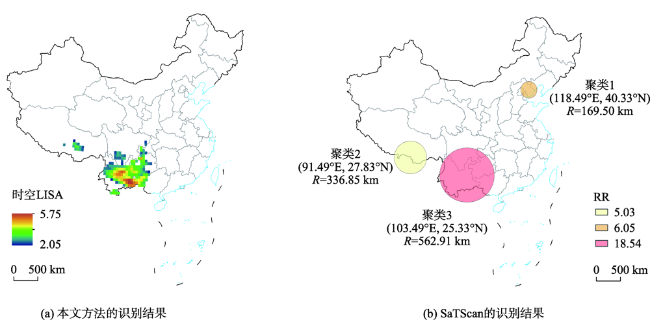
干旱灾害给整个自然灾害体系带来的经济损失最为严重,也是目前检测难度较高的自然灾害之一。SaTScan在灾害时空聚集区的识别中已有应用,但其存在参数设定困难、识别区域不够精确等问题。本文对Moran散点图和局部空间关联指标(Local Indicators of Spatial Association, LISA)进行时空扩展,提出了一种时空Moran散点图的方法,根据研究者对关注现象阈值及置信程度的要求,筛选出符合条件的点,并将其绘制在对应的时空坐标系上,从而得到时空聚集区。以2009—2014年中国干旱时空聚集区识别为例,结果表明:① 时空Moran散点图识别到的干旱时空聚集区与实际基本相符,验证了方法的有效性;同时,与时空扫描法相比,该方法具有识别结果边界清晰、精确,参数设置容易等优点;② 2009年和2011年呈现大范围、较强的干旱时空聚集区,2010年和2014年出现局部、较强的干旱时空聚集,而2012年和2013年的干旱时空聚集情况较轻。综合来看,2009—2014年干旱时空聚集区主要出现在云贵川、东北、黄淮地区和长江中下游等地区。
王峥 , 程昌秀 , 李畅 . 时空Moran散点图及其在中国干旱时空聚集区识别中的应用[J]. 地球信息科学学报, 2022 , 24(7) : 1301 -1311 . DOI: 10.12082/dqxxkx.2022.210633
Drought, as one of the most difficult natural disasters to identify, causes the most serious economic losses in the entire natural disaster system. Drought in spatio-temporal aggregation areas deserves more attention than its changes and patterns because it usually causes greater damages. SaTScan provides a method for identifying spatio-temporal aggregation areas of disaster. However, there are also some defects, such as difficulty in parameter setting and inefficiency in boundary identification. For instance, the maximum scanning window in SaTScan needs to take many attempts to get a fine result. Moran scatter plot provides a method for the identification of spatio aggregation areas, which could solve problems that SaTScan faces above, but it could only identify aggregation areas in space. In this study, we proposed a method named Spatio-temporal Moran Scatter Plot based on Moran scatter plot and Local Indicators of Association (LISA), which could select scatters according to the threshold of concerned phenomenon and the LISA confidence level required by the researcher. This method plotted scatters in spatio-temporal coordinate system to get the spatio-temporal aggregation areas. This study took droughts in China from 2009—2014 as an example to identify the spatio-temporal aggregation areas, the results showed that:(1) Spatio-temporal drought aggregation areas identified by the proposed method were almost consistent with the truth, which demonstrated the effectiveness of the method. Besides, compared with the spatio-temporal scanning method, the method proposed in this study was not only easier in parameters setting but also clearer and more accurate in boundary identification; (2) The large-scale, strong drought spatio-temporal aggregation areas occurred in 2009 and 2011. In 2009, the main aggregation areas concentrated in Shanxi, Shaanxi, Beijing-Tianjin-Hebei, eastern Tibet, northeastern Inner Mongolia, Liaoning, Jilin, and Yunnan-Guizhou-Sichuan area; in 2011, the main aggregation areas concentrated in Huanghuai area, the middle and lower reaches of the Yangtze River, and Yunnan-Guizhou-Sichuan area. The local-scale, strong drought spatio-temporal aggregation areas occurred in 2010 and 2014. In 2010, the main aggregation areas concentrated in Yunnan-Guizhou-Sichuan area; in 2014, the main aggregation areas concentrated in Eastern Inner Mongolia, Liaoning, and other areas in Northeast China. The slight drought spatio-temporal aggregation areas occurred in 2012 and 2013. In 2013, some mild drought clusters occurred in western Inner Mongolia, southern Gansu, Ningxia, southern Shaanxi, and northern Henan. In general, the spatio-temporal drought aggregation areas concentrated mainly in Yunnan-Guizhou-Sichuan, Northeast China, Huanghuai Region, and the middle and lower reaches of the Yangtze River.
表1 验证数据集Tab. 1 Validation dataset |
| 编号 | 新闻来源 | 报导时间 | 发生地点 | 发生时间 | 干旱强度描述 |
|---|---|---|---|---|---|
| T_1 | 中国新闻网 | 2009年12月17日 | 山东省全境,河南、河北、山西、陕西等省大部,甘肃省东部和南部及苏北、皖北等冬小麦主产区 | 2008年11月 —2009年1月 | 秋冬连旱 |
| T_2 | 中国新闻网 | 2009年12月17日 | 西藏东部 | 2009年4—6月 中旬 | 罕见的初夏旱,但极端性不那么明显 |
| T_3 | 中国天气网 | 2009年5月30日 | 黑龙江和内蒙古东北部 | 2009年5月 | 黑龙江大部分地区降雨为1951年以来最少,气温为1951年以来最高,粮食产区受旱面积大 |
| T_4 | 中国新闻网 | 2009年12月17日 | 辽宁、吉林、内蒙古东部 | 2009年6月下旬 —11月上旬 | 严重夏秋连旱,部分地区玉米、牧草因旱干枯,人们生活和农业生产受到严重影响 |
| T_5 | 中国新闻网 | 2009年12月17日 | 湖南、江西、贵州、云南、广西、广东 | 2009年8月 —11月上旬 | 平均降水量为1951年以来历史同期第三少值,发生极端干旱事件 |
| T_6 | 中国新闻网 | 2009年12月17日 | 云南、贵州、四川等地 | 2009年11月 中旬以来 | 西南大部地区降水稀少 |
| T_7 | 中国新闻网 | 2009年12月17日 | 全国 | 2009年 | 干旱发生的频次高、范围广 |
| T_8 | 中国天气网 | 2010年11月24日 | 云南、贵州、四川南部、广西北部 | 2009年11月—2010年3月中旬 | 农业生产受灾严重、江河湖库水位明显下降、人畜饮水困难 |
| T_9 | 新华网 | 2011年5月24日 | 长江中下游地区 | 2011年1月1日 —5月23日 | 长江中下游出现较严重的旱情,农业、渔业遭受损失 |
| T_10 | 中国新闻网 | 2011年2月24日 | 山东省全境,河南、河北、山西、陕西等省大部,甘肃省东部和南部及苏北、皖北等冬小麦主产区 | 截至2011年 2月23日 | 河北、山西、江苏、安徽、山东、河南、陕西、甘肃8省冬小麦受旱面积8700多万亩,为历史同期最重 |
| T_11 | 中国天气网 | — | 云南、贵州、四川等省份 | 2011年6—9月 | 多地最高气温以及连续高温日数都破记录,居民的生活和生产受到严重影响 |
| T_12 | 中国科技网 | 2012年12月28日 | 云南 | 2012年初— 2012年2月5日 | 云南已经持续三年连旱 |
| T_13 | 新华网 | 2014年1月13日 | 西南、西北 | 2013年冬、春季 | 冬春旱 |
| T_14 | 新华网 | 2014年1月13日 | 华北、黄淮 | 2013年秋季 | 秋旱 |
| T_15 | 新华网 | 2014年1月13日 | 全国 | 2013年 | 全国旱情总体偏轻 |
| T_16 | 内蒙古新闻 | 2014年7月28日 | 内蒙古 | 2014年4月初— 7月末 | 相关部门认为今年的旱情是近三年来最严重的一年 |
| T_17 | 北京晨报 | 2014年8月14日 | 辽宁 | 2014年7月— 8月12日 | 遭受63年来最严重的气象干旱 |
| T_18 | 中国新闻网 | 2014年12月25日 | 北方 | 2014年 | 灾害总体偏轻但局部较重,辽宁、河南、内蒙古受灾较重 |
| T_19 | 新华网 | 2012年4月14日 | 黑龙江 | 2011年8月— 2012年春季 | 2011年8月以来全省平均降水量为1957年以来同期少水第二位,2012年春季土壤干旱程度为近10年最严重 |
| T_20 | 中国气象局新闻发布会 | 2013年11月1日 | 江南、河南、陕西等 | 2013年9月底 开始,11月1日 仍持续 | 中到重度气象干旱 |
图5 2009—2014年干旱时空聚集区分布(p<0.001)注:该图基于自然资源部标准地图服务网站下载的审图号为GS(2019)1719号的标准地图制作,底图无修改。 Fig. 5 Distribution of drought spatio-temporal aggregation areas(p<0.001) |
表2 14个典型的干旱时空聚集区Tab. 2 Fourteen typical drought spatio-temporal aggregation areas |
| 编号 | 发生时间 | 持续时间/月 | 发生地点 | 严重程度 |
|---|---|---|---|---|
| R_1 | 2009年1—2月 | 2 | 山西、陕西、京津冀一带 | 重 |
| R_2 | 2009年4—6月 | 2 | 西藏东部 | 一般 |
| R_3 | 2009年5月 | 1 | 内蒙古东北部 | 重 |
| R_4 | 2009年6—11月 | 6 | 内蒙古东部、辽宁、吉林 | 重 |
| R_5 | 2009年11—2010年4月 | 6 | 云、贵、川地区 | 重 |
| R_6 | 2011年1—5月 | 5 | 长江中下游地区 | 重 |
| R_7 | 2011年1—4月 | 4 | 以山东、河南为中心的黄淮地区 | 重 |
| R_8 | 2011年7—10月 | 4 | 云、贵、川地区 | 重 |
| R_9 | 2011年8—2012年2月 | 6 | 黑龙江 | 重 |
| R_10 | 2013年3—4月 | 2 | 内蒙古西部、甘肃南部、宁夏 | 一般 |
| R_11 | 2013年9—2013年11月 | 3 | 陕西南部和河南北部 | 一般 |
| R_12 | 2014年2—2014年5月 | 4 | 内蒙古和东北地区 | 重 |
| R_13 | 2014年8—9月 | 2 | 辽宁和内蒙古东部 | 重 |
| R_14 | 2014年10—2014年11月 | 2 | 辽宁南部 | 重 |
表3 2009—2014年相关干旱报道与聚集区时空符合程度Tab. 3 Spatio-temporal correlation between drought reports in 2009—2014 and aggregation areas |
| 验证数据编号 | 对应的结果编号 | 空间符合程度 | 时间符合程度 |
|---|---|---|---|
| T_1 | R_1 | 完全一致 | 完全一致 |
| T_2 | R_2 | 完全一致 | 完全一致 |
| T_3 | R_3 | 一半符合 | 完全一致 |
| T_4 | R_4 | 完全一致 | 完全一致 |
| T_5 | R_5 | 完全一致 | 完全一致 |
| T_6 | R_5 | 少许偏差 | 完全一致 |
| T_7 | R_1、R_2、R_3、R_4、R_5 | 完全一致 | 完全一致 |
| T_8 | R_5 | 少许偏差 | 完全一致 |
| T_9 | R_6 | 完全一致 | 完全一致 |
| T_10 | R_7 | 完全一致 | 完全一致 |
| T_11 | R_8 | 完全一致 | 少许偏差 |
| T_12 | — | 不符合 | 不符合 |
| T_13 | R_10 | 完全一致 | 完全一致 |
| T_14 | R_11 | 完全一致 | 少许偏差 |
| T_15 | R_10、R_11 | 完全一致 | 完全一致 |
| T_16 | — | 不符合 | 不符合 |
| T_17 | R_13 | 完全一致 | 完全一致 |
| T_18 | R_12、R_13、R_14 | 完全一致 | 完全一致 |
| T_19 | R_9 | 完全一致 | 完全一致 |
| T_20 | R_11 | 少许偏差 | 完全一致 |
注:-表示在结果数据集中没有找到对应的验证数据。 |
| [1] |
王浩. 综合应对中国干旱的几点思考[J]. 中国水利, 2010(8):2-4,6.
[
|
| [2] |
程昌秀, 史培军, 宋长青, 等. 地理大数据为地理复杂性研究提供新机遇[J]. 地理学报, 2018, 73(8):1397-1406.
[
|
| [3] |
程昌秀, 沈石, 李强坤. 黄河流域人地系统研究的大数据支撑与方法探索[J]. 中国科学基金, 2021, 35(4):529-536.
[
|
| [4] |
高燕俐, 刘小刚, 冷险险, 等. 基于主成分分析的广西省干旱时空格局[J]. 生态学报, 2020, 40(16):5591-5601.
[
|
| [5] |
|
| [6] |
|
| [7] |
|
| [8] |
|
| [9] |
刘牧文, 杨旭辉, 王婧, 等. 2019—2020年浙江省杭州市流感病例时空聚集性分析[J]. 疾病监测, 2021, 36(4):376-380.
[
|
| [10] |
上官致洋, 严秀英, 曹飞. 2011—2016年抚州市肺结核时空聚集特征分析[J]. 社区医学杂志, 2020, 18(23):1565-1568.
[
|
| [11] |
刘利利, 贾艳, 齐畅, 等. 基于时空统计方法分析温州市2020年1-3月新型冠状病毒肺炎的聚集性分布[J]. 山东大学学报(医学版), 2020, 58(10):82-88.
[
|
| [12] |
|
| [13] |
张婷, 程昌秀, 杨山力, 等. 时空聚集性识别方法在极端高温事件聚集分析中的应用研究[J]. 地理与地理信息科学, 2019, 35(3):51-57.
[
|
| [14] |
万幼, 周脚根, 翁敏. 点集数据不规则形状时空异常聚类模式挖掘研究[J]. 武汉大学学报·信息科学版, 2017, 42(7):924-930.
[
|
| [15] |
牟敬锋, 赵星, 樊静洁, 等. 2014—2016年深圳市空气污染时空分布特征[J]. 卫生研究, 2018, 47(2):270-276.
[
|
| [16] |
郭文杰, 秦昆, 毛宗福, 等. "一带一路"成员国居民健康状况的时空统计分析[J]. 地球信息科学学报, 2020, 22(5):229-237.
[
|
| [17] |
周明卫, 康平, 汪可可, 等. 2016—2018年中国城市臭氧浓度时空聚集变化规律[J]. 中国环境科学, 2020, 40(5):1963-1974.
[
|
| [18] |
黄婕, 高路, 陈兴伟, 等. 降水极值的非平稳性特征及其重现期研究——以福建省为例[J]. 北京师范大学学报(自然科学版), 2016, 52(5):603-609.
[
|
| [19] |
|
| [20] |
|
| [21] |
温庆志, 孙鹏, 张强, 等. 非平稳标准化降水蒸散指数构建及中国未来干旱时空格局[J]. 地理学报, 2020, 75(7):1465-1482.
[
|
| [22] |
李忆平, 李耀辉. 气象干旱指数在中国的适应性研究进展[J]. 干旱气象, 2017, 35(5):709-723.
[
|
| [23] |
李海涛, 邵泽东. 空间插值分析算法综述[J]. 计算机系统应用, 2019, 28(7):1-8.
[
|
| [24] |
|
| [25] |
|
| [26] |
|
| [27] |
白开旭, 刘朝顺, 施润和, 等. 2010年中国西南旱情的时空特征分析——基于MODIS数据归一化干旱指数[J]. 地球信息科学学报, 2012, 14(1):32-40,48.
[
|
| [28] |
段海霞, 王素萍, 冯建英. 2011年全国干旱状况及其影响与成因[J]. 干旱气象, 2012, 30(1):136-147.
[
|
| [29] |
段海霞, 王素萍, 冯建英. 2012年全国干旱状况及其影响与成因[J]. 干旱气象, 2013, 31(1):220-229.
[
|
| [30] |
段海霞, 王素萍, 冯建英. 2013年全国干旱状况及其影响与成因[J]. 干旱气象, 2014, 32(2):310-316.
[
|
| [31] |
段海霞, 王素萍, 冯建英. 2014年全国干旱状况及其影响与成因[J]. 干旱气象, 2015, 33(2):349-360.
[
|
/
| 〈 |
|
〉 |
