
基于CMIP6的中国未来高温危险性变化评估
|
郭春华(1999— ),女,陕西延安人,硕士研究生,主要从事遥感应用与自然灾害研究。E-mail: 202121051186@mail.bnu.edu.cn |
收稿日期: 2021-08-21
修回日期: 2022-01-15
网络出版日期: 2022-09-25
基金资助
国家重点研发计划项目(2019YFA0606900)
国家自然科学基金面上项目(42077436)
Hazard Changes Assessment of Future High Temperature in China based on CMIP6
Received date: 2021-08-21
Revised date: 2022-01-15
Online published: 2022-09-25
Supported by
National Key Research and Development Program of China(2019YFA0606900)
General Program of National Natural Science Foundation of China(42077436)
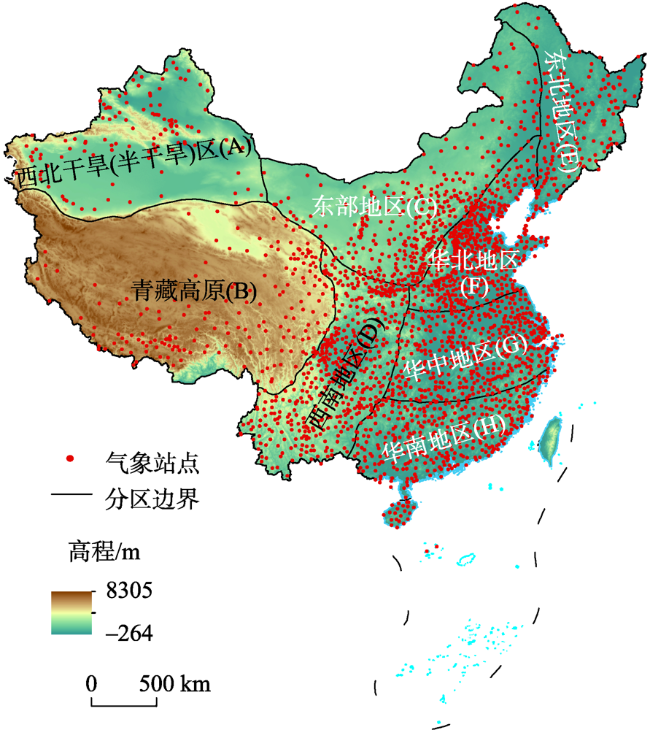
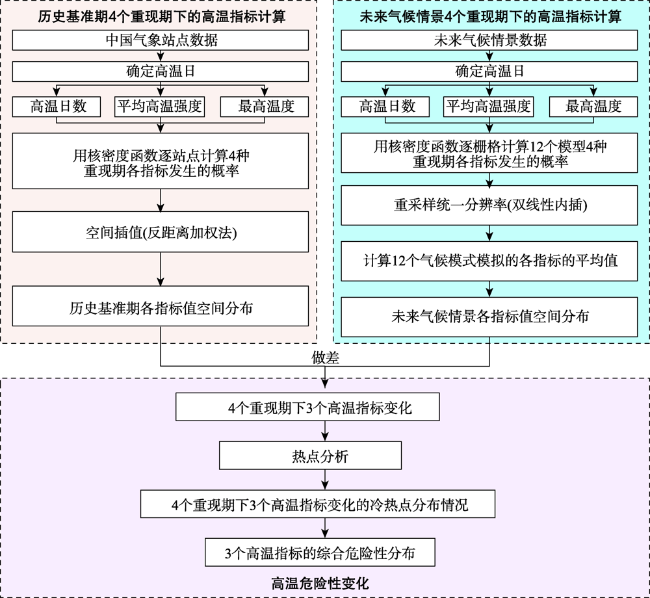
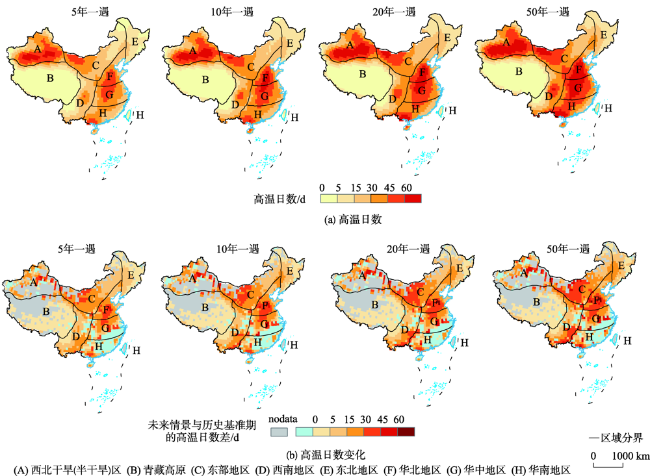
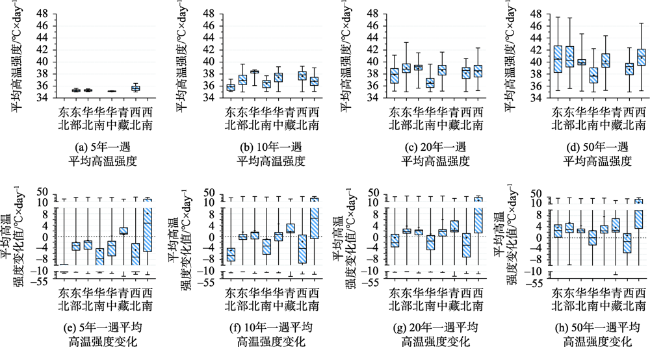
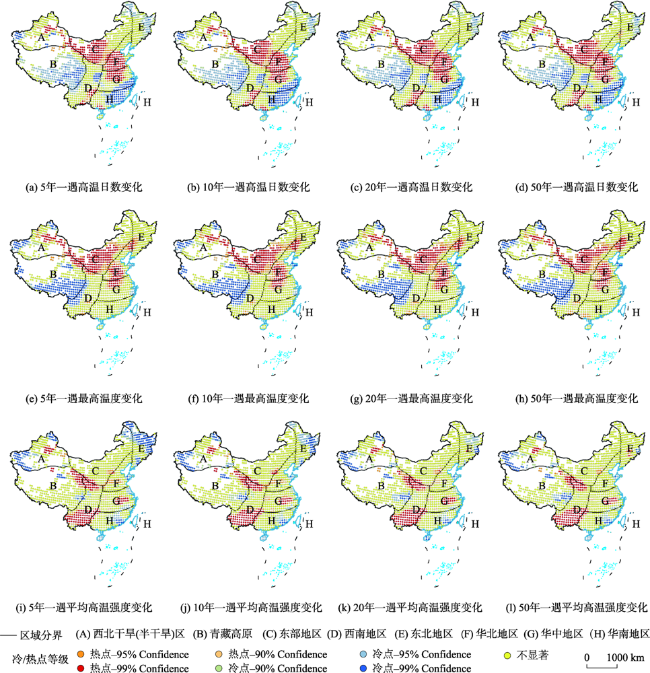
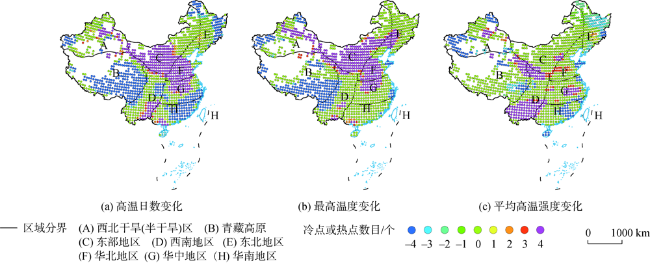
评估高温灾害的危险性变化,能够为区域高温灾害风险管理和制定减灾措施提供决策依据。本研究选取高温日数、最高温度和平均高温强度3个指标,基于1961—2020年中国2517个气象站点日最高温数据和CMIP6情景模式比较计划中SSP2-4.5情景下12个气候模式提供的2031—2099年未来气候预测数据集,用核密度概率估计方法计算了4个重现期(即5、10、20和50年)下3个指标的取值,对中国未来高温危险性变化进行了评估。结果表明:① 在SSP2.4-5情景下,中国的高温日数呈现出4个危险中心,分别是:西北干旱(半干旱)地区中部、华北和华中地区的交汇区域、西南地区中部和华南地区南部,并且高温日数从这4个中心向外逐渐减少;最高温度在空间上的分布北部大于南部,东部大于西部。平均高温强度的分布则呈现出从华北地区南部、西北干旱(半干旱)地区西部和东部地区西部向我国除青藏高原地区外的其它地区减少的趋势; ② 在SSP2.4-5情景下,随着重现期年限的增长,中国地区3个高温指标均呈增长趋势且增幅较大,并且高值范围也在不断扩大;③ 3个高温指标变化值均呈现出了明显的空间聚集性,3个指标共同显示的热点区域包括西南地区北部和南部、西北干旱(半干旱)地区中部和华北、华中地区的少部分区域,这些地区发生高温灾害的可能最大,同时根据高温日数变化和最高温度变化,东部地区西部发生高温灾害可能也较大,3个指标共同显示的冷点区域包括青藏高原地区东南部、西北干旱(半干旱)地区的西部和我国东南沿海地区,这些地区几乎不会发生高温危险。

郭春华 , 朱秀芳 , 张世喆 , 唐明秀 , 徐昆 . 基于CMIP6的中国未来高温危险性变化评估[J]. 地球信息科学学报, 2022 , 24(7) : 1391 -1405 . DOI: 10.12082/dqxxkx.2022.210491
The assessment of hazard changes of high temperature can provide decision basis for regional high temperature risk management and disaster reduction measures. Based on the daily maximum temperature data from 1961 to 2020 and the future climate predictions provided by the 12 climate models in the SSP2-4.5 scenario in the CMIP6 from 2031 to 2099, three indicators were calculated and used to assess the hazard of high temperature, including the number of high temperature days, maximum temperature, and average high temperature intensity. We used the kernel density estimation to calculate the values of the three indicators under four return periods (5, 10, 20, 50 years) of historical and future climate scenarios, and then evaluated the hazard changes of high temperature. The results show that: (1) Under the SSP2.4-5 scenario, the number of high temperature days in China presented four risk centers, including the central part of the arid (semi-arid) area of Northwest China, the intersection area of North China and Central China, the central part of Southwest China, and the southern part of South China. The number of high temperature days gradually decreased outward from these four centers. The spatial distribution of the maximum temperature in the north China was greater than that in the south China, and this distribution in the east China was greater than that in the west China. The distribution of average high temperature intensity showed a decreasing trend from the southern part of North China, the western part of the arid (semi-arid) region of the Northwest China, and the western part of the eastern region to other regions in China except the Qinghai-Tibet Plateau; (2) Under the scenario of SSP2.4-5, with the increase of the return period, the three high temperature indicators in China all showed an increasing trend. The area affected by high temperature expanded, and the values of the three high temperature indicators increased significantly; (3) The changes of the three high temperature indicators showed obvious spatial aggregation. The hotspot areas jointly displayed by the three indicators were: the northern and southern parts of the Southwest China, the central part of the arid (semi-arid) area of the Northwest China, and a small part of the northern and central parts of China, which were most likely to have high-temperature disasters. The change of high temperature days and maximum temperature indicated that high temperature disasters in the western part of the eastern region may also be large. The cold spot areas shown by the three indicators were: the southeast of the Qinghai-Tibet Plateau, the western part of the arid (semi-arid) northwestern region, the western part of the Tibetan Plateau, and the southeast coastal areas of China. There was little risk of high temperature in these areas.
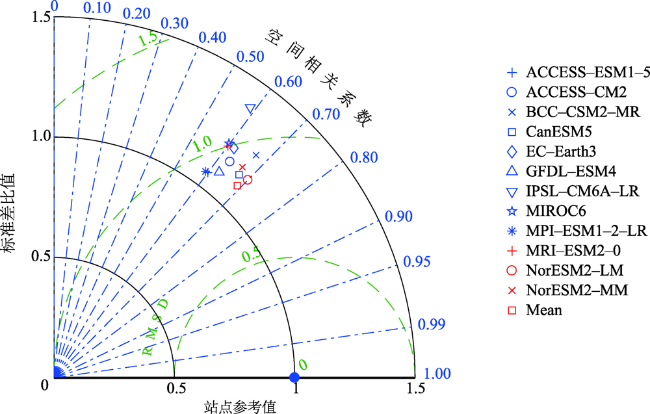
表1 耦合模式比较计划第六阶段(CMIP6)中12个模式信息Tab. 1 List of 12 models in Coupled Model Intercomparison Project(CMIP6) |
| 序号 | 模式名称 | 机构 | 国家 | 格点数 |
|---|---|---|---|---|
| 1 | ACCESS-ESM1-5 | CSIRO | Australia | 192×144 |
| 2 | ACCESS-CM2 | CSIRO-ARCCSS | Australia | 192×143 |
| 3 | BCC-CSM2-MR | BCC | China | 320×160 |
| 4 | CanESM5 | CCCma | Canada | 128×64 |
| 5 | EC-Earth3 | EC-Earth-Consortium | Europe | 512×256 |
| 6 | GFDL-ESM4 | NOAA-GFDL | United States | 288×180 |
| 7 | IPSL-CM6A-LR | IPSL | France | 144×143 |
| 8 | MIROC6 | MIROC | Japan | 256×128 |
| 9 | MPI-ESM1-2-LR | MPI-M | Germany | 192×96 |
| 10 | MRI-ESM2-0 | MRI | Japan | 320×160 |
| 11 | NorESM2-LM | NCC | Norwegian | 144×94 |
| 12 | NorESM2-MM | NCC | Norwegian | 288×190 |
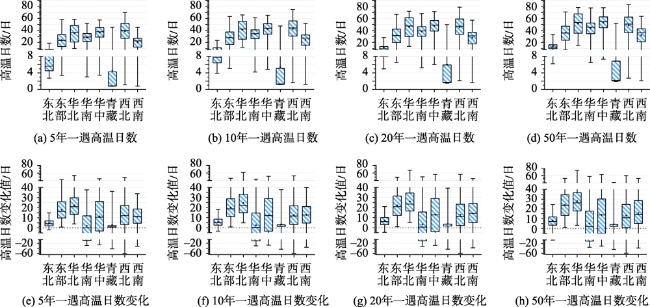
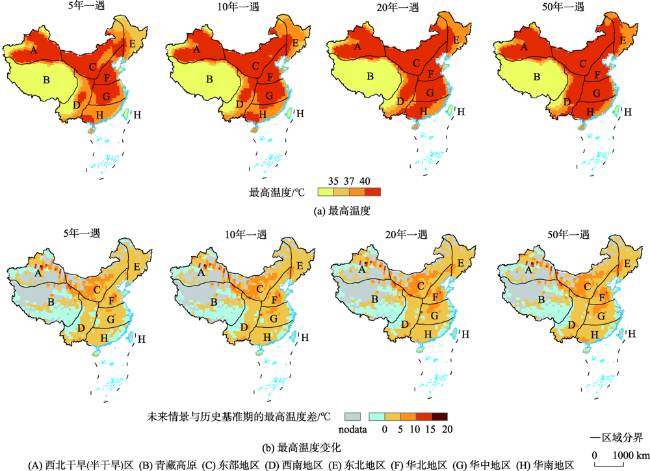
图4 SSP2-4.5情景中4个重现期下的高温日数分布及变化注:该图为基于自然资源部标准地图服务网站下载的审图号为GS(2020)4632号的标准地图制作,底图无修改。由于数据获取困难,本次研究不包括香港、台湾和澳门。 Fig. 4 Distribution map and change map of the number of high temperature days under the four return periods in the SSP2-4.5 scenario |
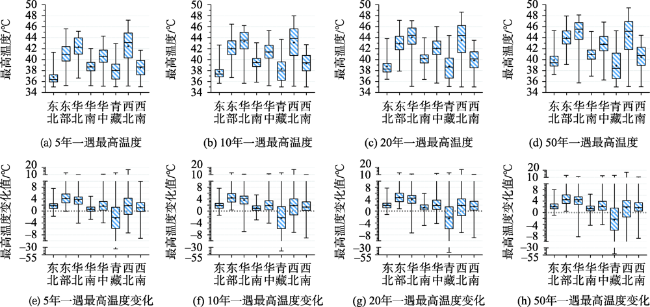
图6 SSP2-4.5情景中4个重现期下的最高温度分布及变化注:该图为基于自然资源部标准地图服务网站下载的审图号为GS(2020)4632号的标准地图制作,底图无修改。由于数据获取困难,本次研究不包括香港、台湾和澳门。 Fig. 6 Distribution map and change map of maximum temperature under the four return periods in the SSP2-4.5 scenario |
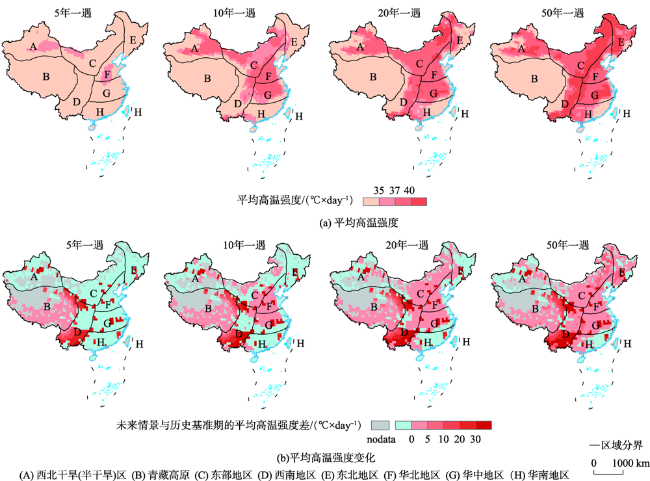
图8 SSP2-4.5情景中4个重现期下的平均高温强度分布图及变化注:该图为基于自然资源部标准地图服务网站下载的审图号为GS(2020)4632号的标准地图制作,底图无修改。由于数据获取困难,本次研究不包括香港、台湾和澳门。 Fig. 8 Distribution map and change map of average high temperature intensity under the four return periods in the SSP2-4.5 scenario |
表2 已有相关研究Tab. 2 Previous studies |
| 文献 | 数据 | 方法/指标 | 结论 |
|---|---|---|---|
| 贺山峰等[16] | PRECIS模式情景数据 | 高温日数和热浪日数 | 中国高温日数危险性始终较高的地区位于新疆中部,此外,随着时间的推移,本来位于东南部的危险性高值区逐渐南移,转为华南高值区 |
| 董思言等[17] | CMIP5 、RCP8.5情景22个模式数据 | 高温日数和热浪日数 | 中国未来不同时期高温致灾危险度显著增加的地区主要位于新疆、河南、湖南及广西 |
| 向竣文等[22] | 偏差校正后的EC-EARTH3 模式数据 | 5个表示发生频率的极端气候指标 | 在4种SSP情景下,年平均最高气温均表现出明显的上升趋势 |
| 李柔珂等[32] | CMIP5 的17个 模式 | 高温日数(SU)和极端最高温度(TXx) | 在RCP4.5和RCP8.5情景下,SU增幅较大的区域主要集中在西南南部和华南大部分地区,而TXx的高值区与基准期分布相似。随时间变化,RCP4.5和RCP8.5情景的TXx值均呈现增加的变化趋势,并且RCP8.5情景的变化数值更大 |
| [1] |
IPCC. Climate Change 2021:The Physical Science Basis. Contribution of working group I to the sixth assessment report of the intergovernmental panel on climate change[M]. Cambridge, U K: Cambridge University Press, 2021:In Press.
|
| [2] |
中国气象局气候变化中心. 中国气候变化蓝皮书[R]. 北京, 2020.
[ Climate Change Center of China Meteorological Administration. Blue Book on Climate Change in China[R]. Beijing, 2020. ]
|
| [3] |
WMO. WMO report on the state of the global climate 2020[R]. Geneva:WTO, 2021:38.
|
| [4] |
李大卫, 石树中, 杨福平, 等. 自然灾害风险评估综述[J]. 价值工程, 2014, 33(26):322-325.
[
|
| [5] |
武夕琳, 刘庆生, 刘高焕, 等. 高温热浪风险评估研究综述[J]. 地球信息科学学报, 2019, 21(7):1029-1039.
[
|
| [6] |
张婷, 程昌秀. 顾及空间集聚程度的中国高温灾害危险性评价[J]. 地球信息科学学报, 2019, 21(6):865-874.
[
|
| [7] |
杨红龙, 潘婕, 张镭. SRESA2情景下中国区域性高温热浪事件变化特征[J]. 气象与环境学报, 2015, 31(1):51-59.
[
|
| [8] |
|
| [9] |
|
| [10] |
|
| [11] |
|
| [12] |
张校玮. 我国极端气候时空特征及风险分析[D]. 上海: 上海师范大学, 2012.
[
|
| [13] |
|
| [14] |
|
| [15] |
雷杨娜, 龚道溢, 孙娴, 等. 基于全球模式对中国21世纪夏季高温的变化预估[J]. 北京师范大学学报(自然科学版), 2010, 46(1):85-91,115,111.
[
|
| [16] |
贺山峰, 戴尔阜, 葛全胜, 等. 中国高温致灾危险性时空格局预估[J]. 自然灾害学报, 2010, 19(2):91-97.
[
|
| [17] |
董思言, 徐影, 周波涛, 等. 基于CMIP5模式的中国地区未来高温灾害风险预估[J]. 气候变化研究进展, 2014, 10(5):365-369.
[
|
| [18] |
齐庆华. 未来气候情景下中国东部极端降水和气温的危险性特征[J]. 气象与减灾研究, 2020, 43(4):256-266.
[
|
| [19] |
辛晓歌, 吴统文, 张洁, 等. BCC模式及其开展的CMIP6试验介绍[J]. 气候变化研究进展, 2019, 15(5):533-539.
[
|
| [20] |
张明. 基于多指标、多尺度的中国极端高温事件时空分析[D]. 上海: 上海师范大学, 2016.
[
|
| [21] |
任国玉, 陈峪, 邹旭恺, 等. 综合极端气候指数的定义和趋势分析[J]. 气候与环境研究, 2010, 15(4):354-364.
[
|
| [22] |
向竣文, 张利平, 邓瑶, 等. 基于CMIP6的中国主要地区极端气温/降水模拟能力评估及未来情景预估[J]. 武汉大学学报(工学版), 2021, 54(1):46-57,81.
[
|
| [23] |
魏萌, 舒启, 宋振亚, 等. CMIP6气候模式对21世纪初全球增暖减缓现象模拟能力评估与归因分析[J]. 中国科学:地球科学, 2021, 51(6):947-961.
[
|
| [24] |
张丽霞, 陈晓龙, 辛晓歌. CMIP6情景模式比较计划(ScenarioMIP)概况与评述[J]. 气候变化研究进展, 2019, 15(5):519-525.
[
|
| [25] |
|
| [26] |
|
| [27] |
|
| [28] |
|
| [29] |
黄小梅, 赵旋, 肖丁木. 1961—2016年四川盆地夏季高温热浪变化特征分析[J]. 高原山地气象研究, 2019, 39(2):14-22.
[
|
| [30] |
王静爱, 史培军, 朱骊. 中国主要自然致灾因子的区域分异[J]. 地理学报, 1994, 49(1):18-26.
[
|
| [31] |
|
| [32] |
李柔珂. CMIP5模式对气候变化背景下中国地区未来气候灾害风险预估研究[D]. 兰州: 兰州大学, 2017.
[
|
| [33] |
|
/
| 〈 |
|
〉 |