
疫情背景下中国居民城际出行恢复力、恢复模式与影响因素
|
勾艺超(1998— ),男,四川德阳人,博士生,主要从事交通地理与区域发展研究。E-mail: gouyichao6918@igsnrr.ac.cn |
收稿日期: 2022-05-13
修回日期: 2022-06-22
网络出版日期: 2022-12-25
基金资助
国家自然科学基金项目(42071151)
Intercity Travel Resilience, Recovery Patterns and Influencing Factors of Resilience in Chinese Cities in the Context of COVID-19
Received date: 2022-05-13
Revised date: 2022-06-22
Online published: 2022-12-25
Supported by
National Natural Science Foundation of China(42071151)
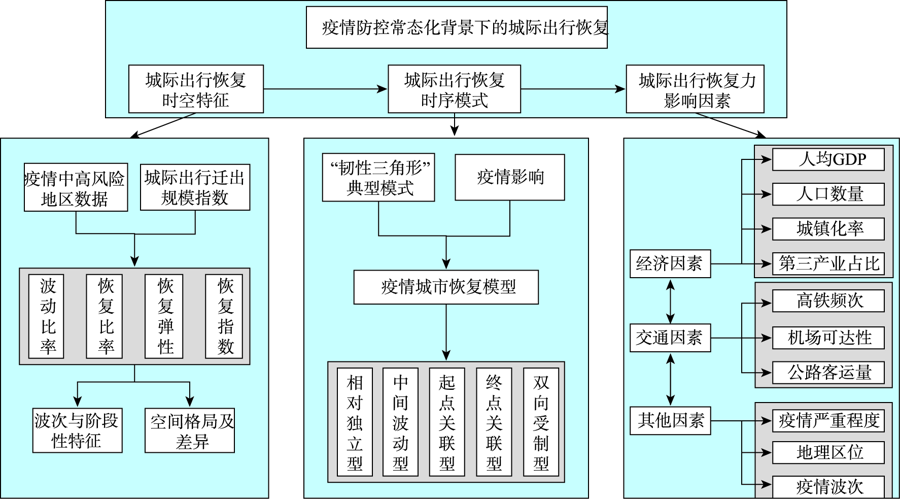
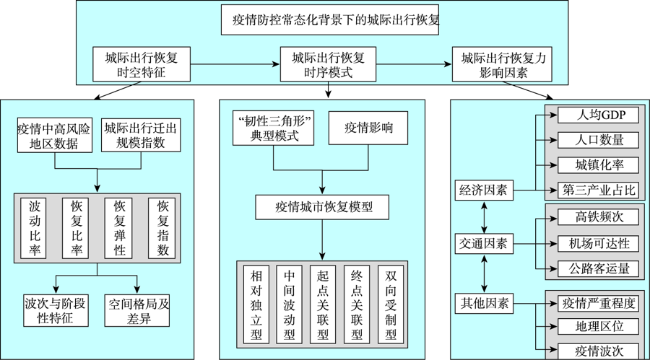
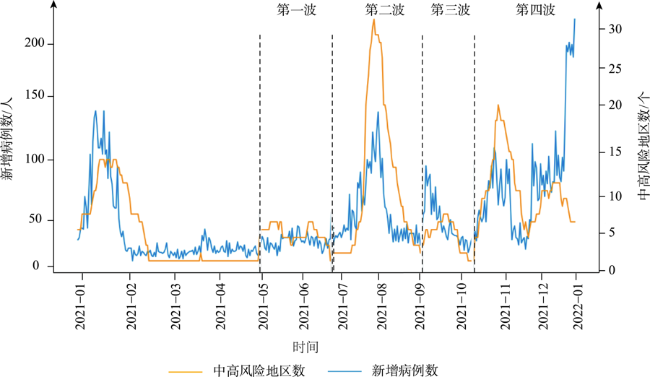
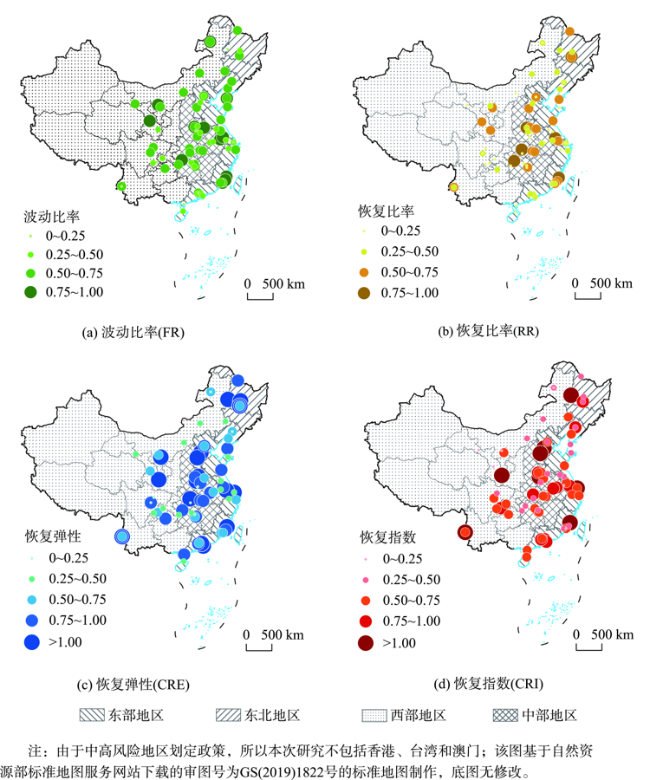
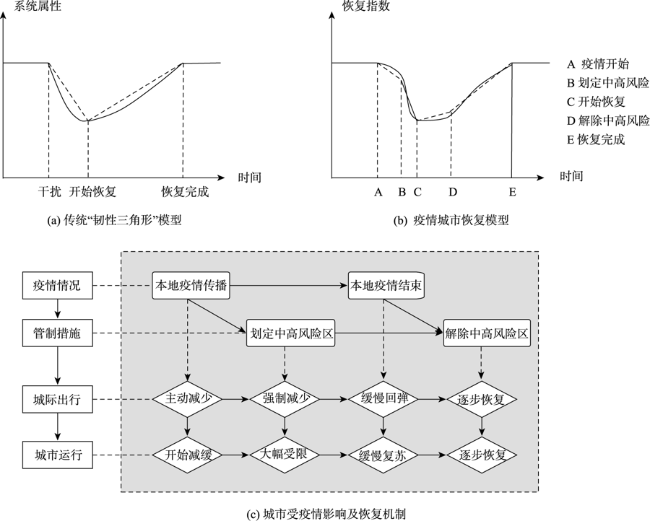
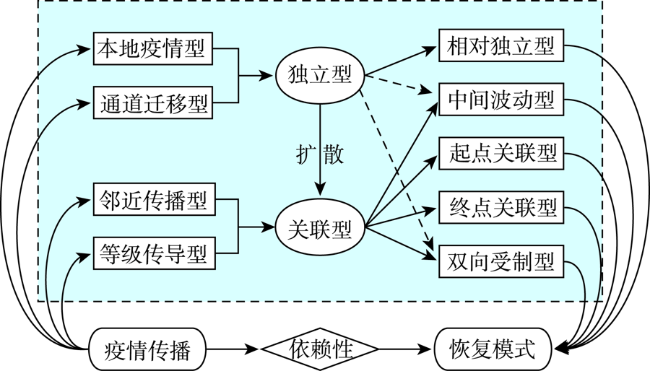
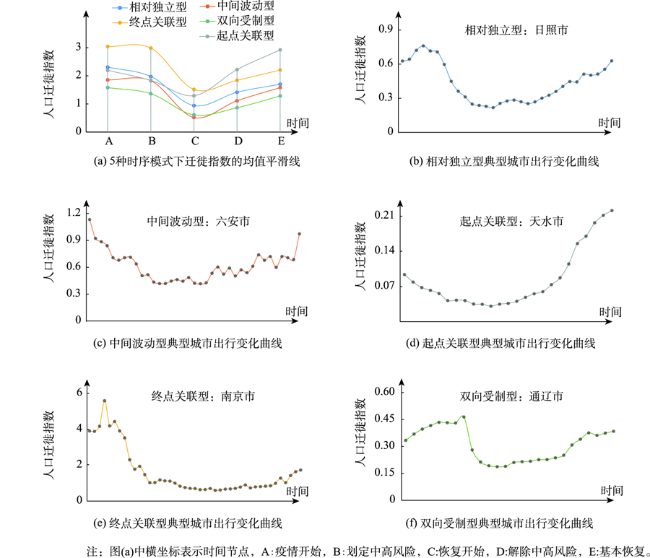
新冠疫情爆发以来,居民城际出行受到显著影响,其时空波动规律反映了居民城际出行恢复力和恢复模式。文章基于百度迁徙数据,着眼于疫情防控常态化阶段,分析城际出行恢复力的分异格局,归纳总结时序波动规律与模式,并构建计量模型探究影响城际出行恢复力的因素。研究构建了波动比率、恢复比率、恢复弹性和恢复指数4个指标,用以衡量城际出行恢复力大小;将2021年中国新冠疫情划分为4个波次,各轮疫情持续时长不一,涉及地区范围各异。研究发现:① 居民城际出行恢复力表现出一定的空间差异,东部地区最好,西部地区和中部地区其次,东北地区最差;② 居民城际出行恢复模式时序与传统韧性三角形模式相似,根据疫情传播特征和性质具体可归纳为相对独立型、中间波动型、起点关联型、终点关联型、双向受制型等5种模式,表现出各异的曲线形态和特征;③ 对于居民城际出行恢复力的影响因素,机场、高铁等交通因素具有正向相关关系,而与GDP、产业结构等经济因素的影响表现为U型关系。疫情防控背景下,城际出行恢复模式和恢复力是城市韧性的重要方面,为制定相关城市政策提供了科学依据。
勾艺超 , 魏铭 , 王姣娥 , 王成金 . 疫情背景下中国居民城际出行恢复力、恢复模式与影响因素[J]. 地球信息科学学报, 2022 , 24(10) : 1941 -1956 . DOI: 10.12082/dqxxkx.2022.220302
Since the outbreak of the COVID-19 epidemic in 2020, the intercity travel in China has been significantly affected. With the popularity of big data, spatiotemporal modeling and analysis are widely used in epidemic and transportation research. In the post epidemic era, residents' intercity travel shows a certain recovery mode under the influence of local epidemic. The recovery mode and resilience of intercity travel reflects the resilience of cities and can provide information for cities' epidemic prevention and control. Exploring different urban modes and factors affecting the resilience of intercity travel under the influence of epidemic situation has practical significance for normalized epidemic prevention and control management. Based on the migration big data, this paper describes the differentiation pattern of intercity travel resilience under the COVID-19 epidemic from different perspectives, summarizes the time series model, and explores the factors affecting intercity travel resilience. Four indicators, namely fluctuation ratio, recovery ratio, resilience, and recovery index, are constructed to measure the resilience of intercity travel. The results show that: (1) During the epidemic period, residents' resilience to travel shows certain spatial variation. On the whole, the eastern region is the best, followed by the western region and the central region, and the northeast region is the worst; (2) The temporal patterns of intercity travel in epidemic cities are consistent with "resilience triangle" of the typical model. According to the propagation mode and correlation of the epidemic, the specific temporal patterns can be classified into five types: Relative independence mode, intermediate fluctuation mode, starting-point correlation mode, end-point correlation mode, and bidirectional restraint mode, showing different curve forms and characteristics; (3) The resilience of intercity travel is affected by complex factors. When the epidemic wave and regional variables are controlled, economic and transportation factors have a significant impact on the recovery of intercity travel. There may be a U-shaped relationship between per capita GDP and industrial structure and the resilience of intercity travel. When the economic development reaches a certain level, the supporting effect of economy on the resilience of intercity travel becomes increasingly prominent. There is a positive correlation between high-speed rail and airport and the resilience of intercity travel, which plays an important role in increasing the resilience of intercity travel. The results of this study indicate that the application of spatiotemporal big data to analyze the mode and mechanism of urban recovery in the post epidemic era is a novel research method. Subsequent research can further explore the spatiotemporal pattern and mode mechanism of epidemic recovery, in order to provide scientific basis and guidance for epidemic prevention and control of cities.
Key words: COVID-19; migration; recovery ability; temporal variation modes; resilience; risk; big data; econometric model; China
表1 研究数据Tab. 1 Research data |
| 数据类型 | 说明 | 数据来源 | 年份 |
|---|---|---|---|
| 居民城际出行数据 | 人口迁出指数数据 | 百度迁徙( http://qianxi.baidu.com) | 2021 |
| 确诊病例人数数据 | 全国每日疫情新增病例数量 | 国家卫生健康委员会( http://www.nhc.gov.cn) | 2021 |
| 中高风险地区数据 | 全国每日中高风险地区城市名单 | 国家卫生健康委员会实时发布( http://www.nhc.gov.cn) | 2021 |
| 社会经济数据 | 各地市2020年GDP、人均GDP、城市化率、产业结构等数据 | 各城市统计年鉴 | 2020 |
| 交通数据 | 通航机场数量 | 百度地图( https://map.baidu.com) | 2021 |
| 高铁频次 | 中国铁路12306( https://www.12306.cn) | ||
| 公路客运量 | 各城市统计年鉴 |
表2 变量选择及描述性统计Tab. 2 Main variables and statistics |
| 变量类型 | 变量名 | 变量描述 | 均值 | 标准差 | 最小值 | 最大值 | |
|---|---|---|---|---|---|---|---|
| 因变量 | 恢复指数(CRI) | 疫情后城市迁出指数恢复至正常时期的比率/% | 0.628 | 0.317 | 0.190 | 1.742 | |
| 自变量 (解释变量) | 人口(pop) | 常住人口数量(Ln) | 6.26 | 0.96 | 2.27 | 8.04 | |
| 人均GDP (pGDP) | 人均GDP(Ln) | 11.19 | 0.581 | 9.843 | 12.22 | ||
| 第三产业占比 (industry) | 第三产业产值占比/% | 54.50 | 11.33 | 37 | 83.52 | ||
| 城市化率 (city) | 城市化率/% | 65.45 | 16.39 | 37.90 | 100 | ||
| 高铁频次 (railway) | 城市每日高铁频次(Ln) | 5.225 | 1.219 | 0.693 | 7.015 | ||
| 机场可达性 (air) | 城市及周边20 km内有无通航机场(0,1) | 0.910 | 0.288 | 0 | 1 | ||
| 公路客运量 (highway) | 公路客运量(Ln) | 8.307 | 1.148 | 3.572 | 10.95 | ||
| 疫情严重程度(COVID) | 全国确诊病例人数(Ln) | 3.94 | 0.63 | 2.20 | 4.82 | ||
| 本地疫情持续时长/d | 20.31 | 9.51 | 7 | 71 | |||
| 自变量 (控制变量) | 地理区位(loc) | 东部(east) | 位于东部地区(0,1) | 0.359 | 0.483 | 0 | 1 |
| 中部(middle) | 位于中部地区(0,1) | 0.244 | 0.432 | 0 | 1 | ||
| 西部(west) | 位于西部地区(0,1) | 0.244 | 0.432 | 0 | 1 | ||
| 疫情波次 (time) | 第二波 (second) | 第二波疫情(0,1) | 0.423 | 0.497 | 0 | 1 | |
| 第三波 (third) | 第三波疫情(0,1) | 0.0769 | 0.268 | 0 | 1 | ||
| 第四波 (second) | 第四波疫情(0,1) | 0.359 | 0.483 | 0 | 1 | ||
注:变量东部、中部、西部均为0则位于东北地区;变量第二波、第三波、第四波均为0则为第一波疫情。 |
表3 2021年有中高风险区的城市疫情概况Tab. 3 Overview of epidemic situation in cities with medium or high risk areas in 2021 |
| 波次 | 疫情核心城市 | 时间 | 发生疫情城市 | 数量/个 |
|---|---|---|---|---|
| 第一波 | 六安、广州 | 5月14日—7月5日 | 东莞、佛山、广州、合肥、六安、深圳、沈阳、营口、湛江 | 9 |
| 第二波 | 南京、厦门、 郑州 | 7月6日—9月9日 | 北京、成都、大连、德宏州、海口、呼伦贝尔、淮安、黄冈、荆门、荆州、开封、泸州、绵阳、南京、厦门、商丘、上海、沈阳、宿迁、武汉、湘潭、湘西州、许昌、烟台、扬州、宜宾、益阳、张家界、长沙、郑州、株洲、驻马店 | 32 |
| 第三波 | 莆田、哈尔滨 | 9月10日—10月14日 | 哈尔滨、莆田、泉州、厦门、绥化、漳州 | 6 |
| 第四波 | 兰州、北京、 成都 | 10月19日—12月31日 | 阿拉善盟、北京、常州、成都、大连、德宏州、广州、哈尔滨、杭州、黑河、呼和浩特、呼伦贝尔、兰州、宁波、齐齐哈尔、日照、上海、石家庄、天水、通辽、锡林郭勒盟、银川、张掖、郑州、重庆、周口、遵义 | 27 |
注:数据源于国家卫健委( http://www.nhc.gov.cn)实时发布的中高风险区情况。 |
表4 时间分异视角的恢复力指标Tab. 4 Recovery ability indexes from time differentiation view (%) |
| 波次 | 波动比率 | 恢复比率 | 恢复弹性 | 恢复指数 | |||||||
|---|---|---|---|---|---|---|---|---|---|---|---|
| 均值 | 中位数 | 均值 | 中位数 | 均值 | 中位数 | 均值 | 中位数 | ||||
| 第一波 | 40.5 | 41.6 | 33.5 | 36.7 | 90.5 | 90.5 | 82.1 | 81.5 | |||
| 第二波 | 57.5 | 60.7 | 32.1 | 22.4 | 119.6 | 46.6 | 55.6 | 54.3 | |||
| 第三波 | 71.9 | 79.0 | 57.7 | 57.0 | 82.0 | 73.7 | 47.9 | 39.0 | |||
| 第四波 | 52.4 | 53.0 | 41.7 | 44.9 | 140.4 | 78.9 | 67.0 | 65.3 | |||
表5 空间分异视角的时序指标Tab. 5 Time series indexes from spatial differentiation view (%) |
| 区域 | 波动比率 | 恢复比率 | 恢复弹性 | 恢复指数 | |||||||
|---|---|---|---|---|---|---|---|---|---|---|---|
| 均值 | 中位数 | 均值 | 中位数 | 均值 | 中位数 | 均值 | 中位数 | ||||
| 东部 | 50.9 | 50.1 | 36.3 | 36.1 | 81.2 | 68.3 | 69.4 | 66.4 | |||
| 中部 | 58.2 | 63.8 | 41.6 | 38.7 | 169.8 | 75.9 | 60.7 | 55.8 | |||
| 西部 | 52.1 | 54.5 | 34.3 | 33.4 | 82.6 | 58.3 | 57.2 | 56.6 | |||
| 东北 | 58.5 | 64.1 | 40.3 | 40.9 | 191.3 | 73.8 | 59.9 | 46.9 | |||
表6 5种时序模式的指标特征Tab. 6 Indexes of five time series patterns (%) |
| 时序模式 | 波动比率 | 恢复比率 | 恢复弹性 | 恢复指数 | |||||||
|---|---|---|---|---|---|---|---|---|---|---|---|
| 均值 | 中位数 | 均值 | 中位数 | 均值 | 中位数 | 均值 | 中位数 | ||||
| 相对独立型 | 52.74 | 54.47 | 35.33 | 33.37 | 62.40 | 72.74 | 74.48 | 64.46 | |||
| 中间波动型 | 72.78 | 73.69 | 55.00 | 45.59 | 55.21 | 75.87 | 74.84 | 54.75 | |||
| 起点关联型 | 37.83 | 29.10 | 52.08 | 45.40 | 103.33 | 145.10 | 303.87 | 92.85 | |||
| 终点关联型 | 58.68 | 64.77 | 25.04 | 21.44 | 48.89 | 37.58 | 39.81 | 47.14 | |||
| 双向受制型 | 52.17 | 54.91 | 32.17 | 34.22 | 55.77 | 68.33 | 71.74 | 44.13 | |||
表7 5种时序模式及城市范围Tab. 7 Five temporal patterns and corresponding cities |
| 时序模式 | 曲线形状 | 特征 | 城市范围 | 数量/个 |
|---|---|---|---|---|
| 相对独立型 | 高“U”形 | 自由恢复,整体居中 | 德宏州(4月、7月、11月)、沈阳(7月)、成都(7月、11月)、宜宾、大连(7月、11月)、黄冈、泸州、湘潭、益阳、海口、烟台、上海(8月初)、北京(8月、10月)、呼伦贝尔(8月)、遵义、银川、日照、常州、重庆、上饶、宿州、黑河、石家庄、哈尔滨(12月) | 24 |
| 中间波动型 | 深“V”形 | 波动较大,弹性较高 | 六安、营口、张家界、厦门(7月)、郑州(7月、11月)、武汉、莆田、哈尔滨(9月)、阿拉善盟、呼伦贝尔(11月) | 10 |
| 起点关联型 | “√”形 | 恢复多,弹性高 | 沈阳(5月)、深圳、东莞、扬州、荆门、开封、上海(8月末)、天水、绍兴、周口、齐齐哈尔 | 11 |
| 终点关联型 | 斜“L”形 | 恢复少,弹性小 | 合肥、广州(5月、12月)、淮安、株洲、南京、绵阳、宿迁、湘西州、荆州、兰州、锡林郭勒盟、宁波、上海(11月) | 13 |
| 双向受制型 | 低“U”形 | 位序低,曲线缓 | 保定、佛山、湛江、长沙、商丘、驻马店、许昌、泉州、厦门(9月)、漳州、绥化、张掖、呼和浩特、哈尔滨(10月)、杭州、通辽 | 16 |
注:由于中高风险地区划定政策,本次研究不包括香港、台湾和澳门。 |
表8 主要变量系数和显著性Tab. 8 Coefficients and significance of main variables |
| 变量名 | 系数 | 显著性 | 变量名 | 系数 | 显著性 |
|---|---|---|---|---|---|
| 人口(pop) | 0.113 | 0.139 | 疫情严重程度(COVID) | ||
| 人均GDP(pGDP) | -5.631(**) | 0.027 | 全国确诊病例人数 | -0.128 | 0.837 |
| 人均GDP二次项(pGDP^2) | 0.234(**) | 0.044 | 本地疫情时长 | -0.0035 | 0.476 |
| 地理区位(loc) | |||||
| 第三产业占比(industry) | -0.0704(**) | 0.019 | 东部(east) | 0.0977 | 0.402 |
| 第三产业占比二次项(industry^2) | 0.0004(**) | 0.032 | 中部(middle) | 0.0129 | 0.912 |
| 城镇化率(city) | 0.0022 | 0.542 | 西部(west) | -0.0471 | 0.679 |
| 疫情波次(time) | |||||
| 高铁频次(railway) | 0.127(**) | 0.019 | 第二波(second) | -0.117 | 0.261 |
| 机场可达性(air) | 0.309(***) | 0.009 | 第三波(third) | -0.333(**) | 0.037 |
| 公路客运量(highway) | -0.117(**) | 0.011 | 第四波(second) | -0.020 | 0.854 |
注:**表示在0.05水平下显著;***表示在0.01水平下显著。 |
| [1] |
童昀, 马勇, 刘海猛. COVID-19疫情对中国城市人口迁徙的短期影响及城市恢复力评价[J]. 地理学报, 2020, 75(11):2505-2520.
[
|
| [2] |
潘家栋. 新冠肺炎疫情对经济发展的影响及对策——以浙江省为例[J]. 决策咨询, 2021(03):72-76,80.
[
|
| [3] |
刘帅. 新冠肺炎疫情对中国区域经济的影响[J]. 地理研究, 2021, 40(2):310-325.
[
|
| [4] |
王姣娥, 杜德林, 魏冶, 等. 新冠肺炎疫情的空间扩散过程与模式研究[J]. 地理研究, 2020, 39(7):1450-1462.
[
|
| [5] |
|
| [6] |
|
| [7] |
|
| [8] |
|
| [9] |
|
| [10] |
孙久文, 孙翔宇. 区域经济韧性研究进展和在中国应用的探索[J]. 经济地理, 2017, 37(10):1-9.
[
|
| [11] |
王永贵, 高佳. 新冠疫情冲击、经济韧性与中国高质量发展[J]. 经济管理, 2020, 42(5):5-17.
[
|
| [12] |
邵亦文, 徐江. 城市韧性:基于国际文献综述的概念解析[J]. 国际城市规划, 2015, 30(2):48-54.
[
|
| [13] |
方东平, 李在上, 李楠, 等. 城市韧性——基于“三度空间下系统的系统”的思考[J]. 土木工程学报, 2017, 50(7):1-7.
[
|
| [14] |
裴韬, 王席, 宋辞, 等. COVID-19疫情时空分析与建模研究进展[J]. 地球信息科学学报, 2021, 23(2):188-210.
[
|
| [15] |
|
| [16] |
|
| [17] |
|
| [18] |
|
| [19] |
李涛, 李国平, 薛领. 基于系统动力学的新冠肺炎疫情影响北京经济发展的模拟仿真分析[J]. 地理科学, 2022, 42(2):244-255.
[
|
| [20] |
王博云, 刘天禹, 李露凝, 等. 中国COVID-19疫情扩散的时空模式及影响因素[J]. 地理学报, 2022, 77(2):443-456.
[
|
| [21] |
|
| [22] |
|
| [23] |
程昌秀, 史培军, 宋长青, 等. 地理大数据为地理复杂性研究提供新机遇[J]. 地理学报, 2018, 73(8):1397-1406.
[
|
| [24] |
|
| [25] |
刘张, 千家乐, 杜云艳, 等. 基于多源时空大数据的区际迁徙人群多层次空间分布估算模型——以COVID-19疫情期间自武汉迁出人群为例[J]. 地球信息科学学报, 2020, 22(2):147-160.
[
|
| [26] |
赵梓渝, 赵世瑶, 韩钟辉, 等. COVID-19疫情对中国节日人口城际出行影响研究[J]. 人文地理, 2022, 37(2):141-149,172.
[
|
| [27] |
谭波, 秦思娴, 罗名海, 等. 基于手机信令数据的武汉市居民出行疫后恢复分析[J]. 城市勘测, 2021(5):70-74.
[
|
| [28] |
杨冕, 谢泽宇. 新冠肺炎疫情防控对中国人口流动的影响——基于百度地图迁徙大数据的实证研究[J]. 人口研究, 2020, 44(4):74-88.
[
|
| [29] |
陈晓, 黄宇金, 李佳慧, 等. COVID-19疫情时空聚集性特征及影响因素分析——以重庆市为例[J]. 地理科学进展, 2020, 39(11):1798-1808.
[
|
| [30] |
赵序茅, 李欣海, 聂常虹. 基于大数据回溯新冠肺炎的扩散趋势及中国对疫情的控制研究[J]. 中国科学院院刊, 2020, 35(3):248-255.
[
|
| [31] |
许泽宁, 吴建南, 高晓路. 疫情分级分类管控机制的优化策略研究——以新冠肺炎疫情为例[J]. 城市发展研究, 2020, 27(7):5-10,89.
[
|
| [32] |
刘勇, 杨东阳, 董冠鹏, 等. 河南省新冠肺炎疫情时空扩散特征与人口流动风险评估——基于1243例病例报告的分析[J]. 经济地理, 2020, 40(3):24-32.
[
|
| [33] |
李涛, 李宇, 戴靓, 等. COVID-19疫情影响下的“五一”小长假城际出行特征与影响因素[J]. 地理研究, 2021, 40(11):3225-3241.
[
|
| [34] |
张可云, 张颖, 王洋志, 等. 空间经济学视角下新冠肺炎疫情的时空扩散规律研究[J]. 经济纵横, 2020(11):84-95.
[
|
| [35] |
魏冶, 修春亮. 城市网络韧性的概念与分析框架探析[J]. 地理科学进展, 2020, 39(3):488-502.
[
|
| [36] |
朱正威, 刘莹莹, 杨洋. 韧性治理:中国韧性城市建设的实践与探索[J]. 公共管理与政策评论, 2021, 10(3):22-31.
[
|
| [37] |
|
| [38] |
|
| [39] |
|
| [40] |
冯晔囡, 宋洋, 王世文, 等. 全球新型冠状病毒变异株研究进展[J]. 病毒学报, 2021, 37(3):695-711.
[
|
/
| 〈 |
|
〉 |