
X市入室盗窃犯罪人空间出行距离及其影响因素分析
|
张超鹏(1996— ),广东梅州人,硕士生,主要研究方向为犯罪地理、数据挖掘与分析。E-mail: spider1311@163.com |
收稿日期: 2022-04-27
修回日期: 2022-05-31
网络出版日期: 2022-12-25
基金资助
教育部人文社会科学规划基金(20YJAZH009)
中国人民公安大学基本科研业务费专项(2020JKF501)
Residential Burglars' Journey-to-Crime Distribution and its Impacting Factors in X city
Received date: 2022-04-27
Revised date: 2022-05-31
Online published: 2022-12-25
Supported by
Humanities and Social Sciences planning fund project of the Ministry of Education(20YJAZH009)
Special fund for basic scientific research of People's Public Security University of China(2020JKF501)
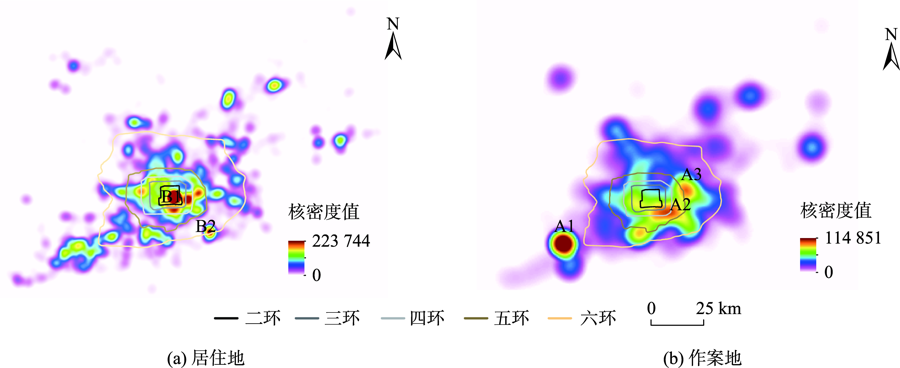
针对犯罪人空间出行距离测量及影响因素考虑上存在的不足,本文利用X市2015—2017年入室盗窃案件数据,基于百度地图计算了犯罪人居住地到作案地之间的步行、骑行和驾车等3种交通出行距离,作为实际空间出行距离的近似拟合,随后利用最优尺度回归模型分析了居住地和作案地所在区域的空间环境特征、作案时间特征和主体特征对犯罪人空间出行可能产生的影响。实证分析表明:① 计算得到的3种距离的频次分布均表现为距离衰减效应,超过50%的案件中犯罪人作案地到其居住地的交通距离均不超过10 km;② 在影响因素方面,犯罪人的空间出行距离分布主要受其作案地所在区域的空间环境特征影响,具体表现为目标较为集中、交通通达性较好的区域对邻近空间内的犯罪人具有较强的吸引性,而发案量较高的区域对距离较远的犯罪人具有较强的吸引性;③ 在主体特征上,团伙犯罪人较独狼式犯罪人有更长的空间出行距离,反映出团伙犯罪人在空间认知上有着更好的优势。本文有助于进一步深化对犯罪出行现象的理解,对犯罪预测具有一定的实践指导意义。
张超鹏 , 陈鹏 , 江欢 , 于越 . X市入室盗窃犯罪人空间出行距离及其影响因素分析[J]. 地球信息科学学报, 2022 , 24(10) : 1957 -1967 . DOI: 10.12082/dqxxkx.2022.220232
In criminology, journey-to-crime describes the phenomenon that how offenders be off their residing places and search for targets in space. In view of the disadvantages in the measurement of offenders' journey-to-crime and the influencing factors, the data of residential burglary offense in X city from 2015 to 2017 are collected and the walking, riding, and driving distances from the offender's residing location to their corresponding offending location are calculated using Baidu map API service. Then, this paper uses the categorical regression model to analyze the possible impact of environmental features within the offenders' residing area and the offending area, temporal pattern of crime, and subject characteristics of offenders on the journey-to-crime. The empirical analysis shows that: ① The frequency distribution of the three fitted traffic distances obeys the distance decay effect. Among more than 50% of the occurred crimes, the traffic distances between offenders' residing locations and their corresponding offending locations are no more than 10km, and also, the results indicate that there is no significant difference between any pair of three traffic distances, which demonstrates that three types of traffic distances are moderately equal in measuring journey-to-crime cost; ② In terms of influencing factors, the journey-to-crime distance of an offender is mainly affected by the environmental features within the offending area. Specifically, the results demonstrate that the more the targets concentrated and the areas being accessible, the more adjacent offenders are strongly attracted, while the more crime concentrated, the areas more strongly attract offenders from distant places; ③ In terms of the main individual characteristics of offenders, group offenders have longer journey-to-crime distance than single offenders, which reflects that group offenders have advantages in spatial cognition. It is mainly reflected in that for offenders who commit crimes alone, their "lone wolf" behavior restricts their spatial cognition to a low level, and the offenders who commit crimes in groups can learn and accumulate more about targets through information sharing between the members. At the same time, group cooperation can also support offenders to commit crimes in remote places from their residences and help them achieve higher crime benefits. Comparing with previous work on journey-to-crime, this paper includes the diversity of travel functions of offenders in their crime-committing processes, which fills the void of current research and enhances the understanding of journey-to-crime phenomenon. Meanwhile, the work finished in this paper could also be potentially and practically applied in offenders' detection scenarios, for example, geographic profiling.
表1 研究数据来源及构成Tab.1 Data source for study and its components |
| 数据名称 | 来源 | 时间 | 主要构成 |
|---|---|---|---|
| 入室盗窃案件数据 | X市公安机关 | 2015—2017年 | 案件编号,犯罪人的户籍地详址,犯罪人居住地详址、作案地详址,犯罪人身份证号码,案发时间 |
| POI数据 | 百度地图开放平台 | 2017年 | 餐饮消费(美食、购物等) 道路状况(道路密度) 公共场所(旅游景点、展览馆、文化馆、美术馆等) 公司企业(各类公司、金融机构、各类银行等) 交通设施(公交车站、地铁站等) 居住场所(住宅小区、酒店、村庄等) 生活服务(汽车服务、生活服务、美容美发等) 休闲娱乐(娱乐场所、运动健身等) 医疗教育(医疗机构、教育培训机构、研究机构等) 政府机构(行政服务中心、居委会等) |
表2 不同出行距离描述性统计Tab.2 Descriptive analysis of three distances (m) |
| 犯罪人 特征 | 平均值 | 标准差 | 最小距离 | 最大距离 | |||||||||||
|---|---|---|---|---|---|---|---|---|---|---|---|---|---|---|---|
| Fd | Bd | Vd | Fd | Bd | Vd | Fd | Bd | Vd | Fd | Bd | Vd | ||||
| 总体 | 15 890 | 16 420 | 17 648 | 18 714 | 19 367 | 20 524 | 0 | 0 | 0 | 106 227 | 108 074 | 123 974 | |||
| 当地户籍 | 17 041 | 17 526 | 18 387 | 21 566 | 22 187 | 23 063 | 0 | 0 | 0 | 103 841 | 108 074 | 114 823 | |||
| 非当地户籍 | 15 659 | 16198 | 17 500 | 18 082 | 18 745 | 19 976 | 0 | 0 | 0 | 106 227 | 107 802 | 123 974 | |||
| 25岁以下 | 12 752 | 13 126 | 14 154 | 15 385 | 15 855 | 16 779 | 0 | 0 | 0 | 106 227 | 106192 | 116 422 | |||
| 25~45岁 | 17 559 | 18 165 | 19 500 | 20 092 | 20 808 | 22 076 | 0 | 0 | 0 | 105 006 | 108074 | 123 974 | |||
| 45岁以上 | 13 833 | 14 319 | 15 423 | 16 434 | 17 034 | 17 875 | 0 | 0 | 0 | 100 802 | 106 932 | 106 775 | |||
| 女 | 14 161 | 14760 | 15 959 | 12 960 | 13 455 | 14 421 | 0 | 0 | 0 | 69 270 | 70 733 | 81 308 | |||
| 男 | 16 004 | 16 529 | 17 760 | 19 028 | 19 690 | 20 960 | 0 | 0 | 0 | 106227 | 108 074 | 123 974 | |||
| 个人 | 15 076 | 15 569 | 16 695 | 18 613 | 19 215 | 20 392 | 0 | 0 | 0 | 106 227 | 108 074 | 116 620 | |||
| 团伙 | 17 692 | 18 304 | 19 760 | 18 817 | 19 574 | 20 666 | 0 | 0 | 0 | 103 841 | 106 932 | 123 974 | |||
表3 居住地、作案地1 km缓冲区内的POI变量主成分系数Tab.3 PCA coefficients of POIs within 1 km buffer zone of offenders' residing and offending places |
| POI类型 | 居住地因子1 (目标集中度) | 居住地因子2 (交通通达度) | POI类型 | 作案地因子1 (目标集中度) | 作案地因子2 (交通通达度) |
|---|---|---|---|---|---|
| 居住地餐饮消费 | 0.886 | -0.071 | 作案地餐饮消费 | 0.898 | -0.051 |
| 居住地道路状况 | 0.002 | 0.940 | 作案地道路状况 | -0.078 | 0.972 |
| 居住地公共场所 | 0.649 | -0.026 | 作案地公共场所 | 0.619 | 0.083 |
| 居住地公司企业 | 0.902 | -0.064 | 作案地公司企业 | 0.884 | -0.067 |
| 居住地交通设施 | 0.681 | 0.414 | 作案地交通设施 | 0.739 | 0.285 |
| 居住地居住场所 | 0.861 | 0.136 | 作案地居住场所 | 0.857 | 0.051 |
| 居住地生活服务 | 0.934 | -0.050 | 作案地生活服务 | 0.940 | -0.023 |
| 居住地休闲娱乐 | 0.935 | -0.062 | 作案地休闲娱乐 | 0.933 | -0.037 |
| 居住地医疗教育 | 0.902 | -0.086 | 作案地医疗教育 | 0.911 | -0.040 |
| 居住地政府机构 | 0.926 | -0.088 | 作案地政府机构 | 0.903 | -0.036 |
表4 犯罪人的居住地和作案地1 km缓冲区内的空间环境特征变量及描述性统计Tab.4 Environmental features and its descriptive statistic within 1 km buffer zone of offenders' residing and offending places |
| 变量类型 | 自变量 | 自变量描述 | 平均数 | 标准差 |
|---|---|---|---|---|
| 居住地 | POI因子1 | 缓冲区内目标集中度 | 978.83 | 1028.01 |
| POI因子2 | 缓冲区内交通通达度 | -8.85 | 44.36 | |
| 案件数量 | 缓冲区内发案量 | 47.10 | 65.06 | |
| 作案地 | POI因子1 | 缓冲区内目标集中度 | 1178.89 | 1186.20 |
| POI因子2 | 缓冲区内交通通达度 | -16.15 | 40.98 | |
| 案件数量 | 缓冲区内发案量 | 36.93 | 48.25 |
表5 作案时间特征和犯罪人主体特征的离散化定义及赋值Tab.5 Discretization and assignment of temporal and individual features of offender |
| 自变量类型 | 自变量定义 | 自变量离散化赋值 |
|---|---|---|
| 作案时间 | 月/年 | 离散变量(1~12) |
| 旬/月 | 上旬(1—10日)=1;中旬(11—20日)=2;下旬(21—月末)=3 | |
| 时/日 | 凌晨(0—5时)=1;早上(6—8时)=2;上午(9—11时)=3; | |
| 中午(12—13时)=4;下午(14—17时)=5;晚上(18—23时)=6 | ||
| 主体特征 | 是否京籍 | 京籍=1;非京籍=2 |
| 年龄 | 连续变量(岁) | |
| 性别 | 女=1;男=2 | |
| 团伙犯罪 | 个人犯罪=1;团伙犯罪=2 |
表6 不同出行距离的回归分析结果Tab.6 Regression analysis outcomes of different dependent variables |
| 变量类型 | 自变量 | 模型一 | 模型二 | 模型三 | ||||||
|---|---|---|---|---|---|---|---|---|---|---|
| Fd | Bd | Vd | Fd | Bd | Vd | Fd | Bd | Vd | ||
| 居住地 | 因子1 | -0.036 | -0.033 | -0.036 | -0.035 | -0.033 | -0.036 | -0.032 | -0.030 | -0.035 |
| 因子2 | 0.02 | 0.022 | 0.028 | 0.021 | 0.023 | 0.028 | 0.026 | 0.028 | 0.032 | |
| 案件数 | 0.001 | 0.001 | 0.001 | 0.001 | 0.001 | 0.001 | -0.004 | -0.004 | -0.003 | |
| 作案地 | 因子1 | -0.197** | -0.195** | -0.179** | -0.202** | -0.200** | -0.182** | -0.192** | -0.191** | -0.173** |
| 因子2 | -0.128** | -0.127** | -0.117** | -0.132** | -0.131** | -0.121** | -0.128** | -0.128** | -0.118** | |
| 案件数 | 0.084** | 0.081** | 0.080** | 0.084** | 0.081** | 0.078** | 0.082** | 0.079** | 0.075** | |
| 作案时间 | 月/年 | - | - | - | -0.036** | -0.037** | -0.038** | -0.035** | -0.035** | -0.037** |
| 旬/月 | - | - | - | 0.027* | 0.026* | 0.027* | 0.028* | 0.028* | 0.028* | |
| 时/日 | - | - | - | -0.016 | -0.017 | 0.014 | -0.016 | -0.016 | 0.017 | |
| 主体特征 | 是否京籍 | - | - | - | - | - | - | -0.021 | -0.018 | -0.010 |
| 年龄 | - | - | - | - | - | - | 0.079** | 0.080** | 0.082** | |
| 性别 | - | - | - | - | - | - | 0.027** | 0.026** | 0.025** | |
| 团伙 | - | - | - | - | - | - | 0.051** | 0.051** | 0.054** | |
| R2 | 0.024 | 0.023 | 0.021 | 0.026 | 0.025 | 0.023 | 0.035 | 0.034 | 0.032 | |
注: *p<0.01,**p<0.001。 |
| [1] |
姜超, 唐焕丽, 柳林. 中国犯罪地理研究述评[J]. 地理科学进展, 2014, 33(4):561-573.
[
|
| [2] |
|
| [3] |
|
| [4] |
|
| [5] |
|
| [6] |
|
| [7] |
|
| [8] |
侯超, 陈鹏, 曾昭龙, 等. 不同主体特征的犯罪人空间出行行为分析[J]. 地理科学进展, 2020, 39(4):602-613.
[
|
| [9] |
赵梓渝, 刘大千, 肖建红, 等. 基于犯罪模式理论的犯罪出行空间特征与影响因素——以长春市南关区扒窃为例[J]. 地理研究, 2021, 40(3):885-899.
[
|
| [10] |
|
| [11] |
|
| [12] |
龙冬平, 柳林, 周素红, 等. 地理学视角下犯罪者行为研究进展[J]. 地理科学进展. 2017, 36(7):886-902.
[
|
| [13] |
龙冬平, 刘丹红, 陈建国. ZG市街头抢劫者作案地选择及其影响因素研究[J]. 地理研究, 2022, 41(5):1422-1436.
[
|
| [14] |
赵梓渝, 刘大千, 高雪, 等. 基于人口学特征的犯罪者行为时空倾向—以长春市南关区为例[J]. 地理科学, 2021, 41(8):1409-1418.
[
|
| [15] |
|
| [16] |
|
| [17] |
|
| [18] |
|
| [19] |
|
| [20] |
百度地图开放平台地点检索V2.0[EB/OL].(2018-03-15)[2021-08-31]. https://api.map.baidu.com/place/v2
|
| [21] |
周素红, 谢蔚翰, 宋广文, 等. 土地利用对街头抢劫影响的空间分异模式:以H市为例[J]. 地理科学, 2017, 37(6):885-894.
[
|
| [22] |
|
| [23] |
|
| [24] |
杜洋, 柴彦威, 杨家文, 等. 基于GPS数据的北京市居民活动规律性与可预测性研究[J]. 地理与地理信息科学, 2015, 31(6):47-51.
[
|
| [25] |
张涵, 陈艳红. 中国省域图书公共文化服务的时空演变及其空间溢出效应研究[J]. 经济地理, 2021, 41(11):149-156.
[
|
| [26] |
汪晗, 潘海啸, 魏川登. 轨道交通与北京市职住空间结构特征探析[J]. 住宅科技, 2021, 41(10):58-63.
[
|
| [27] |
李海波. 保障房居住满意度影响因素及城际差异实证研究[J]. 经济研究参考, 2018(50):11-19.
[
|
| [28] |
张晓君, 黄微, 李瑞. 心理距离视角下网络舆情传播意愿影响因素研究[J]. 图书情报工作, 2019, 63(12):86-93.
[
|
| [29] |
常超凡. 城市居民短距离出行行为研究[D]. 北京交通大学, 2007.
[
|
| [30] |
|
| [31] |
|
| [32] |
|
/
| 〈 |
|
〉 |

