
基于街景图像的厦门本岛环境特征对住宅价格的影响研究
|
郭金函(1997— ),男,四川广元人,硕士,主要从事城市规划数据分析与应用,区域与城市规划研究。E-mail: jhguo_work@163.com |
收稿日期: 2022-07-23
修回日期: 2022-08-22
网络出版日期: 2023-01-25
Analysis on the Influence of Environmental Characteristics of Xiamen Island on Housing Price based on Street View Imagery
Received date: 2022-07-23
Revised date: 2022-08-22
Online published: 2023-01-25
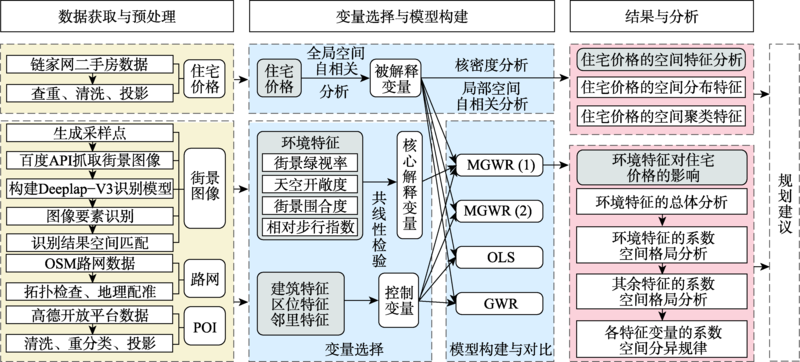
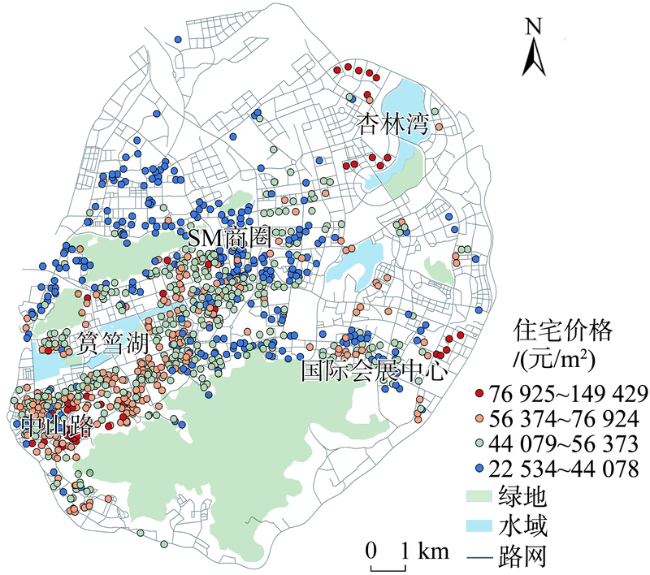
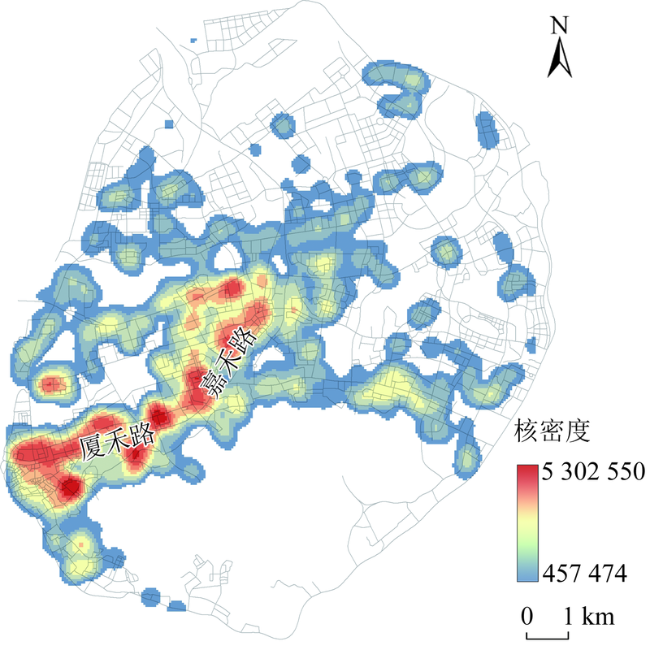
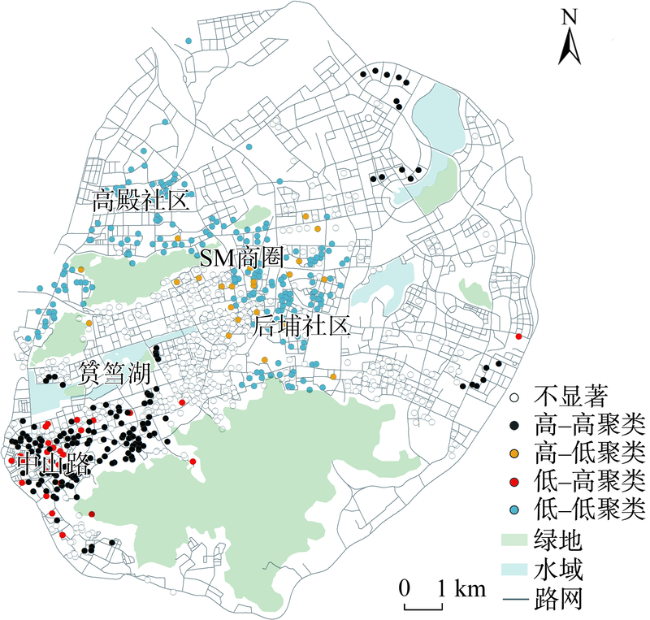
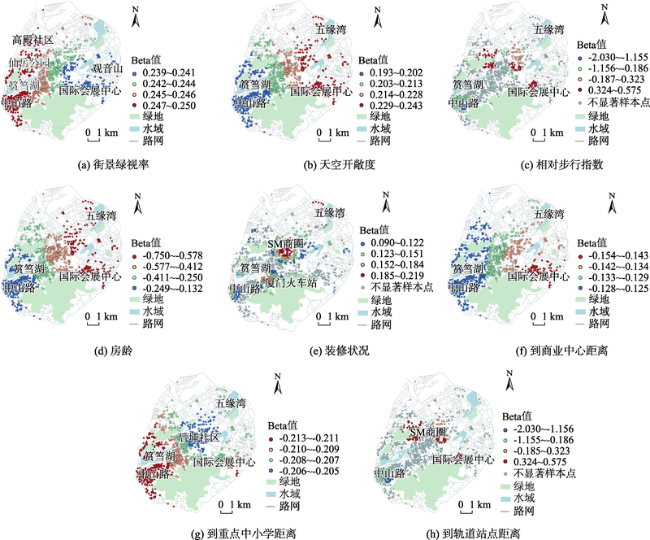
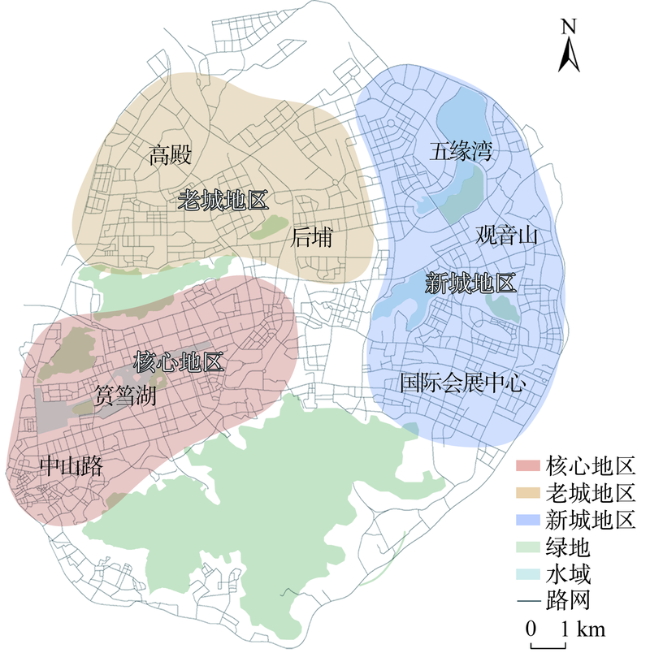
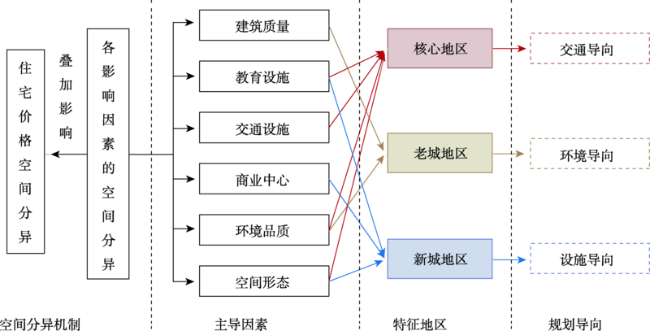
住宅价格的空间分异是城市空间资源配置不均衡的外在表现,理解住宅价格的主导影响因素及其空间分异特征对于住区规划及房价调控政策的制定具有重要意义。既有研究较少考虑环境品质对住宅价格的影响和影响因素的作用尺度差异,针对以上问题,本文引入街景图像,在特征价格模型的基础上拓展环境特征,构建多尺度地理加权回归(MGWR)模型,研究环境特征对住宅价格的影响效用,并通过分析其他控制变量的系数空间格局,总结各变量的空间分异特征规律。主要结论为:① 街景图像测度的环境特征更符合人们对居住环境的真实感知,研究结论可为居住环境品质提升提供更加精细化的设计策略; MGWR模型对变量的空间分异现象具有更接近于真实值的拟合效果,可描述不同变量的作用尺度差异,这有助于为特定地区制定针对性规划策略。② 厦门本岛住宅价格呈现显著的聚类特征,并沿城市核心发展轴呈“带状”结构分布。③ 3个环境特征变量对于住宅价格均为显著的正向影响,且作用接近全局尺度,街景绿视率的影响最强,其次是天空开敞度和相对步行指数。④ 总结各变量的系数空间分异规律,发现不同特征地区住宅价格的主导影响因素不同,核心地区主要受交通、教育因素的影响;老城地区主要为环境品质、建筑质量因素;新城地区则为区位、生活设施因素。
郭金函 , 马子迎 , 边经卫 , 江楚钶 . 基于街景图像的厦门本岛环境特征对住宅价格的影响研究[J]. 地球信息科学学报, 2022 , 24(11) : 2128 -2140 . DOI: 10.12082/dqxxkx.2022.220538
The spatial differentiation of housing price is an external expression of the unbalanced allocation of urban spatial resources. It is of great significance for formulation of residential planning and housing price control policies to understand the leading influencing factors and their spatial differentiation characteristics. Existing studies seldom consider the impact of environmental quality on housing price and the different scale effects of influencing factors. In response to the above problems, the study introduces street view imagery, adds environmental characteristic variables based on the traditional Hedonic price model, and constructs Multiscale Geographically Weighted Regression (MGWR) model to explore the impact of environmental characteristics on housing price. The spatial pattern of coefficients of other control variables are analyzed and the spatial differentiation characteristics of each variable are summarized. The main conclusions are: (1) The environmental characteristics measured by street view imagery are more consistent with people's real perception of the living environment, and the research conclusions can provide more refined strategies for improving the quality of the living environment. The MGWR model has a fitting effect on the spatial differentiation of variables closer to the real value, and it can describe the difference of action scales of different variables, which is helpful to formulate targeted planning strategies for specific regions; (2) The housing prices on Xiamen Island show significant clustering characteristics, and are distributed in a "band" structure along the city’s core development axis; (3) The three environmental characteristics variables have significant positive effects on housing prices, and the effects are close to the global scale. The impact of street view green viewing rate is the strongest, followed by sky openness and relative walkability index; (4) By summarizing the spatial differentiation rules of the coefficients of each variable, it is found that the dominant influencing factors of housing price in different characteristic areas are different. The core areas are mainly affected by traffic and education factors; the old urban areas are mainly affected by environmental quality and building quality factors; the new urban areas are mainly affected by location and living facilities.
表1 变量计算及描述性统计Tab. 1 Variable calculation and descriptive statistics |
| 特征分类 | 变量名称 | 计算指标 | 计算方式 | 均值 | 标准差 | 最小值 | 最大值 | 预期方向 | 数据源 |
|---|---|---|---|---|---|---|---|---|---|
| 建筑特征 | 建筑年代 | 房龄 | 2021年与房源建成时间之差 | 20.68 | 8.79 | 2.00 | 71.00 | 未知 | 链家二手房数据 |
| 建筑面积 | 面积 | 房源的户型面积 | 92.00 | 39.98 | 22.61 | 300.45 | 负 | ||
| 建筑质量 | 装修状况 | 虚拟变量,精装修为1,否则为0 | 0.48 | 0.50 | 0.00 | 1.00 | 正 | ||
| 梯户比例 | 楼栋电梯数与住户数的比例 | 0.46 | 0.32 | 0.02 | 6.00 | 正 | |||
| 建筑朝向 | 朝向 | 虚拟变量,朝南为1,否则为0 | 0.84 | 0.37 | 0.00 | 1.00 | 正 | ||
| 建筑高度 | 层数 | 房源所在楼栋的总层数 | 13.23 | 9.45 | 1.00 | 49.00 | 未知 | ||
| 区位特征 | 中心区位 | 到商业中心距离 | 基于ArcGIS网络分析工具,计算到商业中心的网络距离 | 1340.91 | 709.35 | 5.17 | 4354.54 | 负 | QGIS描绘 |
| 交通区位 | 路网接近度 | 基于ArcGIS平台及sDNA插件,以1 km为搜索半径,采用连续空间 算法计算,计算公式见式(3)、式(4) | 0.20 | 0.09 | 0.01 | 0.46 | 正 | OSM矢量路网 | |
| 路网穿行度 | 3.75 | 1.39 | 0.59 | 8.23 | 未知 | ||||
| 景观区位 | 到大型山水景观资源距离 | 基于ArcGIS网络分析工具,计算到景观资源的网络距离 | 1234.27 | 1165.77 | 16.04 | 5792.78 | 负 | QGIS描绘 | |
| 邻里特征 | 教育配套 | 到重点中小学距离 | 重点中小学指2022年公布的综合成绩前30名的小学和前15名的中 学[1]。基于ArcGIS网络分析工具,计算到重点中小学的网络距离 | 797.08 | 633.09 | 1.63 | 4359.14 | 负 | QGIS描绘 |
| 医疗配套 | 到三甲医院距离 | 基于ArcGIS网络分析工具,计算到三甲医院的网络距离 | 1034.88 | 714.95 | 0.21 | 4219.45 | 负 | QGIS描绘 | |
| 商务配套 | 商务办公设施密度 | 计算空间单元内的商务办公设施密度,包括银行、办公楼、政府机构、 公司企业 | 581.62 | 301.88 | 26.19 | 1533.49 | 正 | 高德POI | |
| 交通配套 | 公交线路密度 | 计算空间单元内的公交线路密度,公交线路数=站点数量×站点线路数量 | 64.14 | 28.54 | 6.30 | 172.85 | 正 | 百度API爬取 | |
| 到轨道站点距离 | 基于ArcGIS网络分析工具,计算到轨道站点的网络距离。 | 711.86 | 493.93 | 5.40 | 4270.44 | 负 | QGIS描绘 | ||
| 环境特征 | 环境绿化率 | 街景绿视率 | 计算公式见式(6) | 0.22 | 0.05 | 0.07 | 0.34 | 正 | 百度街景图像 |
| 视觉开敞度 | 天空开敞度 | 计算公式见式(7) | 0.38 | 0.05 | 0.29 | 0.55 | 正 | ||
| 空间围合度 | 街景围合度 | 计算公式见式(8) | 0.19 | 0.06 | 0.07 | 0.36 | 正 | ||
| 步行舒适性 | 相对步行指数 | 计算公式见式(9) | 0.11 | 0.02 | 0.04 | 0.16 | 正 |
表2 OLS、GWR、MGWR(2)、MGWR(1)模型回归结果对比Tab. 2 Comparison of regression results of OLS, GWR, MGWR (2) and MGWR (1) models |
| 模型指标 | OLS | GWR | MGWR(2) | MGWR(1) |
|---|---|---|---|---|
| R² | 0.262 | 0.743 | 0.789 | 0.796 |
| AICc | 2384.269 | 1795.314 | 1659.956 | 1638.076 |
| 残差平方和 | 685.304 | 238.400 | 196.292 | 189.275 |
表3 环境特征变量的回归结果统计Tab. 3 Statistics of regression results of environmental characteristics variables |
| 特征维度 | 变量 | 均值 | 标准差 | 最小值 | 中位数 | 最大值 | 带宽 | Monte Carlo检验(p-value) |
|---|---|---|---|---|---|---|---|---|
| 环境特征 | 街景绿视率 | 0.245 | 0.003 | 0.239 | 0.245 | 0.249 | 908 | 0.857 |
| 天空开敞度 | 0.210 | 0.015 | 0.193 | 0.205 | 0.243 | 882 | 0.200 | |
| 相对步行指数 | 0.133 | 0.020 | 0.091 | 0.139 | 0.155 | 851 | 0.182 |
| [1] |
宋伟轩, 毛宁, 陈培阳, 等. 基于住宅价格视角的居住分异耦合机制与时空特征——以南京为例[J]. 地理学报, 2017, 72(4):589-602.
[
|
| [2] |
|
| [3] |
|
| [4] |
古恒宇, 沈体雁, 周麟, 等. 基于GWR和sDNA模型的广州市路网形态对住宅价格影响的时空分析[J]. 经济地理, 2018, 38(3):82-91.
[
|
| [5] |
肖扬, 李志刚, 宋小冬. 道路网络结构对住宅价格的影响机制——基于“经典”拓扑的空间句法,以南京为例[J]. 城市发展研究, 2015, 22(9):6-11.
[
|
| [6] |
|
| [7] |
|
| [8] |
毛德华, 吴亚菱, 袁周炎妍, 等. 长沙市生态景观对住宅价格的影响分析[J]. 经济地理, 2018, 38(8):76-82.
[
|
| [9] |
王波, 何寿奎. 城市景观对住宅价格的空间效应研究[J]. 城市问题, 2021(10):95-102.
[
|
| [10] |
|
| [11] |
|
| [12] |
洪竞科, 苏妍, 傅晏. 城市更新项目对周边住宅价格的影响研究——以深圳市为例[J]. 现代城市研究, 2022, 37(2):112-117.
[
|
| [13] |
徐丹萌, 李欣, 张苏文. 沈阳市住房价格空间分异格局及其影响因素研究[J]. 人文地理, 2021, 36(6):125-134.
[
|
| [14] |
|
| [15] |
|
| [16] |
|
| [17] |
秦青, 吴婕. 城镇居民购房主观意愿对房价形成的影响——基于上海市2.8万户城镇居民住房需求问卷调查的分析[J]. 价格理论与实践, 2007(2):52-53.
[
|
| [18] |
钟艾妮, 答星, 喻静敏. 地理视角下深圳市房价及其影响因素研究——基于随机森林模型[J]. 城市勘测, 2022(2):66-70.
[
|
| [19] |
薛冰, 肖骁, 李京忠, 等. 基于POI大数据的老工业区房价影响因素空间分异与实证[J]. 人文地理, 2019, 34(4):106-114.
[
|
| [20] |
|
| [21] |
|
| [22] |
|
| [23] |
|
| [24] |
|
| [25] |
沈体雁, 于瀚辰, 周麟, 等. 北京市二手住宅价格影响机制——基于多尺度地理加权回归模型(MGWR)的研究[J]. 经济地理, 2020, 40(3):75-83.
[
|
| [26] |
凡来, 张大玉. 北京街区活力影响机制及空间分异特征研究——基于多尺度地理加权回归[J]. 城市规划, 2022, 46(5):27-37.
[
|
| [27] |
|
| [28] |
胡玉婷, 于一凡, 张庆来. 绿色开放空间对老年人社会交往的影响及其环境特征研究——基于上海市杨浦区公房社区的调查[J]. 上海城市规划, 2021(2):96-103.
[
|
| [29] |
|
| [30] |
魏宗财, 甄峰, 秦萧. 广州市保障房住区居住环境品质及其制度影响因素研究[J]. 地理科学, 2020, 40(1):89-96.
[
|
| [31] |
宋小冬, 李晓晗, 齐文菲, 等. 城市道路网络拓扑结构对常规公共交通的适宜性评价[J]. 城市规划学刊, 2020(4):43-50.
[
|
| [32] |
厦门城市规划设计研究院. 厦门市商业网点布局专项规划(2016-2030)[R]. 2016.
[ Xiamen Urban Planning and Design Institute. Xiamen commercial network layout special planning(2016-2030)[R]. 2020. ]
|
| [33] |
厦门市市政园林局. 公园绿地信息[EB/OL]. https://data.xm.gov.cn/opendata/datas/#/catalog_list?rprovideDept=_YLJ
[ Xiamen Municipal Bureau of Landscape Architecture. Park green space information[EB/OL]. https://data.xm.gov.cn/opendata/datas/#/catalog_list?rprovideDept=_YLJ
|
| [34] |
王振山, 张绍良, 张英, 等. 城市绿地对住宅地价的溢出效应分析——以51个绿地建设优等区城市为例[J]. 干旱区资源与环境, 2016, 30(4):24-29.
[
|
| [35] |
|
| [36] |
|
| [37] |
汤庆园, 徐伟, 艾福利. 基于地理加权回归的上海市房价空间分异及其影响因子研究[J]. 经济地理, 2012, 32(2):52-58.
[
|
| [38] |
|
| [39] |
|
/
| 〈 |
|
〉 |
