
三北工程区植被恢复对土壤风蚀的影响及植被恢复潜力研究
|
张雄一(1995— ),男,河南泌阳人,博士生,研究方向为GIS应用与生态环境评估。 E-mail: zhangxy.20b@igsnrr.ac.cn |
收稿日期: 2022-02-09
修回日期: 2022-03-16
网络出版日期: 2023-01-25
基金资助
国家重点研发计划项目(2017YFC0506501)
中国科学院战略性先导科技专项项目(XDA23100203)
Effect of Vegetation Restoration on Soil Wind Erosion and Vegetation Restoration Potential in The Three-North Afforestation Program
Received date: 2022-02-09
Revised date: 2022-03-16
Online published: 2023-01-25
Supported by
National Key Research and Development Program of China(2017YFC0506501)
Strategic Priority Research Program of Chinese Academy of Sciences(XDA23100203)
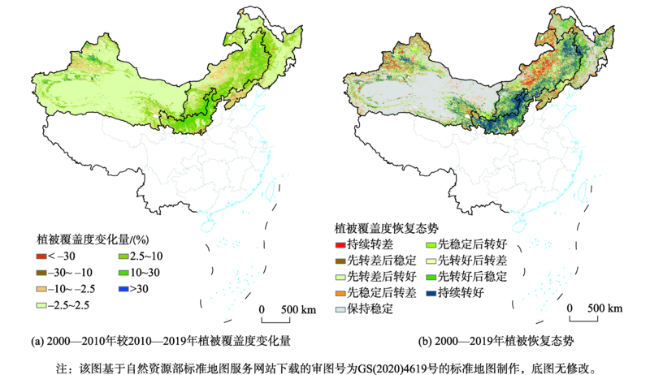
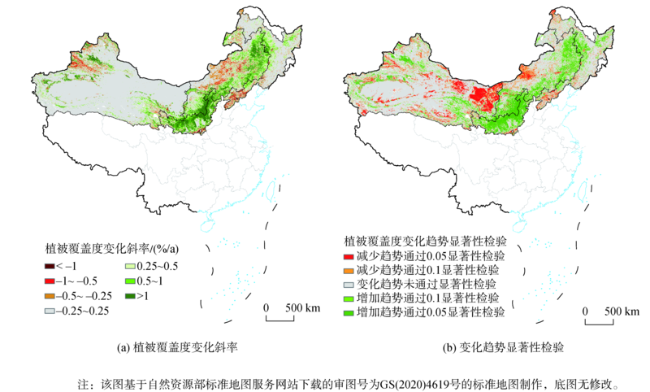
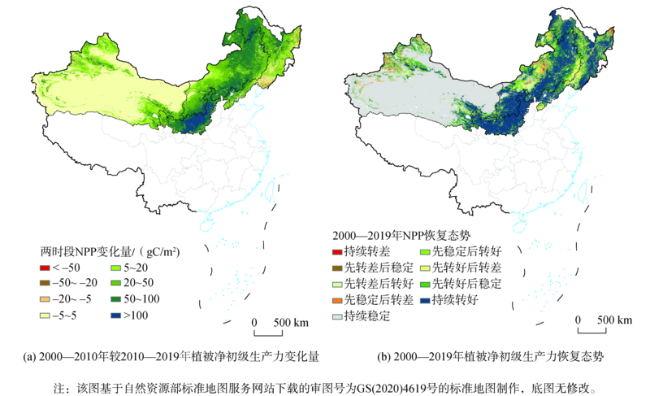
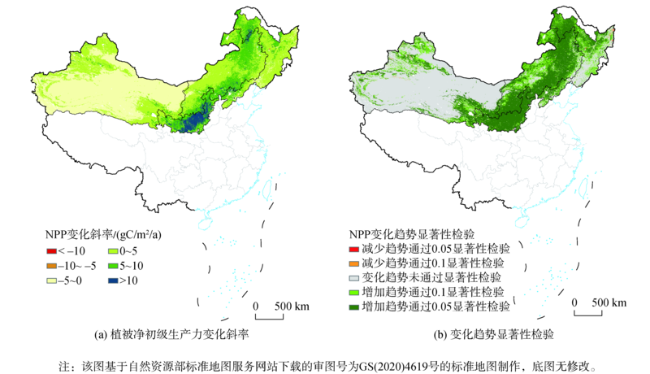
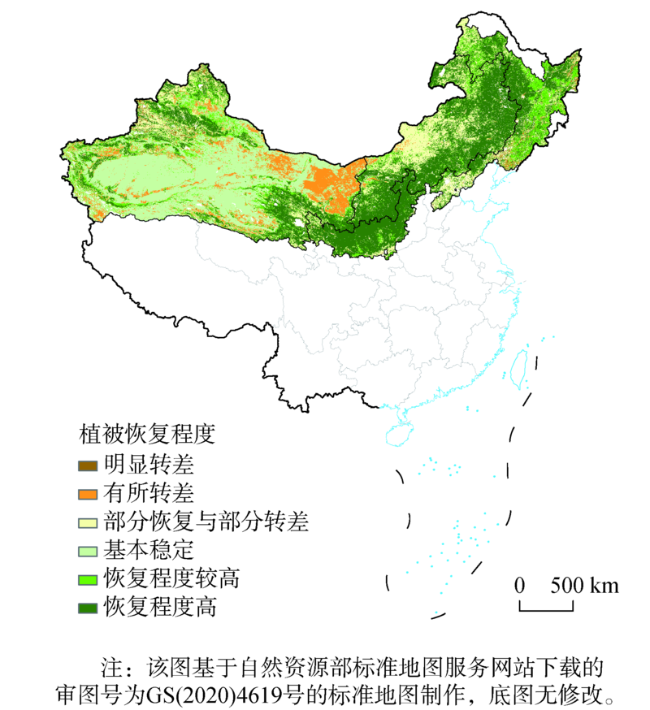
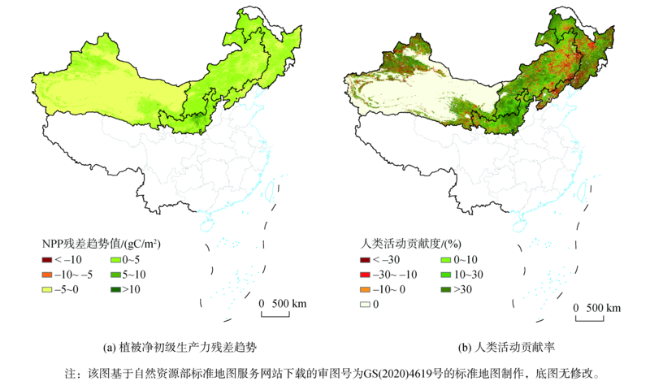
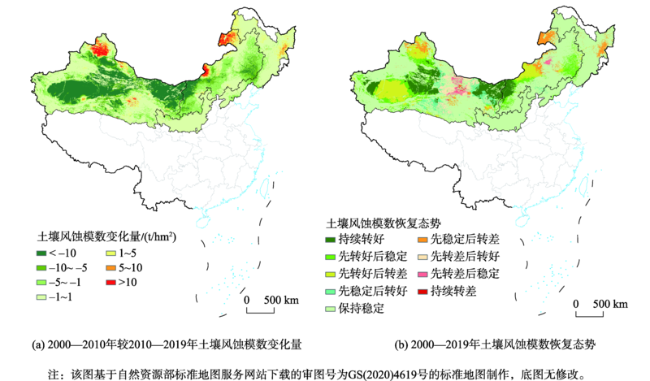
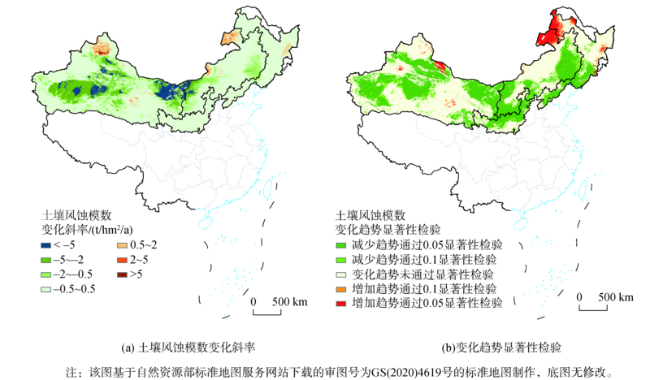
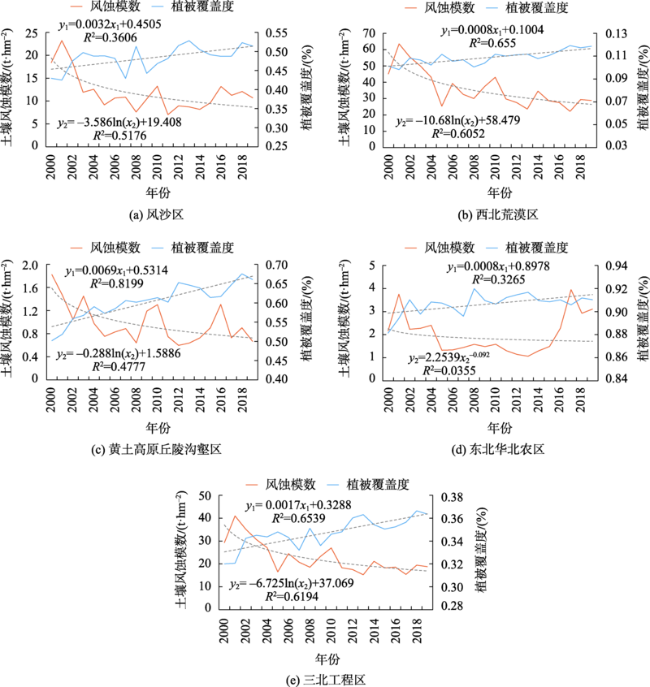
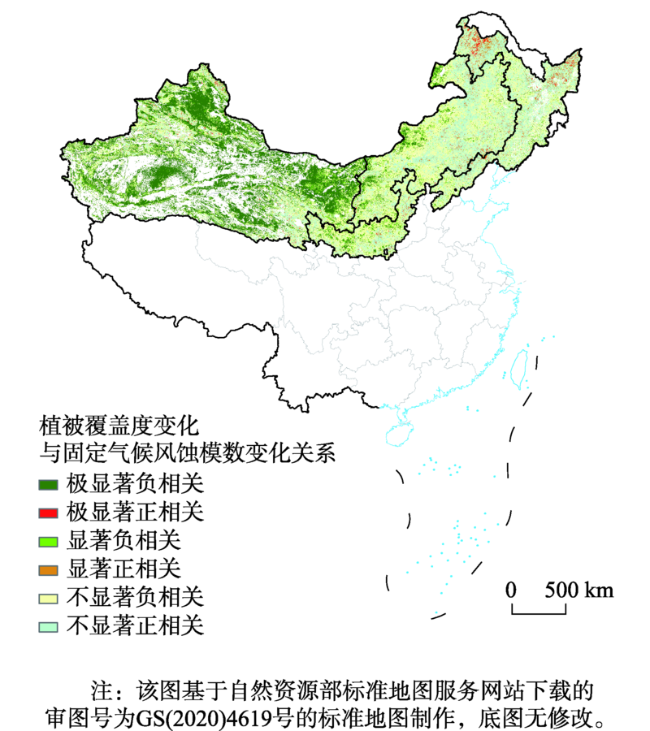
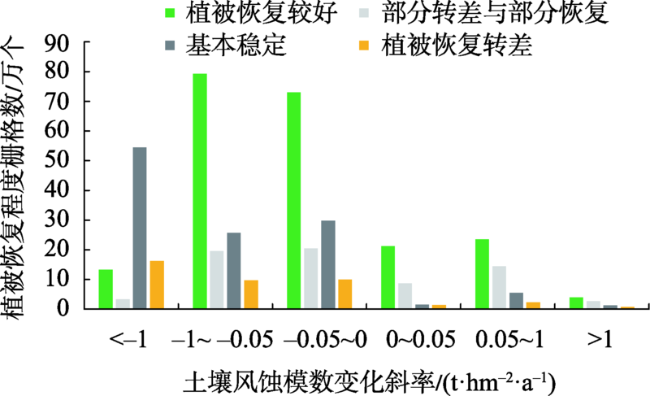
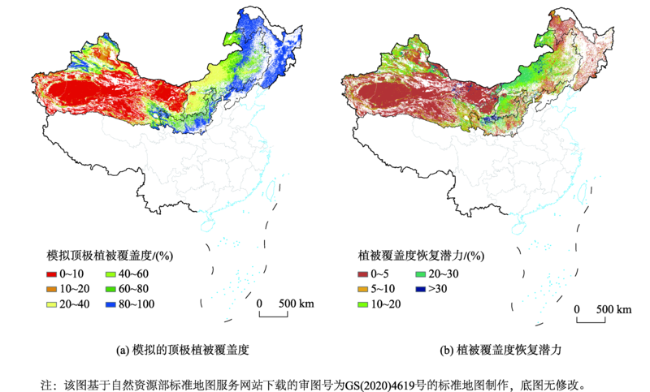
三北地区是我国重要的生态屏障,分析2000—2019年三北防护林体系建设工程(简称:三北工程)区植被恢复时空变化状况,厘定人类活动与气候要素对植被恢复的贡献,探究植被恢复对土壤风蚀影响,评估植被恢复潜力空间,可为三北防护林体系建设工程未来规划管理和科学施策提供参考。本文在选取植被覆盖度和植被净初级生产力表征植被恢复状况基础上,利用地面数据,结合模型模拟,定量评估了2000—2019年三北防护林体系建设工程区植被恢复程度及其对土壤风蚀的影响,并对植被恢复潜力进行探究。研究结果表明:① 2000—2019年植被恢复程度高、较高的面积,占总面积的35.29%和13.16%,主要分布在黄土高原区及北部区域和风沙区与东北华北平原农区的部分地区。人类活动与气候因素对植被恢复贡献率为10.45%和89.55%;② 土壤风蚀以轻度侵蚀和微度侵蚀为主,呈逐年下降趋势,剧烈侵蚀面积减少了66.45%,防风固沙服务得到进一步提升。植被恢复程度与土壤风蚀模数呈负相关关系,植被恢复程度较好有助于降低土壤风蚀模数;③ 三北工程区森林、草地和荒漠生态系统仍有8.16%的恢复潜力,内蒙古高原北部部分地区、哈顺戈壁北部和准噶尔盆地西北部及周边区域、黄土高原南部部分区域存在较大恢复潜力。

张雄一 , 邵全琴 , 宁佳 , 杨雪清 , 巩国丽 , 刘国波 . 三北工程区植被恢复对土壤风蚀的影响及植被恢复潜力研究[J]. 地球信息科学学报, 2022 , 24(11) : 2153 -2170 . DOI: 10.12082/dqxxkx.2022.220060
The Three-North Afforestation Program (TNAP) is an important ecological barrier in China, a great green wall has been built to resist sandstorms, conserve water and soil, protect agriculture, and promote animal husbandry in the north of China. In 1978, China began to build the Three-North Afforestation Program. After nearly 40 years of construction, the ecological environment has been greatly improved. However, most areas of the TNAP have sparse vegetation, insufficient annual precipitation, large evaporation, strong wind, serious desertification, and an extremely fragile ecological environment. Therefore, the ecological problems are still very prominent in some areas, and the task of ecological construction still has a long way to go. Analyzing the temporal and spatial changes of vegetation restoration in the TNAP from 2000—2019, determining the contribution of human activities and climate factors to vegetation restoration, exploring the impact of vegetation restoration on soil wind erosion, and evaluating the potential space of vegetation restoration can provide a significant reference for the future planning, management, and scientific implementation of the TNAP. In this paper, we chose the vegetation coverage and vegetation net primary productivity as the index to indicate the vegetation restoration status. Using ground data and model simulation to evaluate the degree of vegetation restoration and its impact on soil wind erosion from 2000—2019. This paper also explored the vegetation restoration potential based on the zonal climax background in the TNAP. The results showed that during 2000-2019: (1) The areas with high and higher degree of vegetation restoration accounted for 35.29% and 13.16% of the TNAP, respectively, which were mainly distributed in the Loess Plateau area, and on the north area of Loess Plateau area, and some areas of the sandstorm area and agricultural area of the Northeast-North China Plain. The vegetation restoration was mainly affected by climate factors in TNAP. The contribution rates of human activities and climate factors to vegetation restoration were 10.45% and 89.55%, respectively; (2) The main soil wind erosion degrees were mild erosion degree and micro erosion degree in the TNAP. The soil wind erosion modulus showed a downward trend year by year. The area of severe erosion has decreased by 66.45%, and the service of wind prevention and sand fixation has been further improved. The degree of vegetation restoration had a negative correlation with soil wind erosion modulus. A better degree of vegetation restoration would be helpful to reduce soil wind erosion modulus and reduce the harm of wind erosion; (3) The forest ecosystem, grassland ecosystem, desert ecosystem still had a restoration potential of 8.16% in the TNAP. Some areas in the north of Inner Mongolia Plateau, the north of Hashun Gobi, the northwest and surrounding areas of Junggar Basin, and the south of Loess Plateau had great restoration potential.
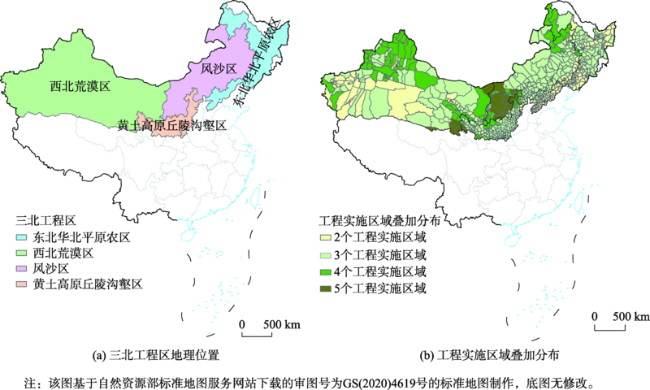
图1 三北工程区地理位置及生态工程实施区域叠加分布Fig. 1 Geographical location and spatial superposition of key ecological projects in the TNAP |
表1 三北地区重大生态工程实施重叠数量及面积统计Tab. 1 Statistics of overlapping number and area of key ecological programs in the TNAP |
| 序号 | 实施工程数量/个 | 面积/(×104 km2) | 占三北地区总面积/% |
|---|---|---|---|
| 1 | 2 | 101.49 | 22.42 |
| 2 | 3 | 232.69 | 51.40 |
| 3 | 4 | 93.75 | 20.71 |
| 4 | 5 | 24.76 | 5.47 |
表2 植被恢复趋势判断依据及结果Tab. 2 Judgment basis and result of vegetation restoration trend |
| 序号 | 判断依据 | 判断结果 | ||
|---|---|---|---|---|
| 2000—2010年 | 2010—2019年 | 2000—2019年植被恢复趋势 | ||
| 1 | 转好 | 转好 | 持续转好 | |
| 2 | 转差 | 转差 | 持续转差 | |
| 3 | 基本稳定 | 基本稳定 | 保持稳定 | |
| 4 | 转好 | 转差 | 先转好后转差 | |
| 5 | 转好 | 基本稳定 | 先转好后稳定 | |
| 6 | 转差 | 转好 | 先转差后转好 | |
| 7 | 转差 | 基本稳定 | 先转差后稳定 | |
| 8 | 基本稳定 | 转好 | 先稳定后转好 | |
| 9 | 基本稳定 | 转差 | 先稳定后转差 | |
表3 植被恢复程度判断依据Tab. 3 Judging basis of vegetation restoration degree |
| 序号 | 植被恢复程度 | 判断依据 |
|---|---|---|
| 1 | 恢复程度高 | 2个指标均转好 |
| 2 | 恢复程度较高 | 1个指标稳定与1个转好 |
| 3 | 基本稳定 | 2个指标均稳定 |
| 4 | 部分恢复与部分转差 | 1个指标转好与1个转差 |
| 5 | 有所转差 | 1个指标转差与1个稳定 |
| 6 | 明显转差 | 2个指标均转差 |
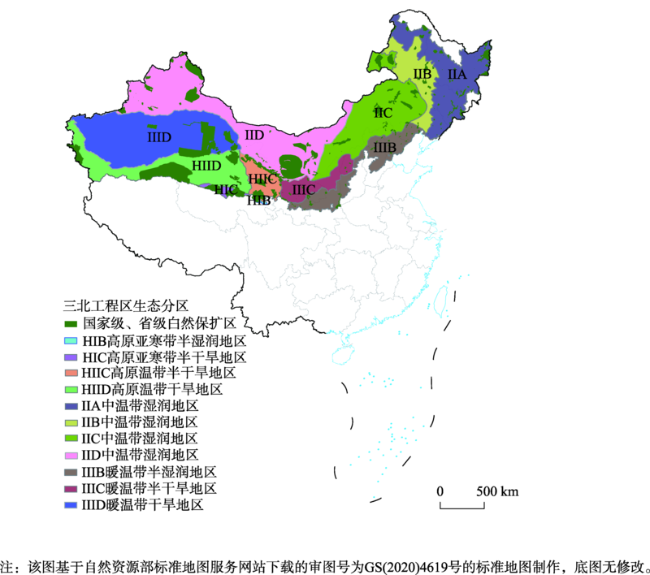
图5 三北地区生态地理分区与自然保护区空间分布Fig. 5 Spatial distribution of ecological geographical regions and nature reserves in the TNAP |
表4 三北地区不同生态系统类型植被覆盖度与气温降水的拟合方程Tab. 4 Fitting equation between fvc and temperature and precipitation of different ecosystem types in the TNAP |
| 序号 | 生态地理分区 | 生态系统类型 | 拟合方程 | R | 显著性(P) |
|---|---|---|---|---|---|
| 1 | 中温带湿润地区 | 森林 | Fcmax=97.836-0.032×temp+0×pre | 0.12 | 0.89 |
| 草地 | Fcmax=91.797+0.04×temp+0.001×pre | 0.10 | 0.92 | ||
| 荒漠 | Fcmax=10.089+1.935×temp+0.054×pre | 0.67 | <0.05 | ||
| 2 | 中温带半湿润地区 | 森林 | Fcmax=88.283+0.158×temp+0.004×pre | 0.29 | 0.49 |
| 草地 | Fcmax=42.073+1.219×temp+0.04×pre | 0.60 | <0.05 | ||
| 荒漠 | Fcmax=18.759+2.378×temp+0.03×pre | 0.50 | <0.05 | ||
| 3 | 中温带半干旱地区 | 森林 | Fcmax=67.312-0.336×temp+0.035×pre | 0.58 | <0.05 |
| 草地 | Fcmax=30.25-0.779×temp+0.062×pre | 0.71 | <0.05 | ||
| 荒漠 | Fcmax=22.857-0.512×temp+0.039×pre | 0.61 | <0.05 | ||
| 4 | 中温带干旱地区 | 森林 | Fcmax=58.346-0.144×temp+0.018×pre | 0.31 | 0.43 |
| 草地 | Fcmax=31.223+0.04×temp-0.002×pre | 0.06 | 0.97 | ||
| 荒漠 | Fcmax=5.641-0.209×temp-0.002×pre | 0.36 | <0.05 | ||
| 5 | 高原亚寒带半干旱地区 | 森林 | Fcmax=29.105-0.026×temp+0.028×pre | 0.49 | <0.05 |
| 草地 | Fcmax=9.735+0.101×temp+0.016×pre | 0.47 | <0.05 | ||
| 荒漠 | Fcmax=3.709+0.005×temp+0.006×pre | 0.52 | <0.05 | ||
| 6 | 高原亚寒带半湿润地区 | 森林 | Fcmax=71.968+0.099×temp+0.008×pre | 0.33 | <0.05 |
| 草地 | Fcmax=54.306+0.175×temp+0.012×pre | 0.40 | <0.05 | ||
| 荒漠 | Fcmax=42.198+0.446×temp+0.004×pre | 0.40 | <0.05 | ||
| 7 | 高原温带半干旱地区 | 森林 | Fcmax=70.614+0.136×temp+0.007×pre | 0.47 | <0.05 |
| 草地 | Fcmax=28.472+0.148×temp+0.013×pre | 0.56 | <0.05 | ||
| 荒漠 | Fcmax=8.654+0.073×temp+0.008×pre | 0.49 | <0.05 | ||
| 8 | 高原温带干旱地区 | 森林 | Fcmax=17.474-0.988×temp+0.015×pre | 0.29 | 0.48 |
| 草地 | Fcmax=2.730+0.016×temp+0.002×pre | 0.30 | <0.05 | ||
| 荒漠 | Fcmax=0.931+0.014×temp+0×pre | 0.13 | 0.86 | ||
| 9 | 暖温带半湿润地区 | 森林 | Fcmax=91.432+0.223×temp+0.002×pre | 0.37 | 0.41 |
| 草地 | Fcmax=71.318+0.479×temp+0.006×pre | 0.37 | <0.05 | ||
| 10 | 暖温带半干旱地区 | 森林 | Fcmax=78.465+0.625×temp+0.013×pre | 0.53 | <0.05 |
| 草地 | Fcmax=24.621+2.065×temp+0.048×pre | 0.69 | <0.05 | ||
| 11 | 暖温带干旱地区 | 森林 | Fcmax=30.948-1.564×temp+0.016×pre | 0.60 | <0.05 |
| 草地 | Fcmax=3.810-0.088×temp+0.001×pre | 0.23 | 0.63 | ||
| 荒漠 | Fcmax=0.246-0.006×temp+0.001×pre | 0.14 | 0.85 |
注:Fcmax表示顶极植被覆盖度;temp表示温度;pre表示降水。 |
表5 2000—2019年三北地区人类活动与气候因素对植被恢复贡献率Tab. 5 Contribution rate of ecological projects and climate to change of vegetation restoration from 2000 to 2019 in the TNAP |
| 区域 | 人类活动贡献率/(%) | 气候贡献率/(%) |
|---|---|---|
| 三北工程区 | 10.45 | 89.55 |
| 风沙区 | 15.05 | 84.95 |
| 东北华北平原农区 | 15.40 | 84.60 |
| 黄土高原丘陵沟壑区 | 22.44 | 77.56 |
| 西北荒漠区 | 5.80 | 94.20 |
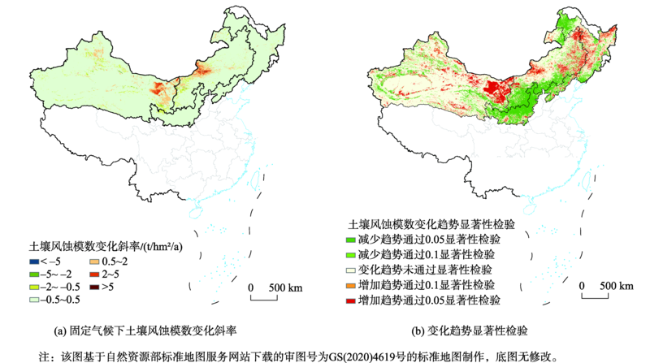
图12 2000—2010年、2010—2019年三北地区土壤风蚀模数变化量及恢复态势空间分布Fig. 12 Spatial distribution of Soil wind erosion modulus and restoration trend from 2000 to 2010 and 2010 to 2019 in the TNAP |
| [1] |
朱教君, 郑晓. 关于三北防护林体系建设的思考与展望—基于40年建设综合评估结果[J]. 生态学杂志, 2019, 38(5):1600-1610.
[
|
| [2] |
武金洲, 郑晓, 高添, 等. 三北防护林体系建设工程对科尔沁沙地社会经济影响的定量分析[J]. 生态学杂志, 2020, 39(11):3567-3575.
[
|
| [3] |
黄麟, 祝萍, 肖桐, 等. 近35年三北防护林体系建设工程的防风固沙效应[J]. 地理科学, 2018, 38(4):600-609.
[
|
| [4] |
黄麟, 曹巍, 巩国丽, 等. 2000—2010年中国三北地区生态系统时空变化特征[J]. 生态学报, 2016, 36(1):107-117.
[
|
| [5] |
巩国丽, 刘纪远, 邵全琴. 基于RWEQ的20世纪90年代以来内蒙古锡林郭勒盟土壤风蚀研究[J]. 地理科学进展, 2014, 33(6):825-834.
[
|
| [6] |
周建忠. 土壤风蚀及保护性耕作减轻沙尘暴的试验研究[D]. 北京: 中国农业大学, 2004.
[
|
| [7] |
刘玉璋, 董光荣, 李长治. 影响土壤风蚀主要因素的风洞实验研究[J]. 中国沙漠, 1992, 12(4):44-52.
[
|
| [8] |
马玉明, 姚洪林. 光电子集沙仪对毛乌素沙地沙丘蚀积过程的观测[J]. 中国沙漠, 2001, 21(S1):70-73.
[
|
| [9] |
刘汉涛, 麻硕士, 窦卫国, 等. 残茬高度对土壤风蚀量影响的试验研究[J]. 干旱地区农业研究, 2007, 25(1):30-34.
[
|
| [10] |
|
| [11] |
|
| [12] |
|
| [13] |
|
| [14] |
朱趁趁, 龚吉蕊, 杨波, 等. 内蒙古荒漠草原防风固沙服务变化及其驱动力[J]. 生态学报, 2021, 41(11):4606-4617.
[
|
| [15] |
邢丽珠, 张方敏, 邢开成, 等. 基于RWEQ模型的内蒙古巴彦淖尔市土壤风蚀变化特征及归因分析[J]. 中国沙漠, 2021, 41(5):111-119.
[
|
| [16] |
韩永伟, 拓学森, 高吉喜, 等. 黑河下游重要生态功能区防风固沙功能辐射效益[J]. 生态学报, 2010, 30(19):5185-5193.
[
|
| [17] |
董治宝, 陈渭南, 李振山, 等. 植被对土壤风蚀影响作用的实验研究[J]. 水土保持学报, 1996, 2(2):1-8.
[
|
| [18] |
张春来, 邹学勇, 董光荣, 等. 植被对土壤风蚀影响的风洞实验研究[J]. 水土保持学报, 2003, 17(3):31-33.
[
|
| [19] |
|
| [20] |
李达净, 许端阳, 丁雪, 等. 1981—2010年中国北方风蚀气候侵蚀力演变与植被动态响应[J]. 水土保持研究, 2018, 25(2):15-20.
[
|
| [21] |
黄森旺, 李晓松, 吴炳方, 等. 近25年三北防护林工程区土地退化及驱动力分析[J]. 地理学报, 2012, 67(5):589-598.
[
|
| [22] |
刘海, 刘凤, 郑粮. 气候变化及人类活动对黄河流域植被覆盖变化的影响[J]. 水土保持学报, 2021, 35(4):143-151.
[
|
| [23] |
|
| [24] |
高海东, 庞国伟, 李占斌, 等. 黄土高原植被恢复潜力研究[J]. 地理学报, 2017, 72(5):863-874.
[
|
| [25] |
赵广举, 穆兴民, 田鹏, 等. 黄土高原植被变化与恢复潜力预测[J]. 水土保持学报, 2021, 35(1):205-212.
[
|
| [26] |
吕振涛, 李生宇, 范敬龙, 等. 蒙古国植被自然恢复潜力[J]. 中国沙漠, 2021, 41(5):192-201.
[
|
| [27] |
邵全琴, 刘树超, 宁佳, 等. 2000—2019年中国重大生态工程生态效益遥感评估[J]. 地理学报, 2022, 77(9):2133-2153.
[
|
| [28] |
|
| [29] |
|
| [30] |
|
| [31] |
|
| [32] |
刘纪远, 齐永青, 师华定, 等. 蒙古高原塔里亚特-锡林郭勒样带土壤风蚀速率的137CS示踪分析[J]. 科学通报, 2007(23):2785-2791.
[
|
| [33] |
齐永青, 刘纪远, 师华定, 等. 蒙古高原北部典型草原区土壤风蚀的137Cs示踪法研究[J]. 科学通报, 2008, 53(9):1070-1076.
[
|
| [34] |
高尚玉, 张春来, 邹学勇, 等. 京津风沙源治理工程效益[M]. 北京: 科学出版社. 2008.
[
|
| [35] |
郑度. 中国生态地理区域系统研究[M]. 北京: 商务印书馆, 2008.
[
|
| [36] |
张琨, 吕一河, 傅伯杰, 等. 黄土高原植被覆盖变化对生态系统服务影响及其阈值[J]. 地理学报, 2020, 75(5):949-960.
[
|
| [37] |
赵彩霞, 郑大玮, 何文清. 植被覆盖度的时间变化及其防风蚀效应[J]. 植物生态学报, 2005, 29(1):68-73.
[
|
| [38] |
李鑫, 武志涛, 杜自强, 等. 基于不同风蚀模型的区域土壤风蚀变化及影响因素研究—以内蒙古自治区为例[J]. 水土保持学报, 2021, 35(6):69-75.
[
|
| [39] |
|
/
| 〈 |
|
〉 |