
干旱胁迫下植物抗逆性大尺度遥感监测方法
|
林艺真(1998— ),女,福建漳州人,研究生,主要从事农业遥感研究。E-mail: 1398215956@qq.com |
收稿日期: 2022-04-05
修回日期: 2022-06-01
网络出版日期: 2023-01-25
基金资助
国家自然科学基金项目(42171325)
国家自然科学基金项目(41771468)
福建省科技厅产学研项目(2020N5002)
福建省环保科技计划项目(2022R023)
Remote Sensing Monitoring Method for Plant Stress Resistance under Drought Stress on Large Scale
Received date: 2022-04-05
Revised date: 2022-06-01
Online published: 2023-01-25
Supported by
National Natural Science Foundation of China(42171325)
National Natural Science Foundation of China(41771468)
Science Bureau of Fujian Province(2020N5002)
Fujian Provincial Department of Ecology and Environment(2022R023)
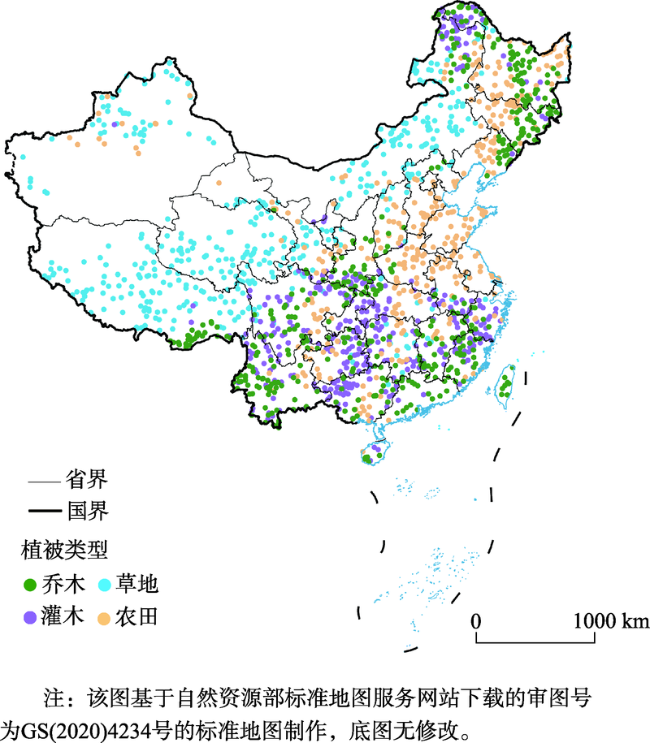
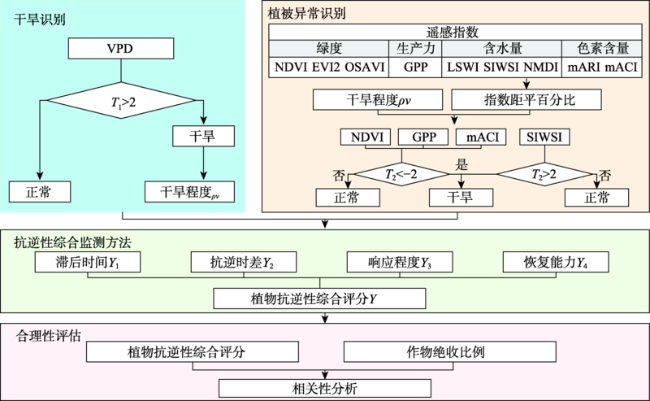
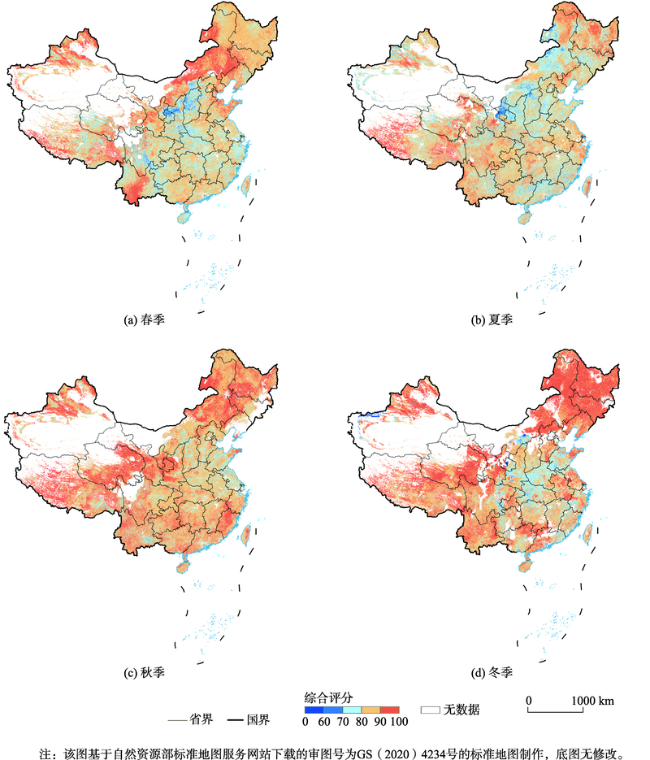
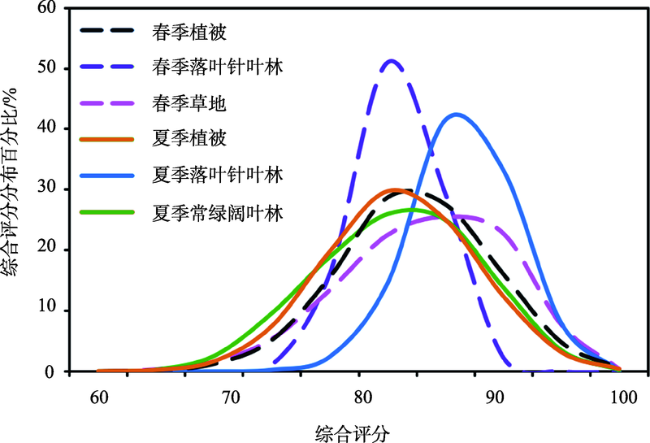
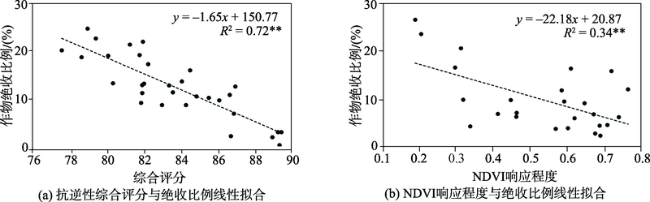
目前干旱与植被关系的研究主要集中于气候因子与植被时空变化的相关性分析以及植被对气候变化的响应,能够适用于大尺度的植物抗逆性监测方法还较为欠缺。本文基于归一化植被指数(NDVI)、总初级生产力(GPP)、修正花青素含量指数(mACI)、短波红外水分胁迫指数(SIWSI)监测干旱胁迫下的植被变化,综合考虑植物抗逆过程,建立滞后时间、抗逆时差、响应程度与恢复能力4个植物抗逆性监测指标,构建了一种能够适用于大尺度的植物抗逆性综合监测方法。利用各省份作物抗逆性综合评分与绝收比例进行相关性分析,两者呈显著负相关。利用该方法对干旱胁迫下我国不同类型植被的抗逆性进行评估,结果表明:① 从全国整体水平来看,不同季节植物抗逆性差异较大,其中夏季植物抗逆性最弱,冬季最强。我国植物抗逆性空间异质性显著,春季植物抗逆性综合评分低于70分的区域主要位于山西、陕西北部,综合评分高于90分的区域主要集中在内蒙古东北部以及云南的南部地区; ② 不同类型植被的抗逆性有明显差异,夏季落叶针叶林抗逆性最强,类内差异最小,春秋两季草地抗逆性最强但抗逆性类内差异最大。本文提出的植物抗逆性综合监测方法有助于探索干旱胁迫下植物抗逆性规律,对帮助降低灾害风险具有借鉴意义。

林艺真 , 邱炳文 , 陈芳鑫 , 黄莹泽 , 蒋范晨 , 闫超 . 干旱胁迫下植物抗逆性大尺度遥感监测方法[J]. 地球信息科学学报, 2022 , 24(11) : 2225 -2233 . DOI: 10.12082/dqxxkx.2022.220152
Current research on the relationship between drought and vegetation has focused on two aspects. One is the correlation analysis between climate factors and spatiotemporal variation of vegetation, and the other is the response of vegetation to climate change. Methods for large-scale plant stress resistance monitoring are still lacking. This study used Normalized Difference Vegetation Index (NDVI), Gross Primary Productivity (GPP), Modified Anthocyanin Content Index (mACI), and Shortwave Infrared Water Stress Index (SIWSI) to monitor vegetation changes under drought stress. A comprehensive monitoring method for plant stress resistance was constructed. This method comprehensively considered the stress resistance process of plants and established four indicators. Correlation analysis was carried out using the comprehensive score of crop stress resistance and the harvestless rate of each province. There was a negative relationship between crop stress resistance and harvestless rate. This method was applied to evaluate the resistance of different types of vegetation to drought stress in China. The results showed that: (1) Plant stress resistance varied greatly in different seasons. It was weakest in summer and strongest in winter. The spatial heterogeneity of plant stress resistance in China was significant. In spring, the regions with comprehensive scores lower than 70 were mainly located in Shanxi and northern Shaanxi. The regions with comprehensive scores higher than 90 were mainly concentrated in northeastern Inner Mongolia and the southern part of Yunnan; (2) There were obvious differences in the stress resistance of different types of vegetation. In summer, deciduous coniferous forest had the strongest stress resistance and the smallest intra-class differences. In spring and fall, grassland had the strongest stress resistance and the greatest intra-class differences. The comprehensive monitoring method of plant stress resistance is helpful to explore the law of plant stress resistance under drought stress, which provides references for helping reduce disaster risks.
表1 遥感指数Tab. 1 Remote sensing index |
| 指数类型 | 指数名称 | 计算公式 编号 |
|---|---|---|
| 表征植被长势 | 归一化植被指数[19] Normalized Difference Vegetation Index(NDVI) | (4) |
| 增强型植被指数[20] Enhanced Vegetation Index (EVI2) | (5) | |
| 优化土壤调整植被指数[21] Optimized Soil Adjusted Vegetation index(OSAVI) | (6) | |
| 表征植被生产力 | 总初级生产力 Gross Primary Productivity (GPP) | |
| 表征植被水分状况 | 地表水体指数[22] Land Surface Water Index (LSWI) | (7) |
| 短波红外水分胁迫指数[23] Shortwave Infrared Water Stress Index (SIWSI) | (8) | |
| 归一化多波段干旱指数[24] Normalized Multi-band Drought Index(NMDI) | (9) | |
| 表征植被花青素含量 | 调整花青素反射指数[25] Modified anthocyanin reflectance index(mARI) | (10) |
| 修正花青素含量指数[26] Modified Anthocyanin Content Index (mACI) | (11) |
表2 植被指数距平百分比与干旱程度的相关性Tab. 2 Correlation of the percentage of vegetation index anomalies and the degree of drought |
| NDVI | EVI2 | OSAVI | GPP | LWSI | SIWSI | NMDI | mARI | mACI | |
|---|---|---|---|---|---|---|---|---|---|
| 乔木 | 0.1793** | 0.2347** | 0.1032** | 0.2176** | 0.1728** | 0.4508** | 0.0861 | 0.1366** | 0.1019** |
| 灌木 | 0.5201** | 0.4025** | 0.2258** | 0.3889** | 0.1124** | 0.4014** | 0.1530 | 0.0981** | 0.1058** |
| 草地 | 0.3471** | 0.2710** | 0.1744** | 0.45334** | 0.3212** | 0.1548** | 0.0900 | 0.1137** | 0.1822** |
| 农田 | 0.3371** | 0.2851** | 0.0805 | 0.1594** | 0.0750 | 0.1125** | 0.1129 | 0.3650** | 0.5365** |
注:**表示p<0.05。 |
| [1] |
史培军, 李宁, 叶谦, 等. 全球环境变化与综合灾害风险防范研究[J]. 地球科学进展, 2009, 24(4):428-435.
[
|
| [2] |
|
| [3] |
|
| [4] |
|
| [5] |
安玉艳, 梁宗锁. 植物应对干旱胁迫的阶段性策略[J]. 应用生态学报, 2012, 23(10):2907-2915.
[
|
| [6] |
|
| [7] |
刘世梁, 田韫钰, 尹艺洁, 等. 云南省植被NDVI时间变化特征及其对干旱的响应[J]. 生态学报, 2016, 36(15):4699-4707.
[
|
| [8] |
曲学斌, 孙小龙, 冯建英, 等. 呼伦贝尔草原NDVI时空变化及其对气候变化的响应[J]. 干旱气象, 2018, 36(1):97-103.
[
|
| [9] |
杨舒畅, 杨恒山. 1982—2013年内蒙古地区干旱变化及植被响应[J]. 自然灾害学报, 2019, 28(1):175-183.
[
|
| [10] |
张华, 徐存刚, 王浩. 2001-2018年西北地区植被变化对气象干旱的响应[J]. 地理科学, 2020, 40(6):1029-1038.
[
|
| [11] |
|
| [12] |
|
| [13] |
李华朋, 张树清, 高自强, 等. MODIS植被指数监测农业干旱的适宜性评价[J]. 光谱学与光谱分析, 2013, 33(3):756-761.
[
|
| [14] |
杜文丽, 孙少波, 吴云涛, 等. 1980—2013年中国陆地生态系统总初级生产力对干旱的响应特征[J]. 生态学杂志, 2020, 39(1):23-35.
[
|
| [15] |
|
| [16] |
|
| [17] |
|
| [18] |
朴世龙, 方精云. 1982—1999年我国陆地植被活动对气候变化响应的季节差异[J]. 地理学报, 2003, 58(1):119-125.
[
|
| [19] |
|
| [20] |
|
| [21] |
|
| [22] |
|
| [23] |
|
| [24] |
|
| [25] |
|
| [26] |
|
| [27] |
|
| [28] |
|
| [29] |
|
/
| 〈 |
|
〉 |