
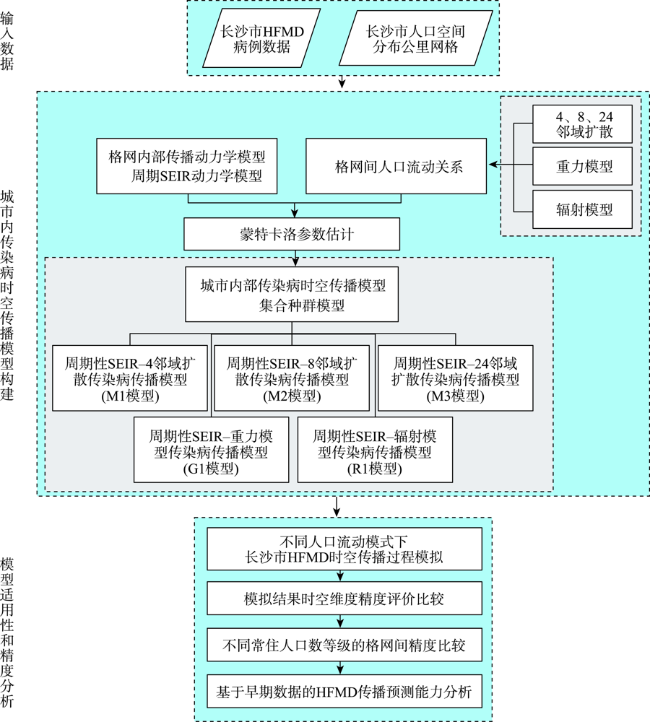
不同人口流动模式下城市传染病时空传播模型适用性研究
|
薛山(1997— ),男,山东临沂人,硕士生,主要从事空间流行病学等方面的研究。E-mail: xies@lreis.ac.cn |
收稿日期: 2022-04-25
修回日期: 2022-08-08
网络出版日期: 2023-03-25
基金资助
国家自然科学基金项目(42171419)
Research on the Applicability of Urban Infectious Disease Spatiotemporal Transmission Model Under Different Population Flow Patterns
Received date: 2022-04-25
Revised date: 2022-08-08
Online published: 2023-03-25
Supported by
Foundation item: National Natural Science Foundation of China(42171419)
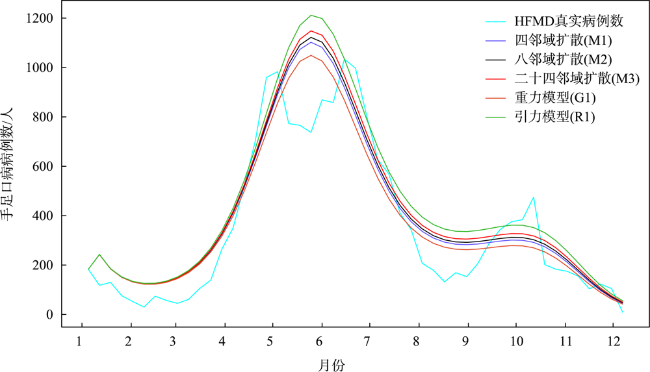
空间显式传染病传播模型由于能够较好地模拟城市内部的传染病传播过程,在城市疫情防控中得到了广泛应用。但现有的空间显式模型大多按照人口随机流动模式来模拟城市人口流动行为,未考虑城市中以通勤为主的人口流动模式。本文以长沙市的2014年第1~49周手足口病传播过程为例,将4、8、24邻域扩散以及重力模型、辐射模型共5种不同的人口流动模式与周期SEIR动力学模型结合建立起五种传染病传播模型,并通过比较模型时间和空间精度来明确不同人口流动模式应用在城市内传染病时空传播模拟中的各自优势和适用范围。实验结果表明:每种人口流动模式在城市内传染病时空传播模拟中都有其使用前提和适用范围。基于24邻域扩散的传播模型对手足口病病例数拟合精度最高( 0.58, 0.95),基于重力模型的传播模型对城市内部传染病时空传播模拟中的传播趋势的模拟精度最高( =0.46, =0.39),且对长沙市人口相对稠密区域(格网常住人口数大于第三四分位数区域)模拟具有显著的精度优势( =0.55, =0.92),但在疫情早期对手足口病未来传播的预测能力上较差。基于辐射模型的传播模型作为无参数模型,虽然整体时空精度上表现欠佳,但在人口稠密区域显现出较好的拟合效果( =0.50, =1.0),在五种模型中具有最佳的手足口病传播预测能力。
关键词: 空间显式传染病传播模型; 人口流动模式; 邻域扩散; 重力模型; 辐射模型; 城市内传染病传播模拟; 长沙市
薛山 , 廖一兰 , 李春林 , 胡艺 . 不同人口流动模式下城市传染病时空传播模型适用性研究[J]. 地球信息科学学报, 2023 , 25(1) : 208 -222 . DOI: 10.12082/dqxxkx.2023.220221
The spatially explicit infectious disease transmission model has been widely used in urban epidemic prevention and control since it can better simulate the transmission processes of infectious diseases in cities. However, most of the existing spatially explicit models simulate the flow behavior of urban population based on the random population flow pattern, and do not consider the commuting-based population flow pattern in the city. Taking the Hand, Foot, and Mouth Disease (HFMD) transmission process in Changsha city from the 1st to the 49th week of 2014 as an example, this paper combines periodic SEIR dynamic models with five different population flow models including 4, 8, 24 adjacent diffusion models, gravity model, and radiation model. Thus, five infectious disease transmission models are formed, and the respective advantages and applicable scope of different transmission models are clarified by comparing their temporal and spatial accuracy. The experimental results show that each model has its premise and scope of application. The transmission model based on 24-neibor diffusion has the highest fitting accuracy of the number of HFMD cases ( 0.58, ). The model based on gravity model achieves the highest accuracy in simulating the transmission trend of HFMD in Changsha ( =0.46, =0.39), with even higher simulation accuracy in the relatively densely populated areas in Changsha (the grid resident population is greater than the third quartile area) ( =0.55, =0.92). But its prediction ability of HFMD transmission in the early stage of HFMD epidemic is poor. The transmission model based on the radiation model is a parameter-free model, although its overall spatial-temporal accuracy is not high, it shows a good fitting effect in densely populated areas ( =0.50, =1.04) and has the best HFMD transmission prediction ability among the five models.
表1 周期SEIR动力学模型参数Tab. 1 Parameters of periodic SEIR model |
| 参数名称 | 参数定义 |
|---|---|
| 0—5岁常住人口数/人 | |
| 日历周数/周 | |
| 易感人群, 潜伏期人群, 感染人群, 恢复期人群数量/人 | |
| 长沙市2014年出生率,死亡率/% | |
| 潜伏期人群中每个个体在潜伏期状态到感染状态的平均时间/周 | |
| 感染人群中每个个体在感染状态到获得免疫的平均时间(恢复期)/周 | |
| HFMD传播率 | |
| 周期函数截距项 | |
| , | 周期函数振幅 |
| , | 周期函数半年、一年周期相位值 |
表2 人口流动模式参数Tab. 2 Parameters of population movement patterns |
| 参数名称 | 参数定义 |
|---|---|
| 格网之间的人口流动数/人 | |
| 重力模型归一化系数 | |
| , | 格网中的0—5岁常住人口数/人 |
| 格网中心之间的欧式距离/千米 | |
| 重力模型矫正因子,反映居住地、目的地格网的常住人口数以及格网距离对人口流动的影响 | |
| 格网的出行人口总数/人 | |
| 以 格网的中心点为圆心, 为半径的圆形区域内所有格网的常住人口总和/人 | |
| 4邻域扩散中S、E、I、R四种人群流出比例/% | |
| 8邻域扩散中S、E、I、R四种人群流出比例/% | |
| 24邻域扩散中S、E、I、R四种人群流出比例/% |
表3 参数估计结果Tab. 3 Parameters estimation results |
| 所属模型 | 参数 | 初始范围 | 最优参数值 |
|---|---|---|---|
| 周期性SEIR动力学模型 | (0.5, 1.5) | 1.08 | |
| (0, 0.5) | 0.13 | ||
| (0, 0.5) | 0.13 | ||
| (0, 26.0) | 13.02 | ||
| (0, 52.0) | 18.95 | ||
| 4邻域扩散模型 | (0, 1.0) | 0.39 | |
| (0, 1.0) | 0.53 | ||
| (0, 1.0) | 0.22 | ||
| (0, 1.0) | 0.48 | ||
| 8邻域扩散模型 | (0, 1.0) | 0.42 | |
| (0, 1.0) | 0.45 | ||
| (0, 1.0) | 0.20 | ||
| (0, 1.0) | 0.46 | ||
| 24邻域扩散模型 | (0, 1.0) | 0.36 | |
| (0, 1.0) | 0.49 | ||
| (0, 1.0) | 0.24 | ||
| (0, 1.0) | 0.51 | ||
| 重力模型 | (0,0.01) | 6.82e-4 | |
| (1.0, 2.0) | 1.03 | ||
| (1.0, 2.0) | 1.05 | ||
| (1.0, 3.0) | 1.48 |
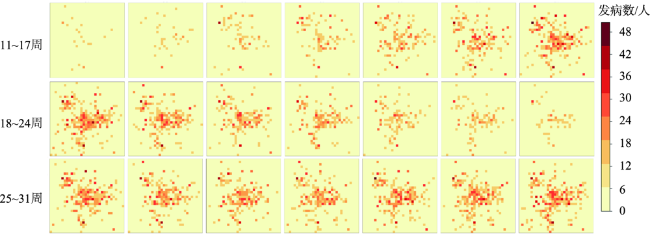
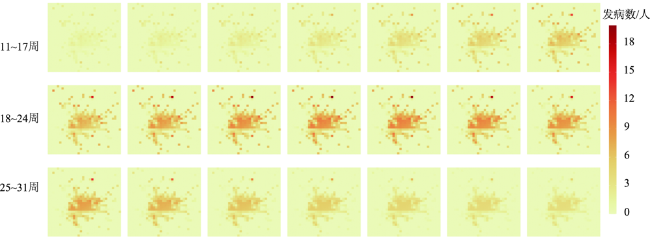
图4 长沙市2014年手足口病病例时空分布Fig. 4 Spatial and temporal distribution of HFMD cases in Changsha in 2014 |
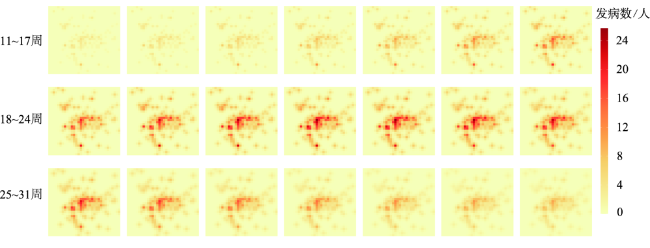
图5 模拟长沙市2014年HFMD病例时空分布图(M1模型)Fig. 5 Simulation of spatial and temporal distribution of HFMD cases in Changsha in 2014 by M1 model |
图6 模拟长沙市2014年HFMD病例时空分布图(M2模型)Fig. 6 Simulation of spatial and temporal distribution of HFMD cases in Changsha in 2014 by M2 model |
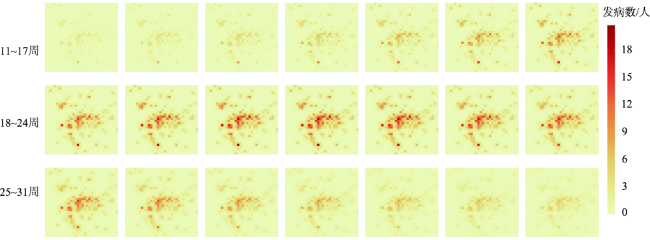
图7 模拟长沙市2014年HFMD病例时空分布图(M3模型)Fig. 7 Simulation of spatial and temporal distribution of HFMD cases in Changsha in 2014 by M3 model |
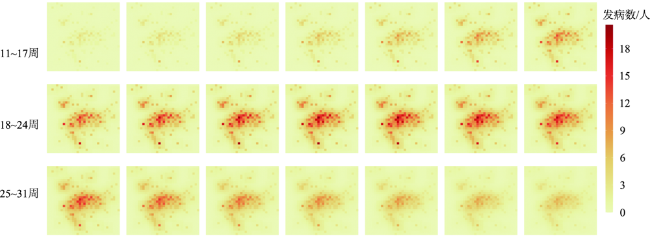
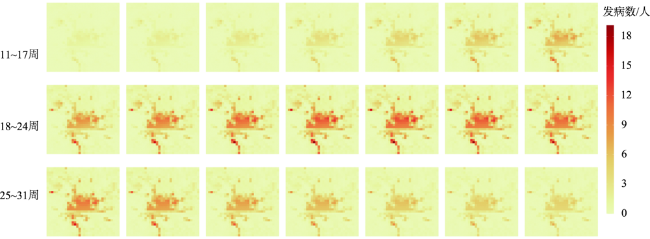
图8 模拟长沙市2014年HFMD病例时空分布图(G1模型)Fig. 8 Simulation of spatial and temporal distribution of HFMD cases in Changsha in 2014 by G1 model |
表4 基于相关系数r的时空间维度精度评价Tab. 4 Evaluation of temporal and spatial accuracy based on correlation coefficient r |
| 模型名称 | 标准差 | 标准差 | |||
|---|---|---|---|---|---|
| N1 | 0.87 | 0.41 | 0.11 | 0.30 | 0.21 |
| N2 | 0.88 | 0.40 | 0.12 | 0.30 | 0.20 |
| N3 | 0.89 | 0.41 | 0.11 | 0.33 | 0.22 |
| G1 | 0.91 | 0.46 | 0.11 | 0.39 | 0.20 |
| R1 | 0.88 | 0.37 | 0.09 | 0.34 | 0.19 |
表5 基于RMSE的时空间维度精度评价Tab. 5 Evaluation of temporal and spatial accuracy based on RMSE |
| 模型名称 | 标准差 | 标准差 | |||
|---|---|---|---|---|---|
| N1 | 113.67 | 0.96 | 0.65 | 0.59 | 1.02 |
| N2 | 118.22 | 0.97 | 0.64 | 0.61 | 1.00 |
| N3 | 120.19 | 0.95 | 0.63 | 0.58 | 0.96 |
| G1 | 122.58 | 1.00 | 0.65 | 0.57 | 1.02 |
| R1 | 130.14 | 1.08 | 0.75 | 0.69 | 1.07 |
表6 不同常住人口水平下模拟精度比较Tab. 6 Simulaiton accuracy under different levels of resident populations |
| 格网人口数 | 模型名称 | 标准差 | 标准差 | ||
|---|---|---|---|---|---|
| 最小值-Q1 | M1 | 0.30 | 0.21 | 0.38 | 0.69 |
| M2 | 0.28 | 0.22 | 0.38 | 0.69 | |
| M3 | 0.31 | 0.22 | 0.41 | 0.65 | |
| G1 | 0.27 | 0.17 | 0.43 | 0.83 | |
| R1 | 0.21 | 0.22 | 0.42 | 0.75 | |
| Q1-Q2 | M1 | 0.22 | 0.23 | 0.40 | 1.29 |
| M2 | 0.21 | 0.24 | 0.41 | 1.24 | |
| M3 | 0.24 | 0.24 | 0.42 | 1.26 | |
| G1 | 0.27 | 0.25 | 0.47 | 0.93 | |
| R1 | 0.22 | 0.17 | 0.47 | 1.52 | |
| Q2-Q3 | M1 | 0.24 | 0.22 | 0.44 | 0.64 |
| M2 | 0.24 | 0.23 | 0.42 | 0.59 | |
| M3 | 0.25 | 0.22 | 0.45 | 0.59 | |
| G1 | 0.29 | 0.20 | 0.41 | 0.66 | |
| R1 | 0.25 | 0.22 | 0.50 | 0.56 | |
| Q3-最大值 | M1 | 0.44 | 0.21 | 1.19 | 1.01 |
| M2 | 0.44 | 0.21 | 1.18 | 0.99 | |
| M3 | 0.42 | 0.23 | 1.12 | 0.91 | |
| G1 | 0.55 | 0.22 | 0.92 | 0.83 | |
| R1 | 0.50 | 0.22 | 1.00 | 0.85 |
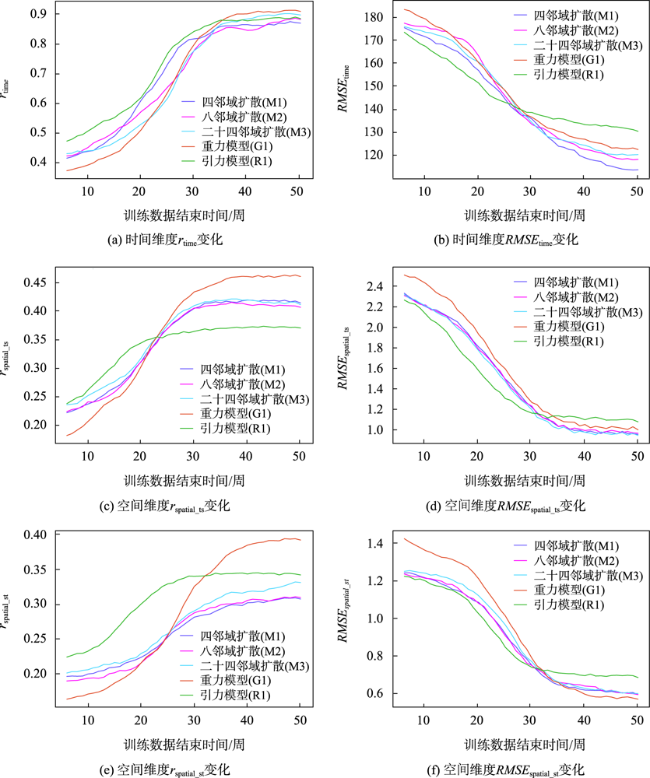
图10 前 周数据参数估计模型的HFMD传播预测精度验证分析可得:①在整体上,基于重力模型的G1模型在对HFMD空间传播趋势的拟合效果上优于其余4种模型,而基于邻域扩散3种模型则对HFMD格网病例数具有较好的拟合效果,其中24邻域扩散的M3模型拟合效果最优。②在根据常住人口数对格网进行划分后,G1和R1两种模型的拟合效果对格网的常住人口数较为敏感,在常住人口数较高水平的格网的拟合效果显著优于基于邻域扩散的3种模型。③基于重力模型的G1模型的拟合效果依赖于训练数据的时间长度,而基于辐射模型的R1模型则在早期数据训练下即可得到较高的拟合精度,在4种模型具有最好的早期HFMD传播预测能力。 Fig. 10 HFMD transmission simulation verification based on parameter estimation model by first N weeks' data |
| [1] |
World Health Organization. The world health report 2000: health systems: Improving performance[M]. Geneva: World Health Organization, 2000.
|
| [2] |
|
| [3] |
|
| [4] |
|
| [5] |
|
| [6] |
|
| [7] |
徐致靖, 祖正虎, 许晴, 等. 传染病动力学建模研究进展[J]. 军事医学, 2011, 35(11):828-833.
[
|
| [8] |
张发, 李璐, 宣慧玉. 传染病传播模型综述[J]. 系统工程理论与实践, 2011, 31(9):1736-1744.
[
|
| [9] |
|
| [10] |
|
| [11] |
|
| [12] |
毕雪, 苏弘博, 郭佳慧, 等. 元胞自动机及其在传染病防控领域中的应用[J]. 实用预防医学, 2015, 22(6):766-769.
[
|
| [13] |
|
| [14] |
|
| [15] |
|
| [16] |
|
| [17] |
尹凌, 刘康, 张浩, 等. 耦合人群移动的COVID-19传染病模型研究进展[J]. 地球信息科学学报, 2021, 23(11):1894-1909.
[
|
| [18] |
裴韬, 王席, 宋辞, 等. COVID-19疫情时空分析与建模研究进展[J]. 地球信息科学学报, 2021, 23(2):188-210.
[
|
| [19] |
张浩, 尹凌, 刘康, 等. 深圳市快速抑制COVID-19疫情的非药物干预措施效果评估:基于智能体的建模研究[J]. 地球信息科学学报, 2021, 23(11):1936-1945.
[
|
| [20] |
|
| [21] |
|
| [22] |
|
| [23] |
周素红, 杨利军. 广州城市居民通勤空间特征研究[J]. 城市交通, 2005, 3(1):62-67.
[
|
| [24] |
刘耀林, 方飞国, 王一恒. 基于手机数据的城市内部就业人口流动特征及形成机制分析——以武汉市为例[J]. 武汉大学学报·信息科学版, 2018, 43(12):2212-2224.
[
|
| [25] |
刘云舒, 赵鹏军, 吕迪. 大数据城市通勤交通模型的构建与模拟应用[J]. 地球信息科学学报, 2021, 23(7):1185-1195.
[
|
| [26] |
|
| [27] |
长沙市城乡规划局. 《长沙市城市总体规划(2003-2020)(2014年修订)》公布[J]. 城市规划通讯, 2014,(16):11-2.
[Urban and Rural Planning Bureau of Changsha City. "Master Plan of Changsha City (2003-2020) (Revised in 2014)" announced[J]. Urban Planning Newsreport, 2014,(16):11-2. ]
|
| [28] |
徐新良. 中国人口空间分布公里网格数据集[DS]. 中国科学院资源环境科学数据中心数据注册与出版系统 (http://www.resdc.cn/DOI), 2017.
[
|
| [29] |
|
| [30] |
胡跃华, 肖革新, 郭莹, 等. 2008—2011年中国大陆手足口病流行特征分析[J]. 中华疾病控制杂志, 2014, 18(8):693-697,747.
[
|
| [31] |
长沙市统计局. 长沙市国民经济和社会发展统计公报2014[EB/OL]. http://tjj.hunan.gov.cn/tjfx/tjgb/szgb/zss_1/201507/t20150717_4326868.html.
[Changsha Municipal Bureau of Statistics. Statistical Bulletin on the Economic and Social Development of Changsha City in 2014[EB/OL]. http://tjj.hunan.gov.cn/tjfx/tjgb/szgb/zss_1/201507/t20150717_4326868.html. ]
|
| [32] |
|
| [33] |
|
| [34] |
|
| [35] |
|
/
| 〈 |
|
〉 |