
地形扫描数据TIN模型生成DEM的误差计算方法
|
师长兴(1963— ),男,河北正定人,博士,研究员,主要从事河流地貌、流域物质迁移与环境变化等研究。E-mail: shicx@igsnrr.ac.cn |
收稿日期: 2022-07-04
修回日期: 2022-08-31
网络出版日期: 2023-03-25
基金资助
国家自然科学基金项目(41971008)
国家自然科学基金项目(41671004)
A Method of Estimating Errors of DEM Constructed from Topographic Scanning Data by TIN Model
Received date: 2022-07-04
Revised date: 2022-08-31
Online published: 2023-03-25
Supported by
National Natural Science Foundation of China(41971008)
National Natural Science Foundation of China(41671004)
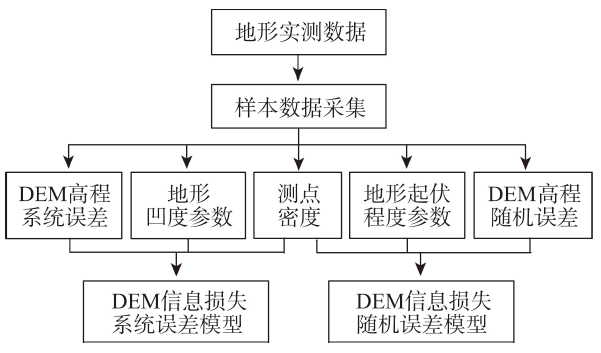
由地表三维空间数据生产的数字高程模型(DEM)的误差包括从数据误差传递来的误差和因数据数量不足以反映地形起伏造成的信息损失误差。本文给出了由三维空间数据的不规则三角网(TIN)模型栅格化为DEM过程中,通过线性插值将数据随机误差传递到DEM栅格上的随机误差的解析解,同时利用地基激光扫描仪测量的冲沟地形数据点云,分析得出因信息损失产生的DEM系统和随机误差的估算方法。结果显示信息损失产生的DEM平均高程系统误差和随机误差都与有效测点密度有关,其中有效测点由TIN中包含DEM栅格中心点的所有三角面的3个顶点组成;信息损失产生的DEM平均高程系统误差和随机误差除与有效测点密度相关外,还与地形特征有关,平均高程系统误差与地形整体凹度参数有关,随机误差与地形整体起伏程度参数有关。建立了分辨率为0.1 m×0.1 m 的DEM误差估算模型。

师长兴 . 地形扫描数据TIN模型生成DEM的误差计算方法[J]. 地球信息科学学报, 2023 , 25(1) : 40 -48 . DOI: 10.12082/dqxxkx.2023.220475
The errors of DEM derived from scattered topographic scanning data can be divided into errors propagated from topographic data to raster nodes and errors caused by information loss owing to scattered measuring data being incapable of completely reproducing the terrain surface. This study gave an analytical solution of DEM random errors propagated from data random errors in rasterizing the Triangulated Irregular Network (TIN) model by linear interpolation. Moreover, using the topographic scanning data of gullies recorded by a Terrestrial Laser Scanner (TLS), a method was derived for estimating the systematic and random errors caused by information loss in constructing DEM from the TIN model. The results show that both the mean systematic error and random error resulting from information loss are related to the density of effective measuring points which are located at the vertexes of triangles of the TIN model with at least a node of DEM inside them. Besides, the two kinds of errors are also related to terrain characteristics, among which the mean concavity has an impact on the mean systematic error and the terrain roughness affects the random error. For the DEM with a resolution of 0.1 m×0.1 m, the mean systematic error (Hd, in meter) can be estimated by , and the random error at a DEM node (σt, in meter) can be calculated as , where Cm is the mean concavity defined as the mean of total height difference (ΔZd, in meter) between surrounding eight grids and the middle grid in a 3×3 sliding window, Dep is the density of effective points (points/dm2), σz is the analytical solution of the random error at a DEM node propagated from data random errors, and Csd is the terrain roughness defined as the standard deviation of the parameter ΔZd.

图2 黄河支流东柳沟和皇甫川流域中2条冲沟晕渲地形Fig. 2 Shaded-relief of the measured two gullies in the Dongliugou and Huangfuchuan watersheds in the Yellow River basin |
表1 黄河支流东柳沟和皇甫川流域中2条冲沟和观测数据简况Tab. 1 Briefs of the measured two gullies in the Dongliugou and Huangfuchuan watersheds in the Yellow River basin and the topographic scanning data |
| 冲沟面积/m2 | 沟头至沟口高差/m | 冲沟内测点总数/pts | 测点平均密度/(pts/dm2) | 站位配准误差/m | |
|---|---|---|---|---|---|
| 东柳沟冲沟 | 547.3 | 13.0 | 670 797 | 12.26 | 0.0052 |
| 皇甫川冲沟 | 3011.6 | 37.6 | 2 512 519 | 8.34 | 0.0011 |
图4 不同有效点密度下高差均值Hd与地形凹度参数Cm均值的关系注:不同点符号代表不同的有效点密度/( pts/dm2)。 Fig. 4 The relations between mean elevation difference (Hd) and terrain concavity parameter (Cm) under different effective point densities (pts/dm2) represented by different symbols in each sheet |
图6 高差均方差SHd与有效测点密度Dep的关系Fig. 6 The relation between standard deviation of mean elevation difference (SHd) and effective point density (Dep) |
图7 不同有效点密度下高差均方差SHd与SDHD及其与Csd的关系注:不同点符号代表不同的有效点密度/(pts/dm2)。 Fig. 7 The relations of standard deviation of mean elevation difference (SHd) with terrain roughness parameters SDHD and Csd under different effective point densities (pts/dm2) represented by different symbols in each sheet |
表2 高差均方差SHd与SDHD及其与Csd的相关关系决定系数Tab. 2 The determination coefficients of relations of standard deviation of mean elevation difference (SHd) with terrain roughness parameters SDHD and Csd under different effective point densities |
| 有效点密度/(pts/dm2) | SHd~SDHD | SHd~Csd | |||
|---|---|---|---|---|---|
| 线性关系 | 幂指数关系 | 线性关系 | 幂指数关系 | ||
| 0.014 | 0.783 | 0.792 | 0.834 | 0.836 | |
| 0.027 | 0.635 | 0.642 | 0.841 | 0.839 | |
| 0.054 | 0.849 | 0.857 | 0.985 | 0.984 | |
| 0.109 | 0.906 | 0.898 | 0.914 | 0.917 | |
| 0.217 | 0.908 | 0.913 | 0.979 | 0.982 | |
| 0.429 | 0.890 | 0.890 | 0.966 | 0.971 | |
| 0.830 | 0.866 | 0.865 | 0.980 | 0.981 | |
| 1.50 | 0.843 | 0.833 | 0.936 | 0.925 | |
| 2.33 | 0.722 | 0.717 | 0.874 | 0.867 | |
| 2.87 | 0.685 | 0.684 | 0.738 | 0.740 | |
| 2.99 | 0.859 | 0.873 | 0.895 | 0.906 | |
| [1] |
|
| [2] |
|
| [3] |
|
| [4] |
|
| [5] |
|
| [6] |
周小荃, 余宏亮, 魏玉杰, 等. 无人机倾斜航空摄影监测崩岗侵蚀量变化的方法[J]. 农业工程学报, 2019, 35(21):51-59.
[
|
| [7] |
|
| [8] |
|
| [9] |
|
| [10] |
王江涛. 地面三维激光扫描数据的DEM重建精度分析[J]. 地理空间信息, 2019, 17(12):99-102,117,11.
[
|
| [11] |
贾雨欣, 李剑南, 张磊, 等. 复杂地形区像控点布设对低空无人机遥感成图的精度影响研究[J]. 北京测绘, 2020, 34(7):890-894.
[
|
| [12] |
兰寒玉. 低空无人机摄影测量精度分析[J]. 测绘与空间地理信息, 2021, 44(12):167-171.
[
|
| [13] |
黄小川, 郑慧. 地面三维激光雷达点云误差分析及校正方法[J]. 地理空间信息, 2009, 7(5):95-97.
[
|
| [14] |
杨忞婧. 地面三维激光扫描仪的测量误差分析[J]. 东华理工大学学报(自然科学版), 2013, 36(2):228-232.
[
|
| [15] |
|
| [16] |
|
| [17] |
徐志敏, 王利双. DEM地形描述精度的幂函数定量模型[J]. 遥感信息, 2021, 36(3):39-43.
[
|
| [18] |
李国重, 张国芹, 朱长青. DEM线性建模过程中的高程误差传播[J]. 测绘科学技术学报, 2009, 26(4):283-287.
[
|
/
| 〈 |
|
〉 |