
基于多尺度地理加权回归的土壤镉污染局部影响因子分析
|
吴子豪(1994— ),男,安徽蚌埠人,博士,讲师,主要从事土壤遥感与数字制图。 E-mail: wuzh@cumt.edu.cn |
收稿日期: 2022-09-10
修回日期: 2022-10-17
网络出版日期: 2023-04-19
基金资助
国家自然科学基金项目(42201447)
Analysis of Local Influencing Factors of Cadmium Pollution in Soil by Using Multi-scale Geographically Weighted Regression
Received date: 2022-09-10
Revised date: 2022-10-17
Online published: 2023-04-19
Supported by
National Natural Science Foundation of China(42201447)
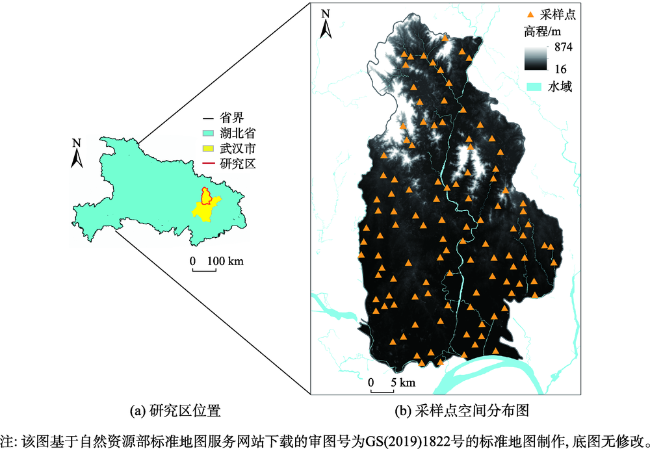
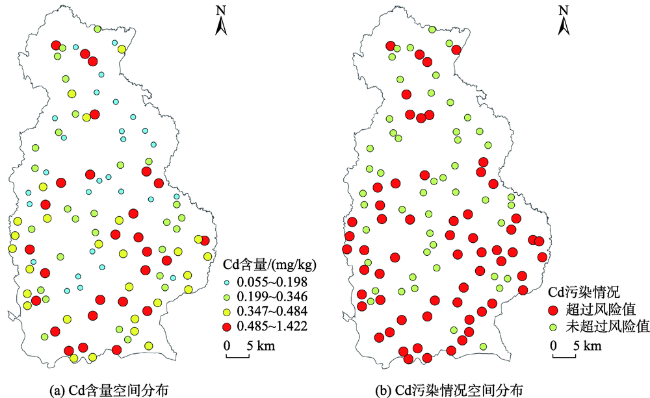
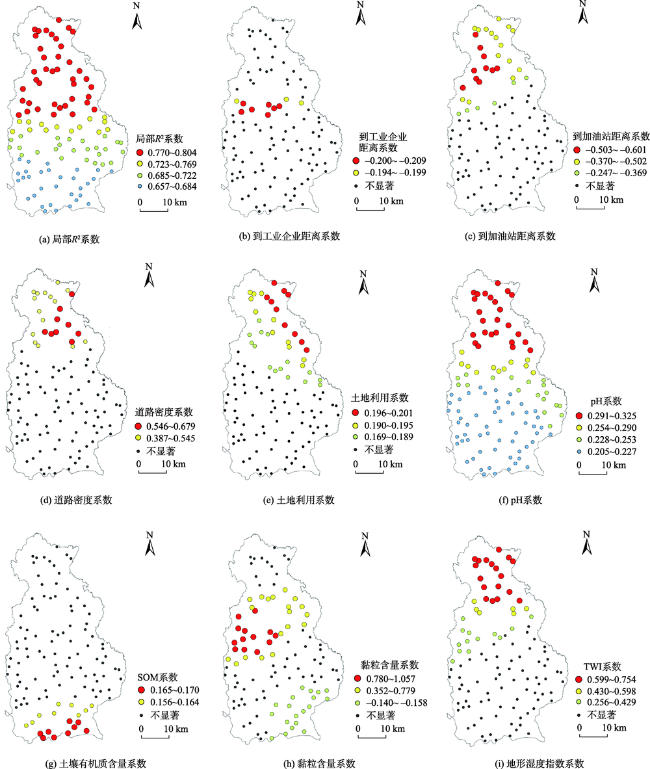
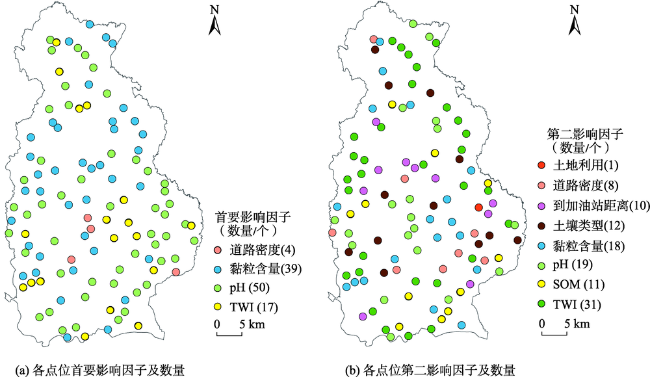
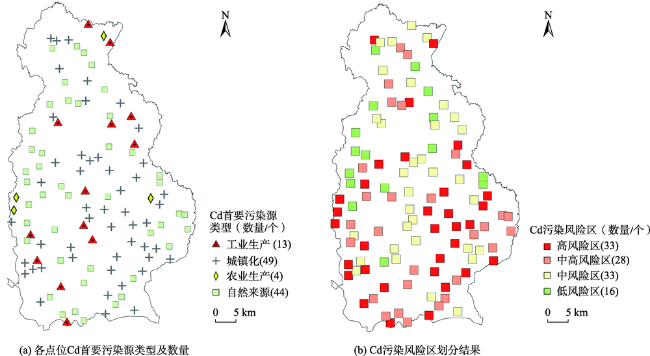
探明土壤镉(Cd)在不同空间位置的影响因子和污染来源,对于防控土壤Cd污染、保障粮食安全和城市居民健康有重要意义。多尺度地理加权回归(Multi-scale Geographically Weighted Regression,MGWR)在传统地理加权回归模型的基础上考虑了不同解释变量的差异化作用尺度,是识别目标变量局部影响因子的有效方法,但尚未应用于土壤重金属污染研究。因此,本研究在武汉市黄陂区采集了110个土壤样本,通过对多元线性回归、地理加权回归和MGWR进行模型评估来验证MGWR的有效性,进而使用MGWR模型探究Cd与11个解释变量间的空间异质关系,据此确定各点位Cd的影响因子和污染来源,最后结合污染现状和来源划定4类Cd污染风险区,提出相应的Cd污染管控措施。研究结果可以概况为3点:① 模型评估的结果表明MGWR模型最优,其建模R2为0.733; ② MGWR结果显示不同解释变量的有效带宽差异较大。此外,从整体上看,pH、黏粒含量和地形湿度指数是Cd空间分布的主要影响因子,城镇化和土壤母质是Cd的主要来源;从各点位来看,不同空间位置Cd的局部影响因子和主要来源差异较大; ③ 研究区55.5%的样本存在Cd污染;结合污染源类型和污染情况划定了高、中高、中、低4类风险区,并分别提出Cd污染防控建议。本研究证实了MGWR模型的有效性和考虑解释变量差异化带宽的必要性,研究成果可以为其他地区土壤重金属污染的局部影响因子探究、污染来源确定和防控措施制定提供参考。

吴子豪 , 刘耀林 , 冯向阳 , 陈奕云 , 闫庆武 . 基于多尺度地理加权回归的土壤镉污染局部影响因子分析[J]. 地球信息科学学报, 2023 , 25(3) : 573 -587 . DOI: 10.12082/dqxxkx.2023.220681
Identifying the local influencing factors and main pollution sources of Cadmium (Cd) in soil is of great significance for controlling soil Cd pollution, ensuring food security, and protecting urban residents' health. Based on the Geographically Weighted Regression (GWR), Multi-scale Geographically Weighted Regression (MGWR) takes into account the differential optimal bandwidth of different explanatory variables. It is considered to be an effective method to identify the local dominant factors of target variables but has not been applied to the study of soil heavy metal pollution. Therefore, using 110 sampling points collected from Huangpi District of Wuhan City, we examined the effectiveness of Multi-scale Geographically Weighted Regression (MGWR) by comparing the model performance of multiple linear regression, i.e., GWR and MGWR. Then the MGWR model was used to explore the spatial heterogeneous relationship between Cd and explanatory variables, and thus determine the influencing factors and main pollution sources of Cd at each point. Finally, four levels of Cd pollution risk areas were defined according to the pollution status and sources, and corresponding Cd pollution control measures were proposed. The results of model evaluation showed that the MGWR outperformed other models with highest R2 (0.733) and Log-likelihood, and lowest AIC and Moran’s I value of regression residuals. The results of MGWR exhibited that the optimal bandwidth of different variables varied greatly. The results also revealed that on the whole, pH, clay content, and topographic wetness index were the main factors affecting the spatial distribution of Cd, while urbanization and soil parent materials were the main sources of Cd. The local main influencing factors and sources of Cd at different locations were quite different: the main influencing factors of Cd at most locations were natural factors, and a few locations were dominated by human activities and natural factors. In total, 55.5% of the samples in the study area were contaminated with Cd. According to the pollution sources and conditions, four level risk areas of high, medium-to-high, medium, and low were defined, and suggestions for Cd pollution control in each area were also given. This study confirms the effectiveness of the MGWR model and the necessity of considering the differential bandwidth of explanatory variables. The findings provide a reference for the exploration of local influencing factors of heavy metal pollution, the determination of pollution sources, and the formulation of pollution control measures in other areas.
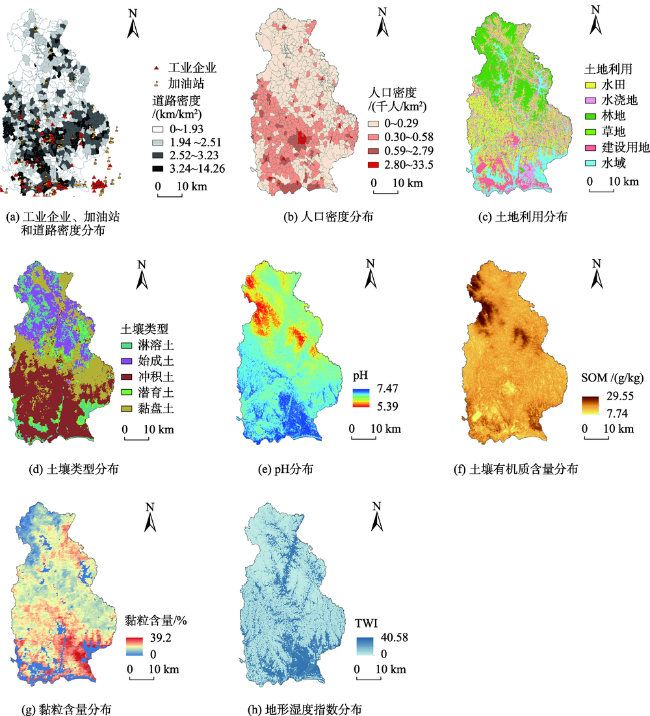
表1 Cd空间分布的潜在影响因子Tab. 1 Potential influencing factors of Cd spatial distribution |
| 方面 | 类型 | 潜在影响因子 | 数据来源和链接 |
|---|---|---|---|
| 污染来源 | 工业生产 | 到工业企业距离(Dis_IE) | 武汉市测绘研究院,数据暂不对外公开 |
| 城镇化 | 人口密度(PD)、道路密度(RD)、到加油站距离(Dis_GS) | ||
| 武汉市测绘研究院,数据暂不对外公开 | |||
| 农业生产 | 土地利用类型(LU) | ||
| 武汉市测绘研究院,数据暂不对外公开 | |||
| 有效磷含量(AP) | 实测数据 | ||
| 自然来源 | 土壤类型(ST) | SoilGrids数据库, https://soilgrids.org/ | |
| 迁移累积过程 | 环境因子 | 黏粒含量(Clay) | SoilGrids数据库, https://soilgrids.org/ |
| pH、土壤有机质(SOM) | 国家地球系统科学数据中心, http://soil.geodata.cn/ztsj.html | ||
| 地形湿度指数(TWI) | 地理空间数据云, http://www.gscloud.cn/ |
表2 土壤类型转换为哑变量的规则Tab. 2 Rules for converting soil types into dummy variables |
| 土壤类型 | 土壤类型哑变量 | |||
|---|---|---|---|---|
| ST1 | ST2 | ST3 | ST4 | |
| 始成土 | 1 | 0 | 0 | 0 |
| 潜育土 | 0 | 1 | 0 | 0 |
| 冲积土 | 0 | 0 | 1 | 0 |
| 黏盘土 | 0 | 0 | 0 | 1 |
| 淋溶土 | 0 | 0 | 0 | 0 |
表3 Cd和有效磷含量的描述性统计结果Tab. 3 Descriptive statistical results of Cd and available phosphorus |
| 实测元素 | 最小值 | 中位数 | 最大值 | 均值±标准差 | 变异系数/% |
|---|---|---|---|---|---|
| Cd/(mg/kg) | 0.055 | 0.345 | 1.422 | 0.378±0.238 | 62.9 |
| 有效磷/(mg/kg) | 0.661 | 16.070 | 302.705 | 39.410±62.053 | 157.5 |
表4 单因素方差分析结果Tab. 4 Results of one-way ANOVA |
| 土壤类型 | Cd含量/ (mg/kg) | 土地利用类型 | Cd含量/ (mg/kg) |
|---|---|---|---|
| 始成土 | 0.513a | 水田 | 0.388a |
| 潜育土 | 0.395ab | 水浇地 | 0.388a |
| 冲积土 | 0.380b | 草地 | 0.275a |
| 黏盘土 | 0.323b | ||
| 淋溶土 | 0.247b |
注:P>0.05,a、b表示显著差异。 |
表5 模型评估结果Tab. 5 Model evaluation results |
| 模型 | Log-likelihood | AIC | R2 | 残差Moran's I |
|---|---|---|---|---|
| MLR | -133.652 | 297.304 | 0.335 | 0.245 (p < 0.01) |
| GWR | -115.777 | 283.504 | 0.519 | 0.174 (p < 0.05) |
| MGWR | -108.516 | 242.225 | 0.733 | -0.058 (p > 0.05) |
表6 GWR和MGWR模型解释变量的最优带宽Tab. 6 Optimal bandwidth of explanatory variables for GWR and MGWR models |
| 解释变量 | GWR带宽 | MGWR带宽 | 解释变量 | GWR带宽 | MGWR带宽 |
|---|---|---|---|---|---|
| Dis_IE | 106 | 106 | ST2 | 106 | 108 |
| RD | 48 | ST3 | 108 | ||
| PD | 106 | ST4 | 108 | ||
| Dis_GS | 52 | Clay | 70 | ||
| AP | 104 | pH | 106 | ||
| LU | 78 | SOM | 104 | ||
| ST1 | 108 | TWI | 44 |
注:Dis_IE:到工业企业距离;RD:道路密度;PD:人口密度;Dis_GS:到加油站距离;AP:有效磷含量;LU:土地利用;ST1-4:土壤类型的哑变量;Clay:黏粒含量;SOM:土壤有机质含量;TWI:地形湿度指数。 |
表7 MGWR 模型各解释变量标准化回归系数的描述性统计结果Tab. 7 Descriptive statistical results of standardized regression coefficients of explanatory variables for MGWR model |
| 解释变量 | 均值 | 标准差 | 最小值 | 中位数 | 最大值 | 显著个数 |
|---|---|---|---|---|---|---|
| Dis_IE | -0.137 | 0.046 | -0.209 | -0.133 | -0.068 | 10 |
| Dis_GS | -0.117 | 0.234 | -0.601 | -0.043 | 0.180 | 31 |
| RD | 0.181 | 0.199 | 0.035 | 0.109 | 0.679 | 24 |
| PD | -0.082 | 0.032 | -0.141 | -0.061 | -0.052 | 0 |
| AP | 0.049 | 0.047 | -0.054 | 0.068 | 0.109 | 0 |
| LU | 0.099 | 0.100 | -0.116 | 0.135 | 0.201 | 36 |
| ST1 | 0.155 | 0.005 | 0.145 | 0.152 | 0.167 | 0 |
| ST2 | 0.096 | 0.038 | 0.035 | 0.106 | 0.147 | 0 |
| ST3 | 0.096 | 0.005 | 0.088 | 0.095 | 0.106 | 0 |
| ST4 | 0.087 | 0.020 | 0.056 | 0.085 | 0.119 | 0 |
| Clay | 0.282 | 0.410 | -0.158 | 0.186 | 1.057 | 51 |
| pH | 0.249 | 0.040 | 0.205 | 0.227 | 0.325 | 110 |
| SOM | 0.102 | 0.052 | 0.023 | 0.113 | 0.170 | 18 |
| TWI | 0.252 | 0.243 | -0.091 | 0.189 | 0.754 | 37 |
注:Dis_IE:到工业企业距离;RD:道路密度;PD:人口密度;Dis_GS:到加油站距离;AP:有效磷含量;LU:土地利用;ST1-4:土壤类型的哑变量;Clay:黏粒含量;SOM:土壤有机质含量;TWI:地形湿度指数。 |
表8 Cd污染风险区划分规则Tab. 8 Stratification rules of Cd pollution risk area |
| 风险区类型 | Cd含量是否超标 | Cd首要来源 | 防治措施 |
|---|---|---|---|
| 高风险区 | 超标 | 人为来源 | 根据首要污染来源进行管控,并根据污染严重程度由轻到重进行植被修复、钝化剂修复、客土法修复 |
| 中高风险区 | 超标 | 自然来源 | 测量Cd各组分含量后确定修复措施 |
| 中风险区 | 未超标 | 人为来源 | 根据首要污染来源进行管控,并进行定期监测。 |
| 低风险区 | 未超标 | 自然来源 | 进行定期监测。 |
| [1] |
|
| [2] |
彭驰, 何亚磊, 郭朝晖, 等. 中国主要城市土壤重金属累积特征与风险评价[J]. 环境科学, 2022, 43(1):1-10.
[
|
| [3] |
段续川. 北京市城郊土壤环境元素地球化学分布特征及源解析[D]. 北京: 中国地质大学(北京), 2021.
[
|
| [4] |
袁文悦. 上海城郊土壤及蔬菜重金属污染情况研究[D]. 上海: 上海交通大学, 2017.
[
|
| [5] |
李志. 广州市灰尘、土壤重金属污染特征及其健康风险评估[D]. 广州: 广州大学, 2022.
[
|
| [6] |
孙现领, 贾黎黎. 深圳杨梅坑地区岩石-土壤-植物系统中重金属元素的迁移特征[J]. 华南地质, 2020, 36(3):270-279.
[
|
| [7] |
庞龙. 西安城郊路边菜地土壤重金属污染研究[D]. 西安: 陕西师范大学, 2014.
[
|
| [8] |
郭佳, 靳少非, 王库. 城市快速扩张背景下城乡交错区土壤重金属的空间分布特征及影响因素分析[J]. 中国农学通报, 2022, 38(17):103-109.
[
|
| [9] |
郭云开, 张思爱, 谢晓峰, 等. 基于GA-SVM的耕地土壤重金属含量高光谱反演方法的研究[J]. 土壤通报, 2021, 52(4):968-974.
[
|
| [10] |
|
| [11] |
|
| [12] |
于旦洋, 王颜红, 丁茯, 等. 近十年来我国土壤重金属污染源解析方法比较[J]. 土壤通报, 2021, 52(4):1000-1008.
[
|
| [13] |
|
| [14] |
|
| [15] |
刘琼峰, 李明德, 段建南, 等. 农田土壤铅、镉含量影响因素地理加权回归模型分析[J]. 农业工程学报, 2013, 29(3):225-234,300.
[
|
| [16] |
周晟哲. 城郊农用地重金属含量影响因子回归及空间预测[D]. 湘潭: 湘潭大学, 2021.
[
|
| [17] |
|
| [18] |
沈体雁, 于瀚辰, 周麟, 等. 北京市二手住宅价格影响机制——基于多尺度地理加权回归模型(MGWR)的研究[J]. 经济地理, 2020, 40(3):75-83.
[
|
| [19] |
黄颙昊, 杨新苗, 岳锦涛. 基于多尺度地理加权回归模型的城市道路骑行流量分析[J]. 清华大学学报(自然科学版), 2022, 62(7):1132-1141.
[
|
| [20] |
陈卓伟, 邓昭华. 基于多尺度地理加权回归的广州主城区街区形态与热岛强度关系研究[J]. 智能建筑与智慧城市, 2021(10):13-17.
[
|
| [21] |
|
| [22] |
|
| [23] |
|
| [24] |
|
| [25] |
茹少峰, 马茹慧. 黄河流域生态环境脆弱性评价、空间分析及预测[J]. 自然资源学报, 2022, 37(7):1722-1734.
[
|
| [26] |
|
| [27] |
中华人民共和国生态环境部和国家市场监督管理总局. GB 15618-2018,土壤环境质量-农用地土壤污染风险管控标准(试行)[S]. 北京: 中国标准出版社, 2018,1-7.
[Ministry of Ecology and Environment and State Administration of Market Supervision and Administration of the People's Republic of China. GB 15618—2018, Soil environmental quality-Risk control standard for soil contamination of agricultural land[S]. Beijing: China Standards Press, 2018,1-7.]
|
| [28] |
黄卫, 庄荣浩, 刘辉, 等. 农田土壤镉污染现状与治理方法研究进展[J]. 湖南师范大学自然科学学报, 2022, 45(1):49-56.
[
|
| [29] |
巩龙达, 陈凯, 李丹, 等. 复合钝化剂施用水平对镉污染农田土壤的修复效果[J]. 浙江大学学报(农业与生命科学版), 2022, 48(3):359-368.
[
|
| [30] |
王剑, 杨婷婷, 朱有为, 等. 田间条件下施用石灰石及调理剂降低土壤镉可提取性的效应[J]. 水土保持学报, 2021, 35(4):334-340,368.
[
|
| [31] |
|
| [32] |
孙庆超, 王旭东, 乔建晨, 等. 不同质地土壤对镉的吸附特性及影响因子研究[J]. 土壤, 2020, 52(3):545-551.
[
|
| [33] |
高中原, 肖荣波, 王鹏, 等. 融合自然-人为因子改进回归克里格对土壤镉空间分布预测[J]. 环境科学, 2021, 42(1):343-352.
[
|
| [34] |
陈孜涵, 汪丙国, 赵建芳. 江汉平原旱地和水田土壤镉的吸附与解吸特征及影响因素[J]. 地球科学, 2022, 47(2):544-555.
[
|
| [35] |
|
| [36] |
马宏宏, 彭敏, 郭飞, 等. 广西典型岩溶区农田土壤-作物系统Cd迁移富集影响因素[J]. 环境科学, 2021, 42(3):1514-1522.
[
|
| [37] |
马振东, 张德存, 闭向阳, 等. 武汉沿长江、汉江Cd高值带成因初探[J]. 地质通报, 2005, 24(8):740-743.
[
|
| [38] |
|
| [39] |
张新. 平原区土壤重金属镉空间分布预测方法研究[D]. 雅安: 四川农业大学, 2016.
[
|
| [40] |
杨帆, 郝志红, 张舜尧, 等. 长江武汉段冲积土壤中重金属的环境地球化学特征[J]. 地质学报, 2016, 90(8):1955-1964.
[
|
| [41] |
|
/
| 〈 |
|
〉 |