
黄土高原区SRTM1 DEM高程误差校正模型构建及对比分析
|
黄帅元(1998— ),男,江苏张家港人,硕士,主要从事数字地形建模与数字高程模型校正。E-mail: 202061123004@njtech.edu.cn |
收稿日期: 2022-09-09
修回日期: 2022-11-27
网络出版日期: 2023-04-19
基金资助
国家自然科学基金项目(41871324)
Establishment and Comparative Analysis of SRTM1 DEM Error Correction Model in the Loess Plateau
Received date: 2022-09-09
Revised date: 2022-11-27
Online published: 2023-04-19
Supported by
National Natural Science Foundation of China(41871324)
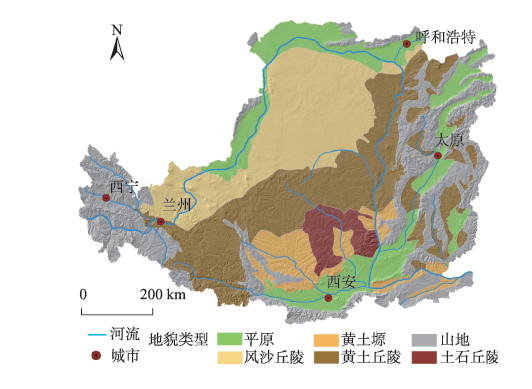
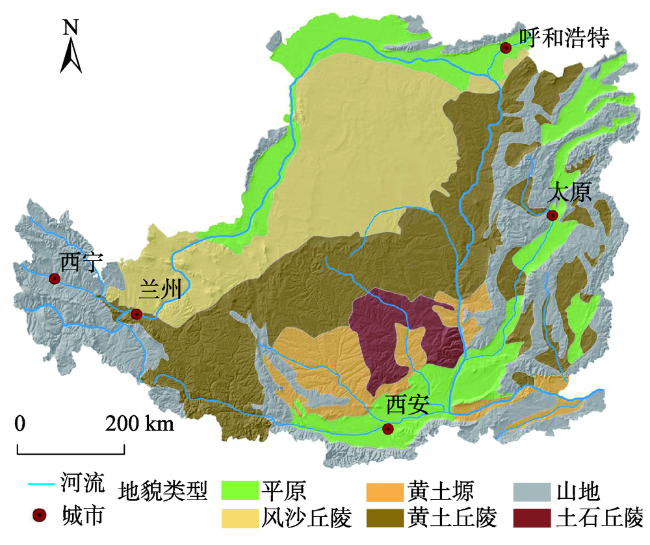
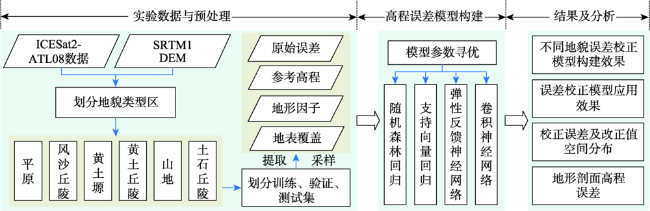
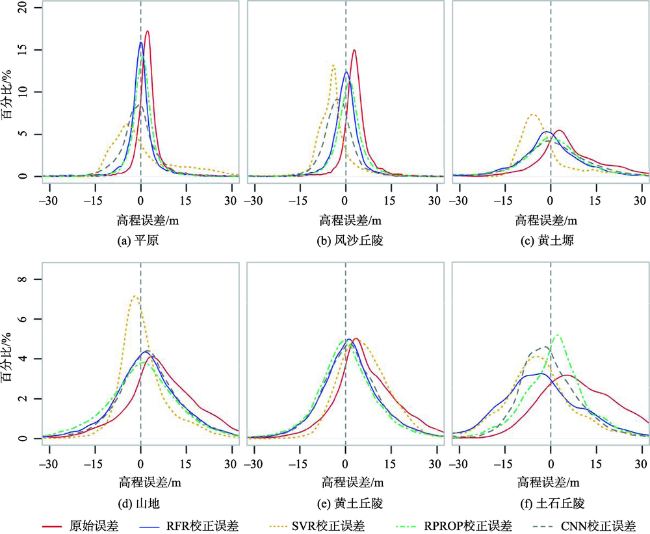
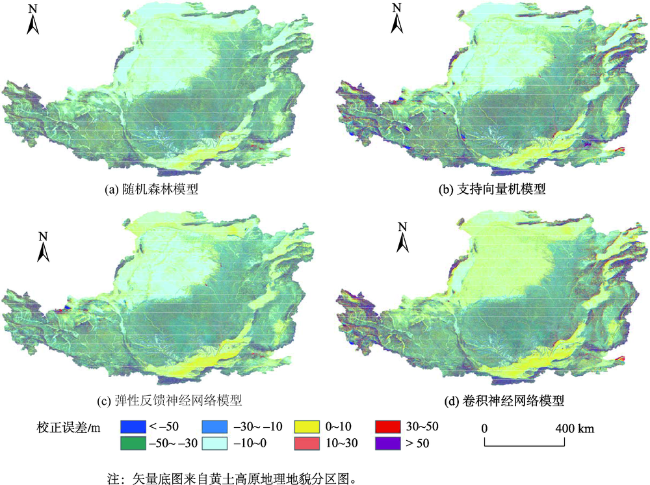
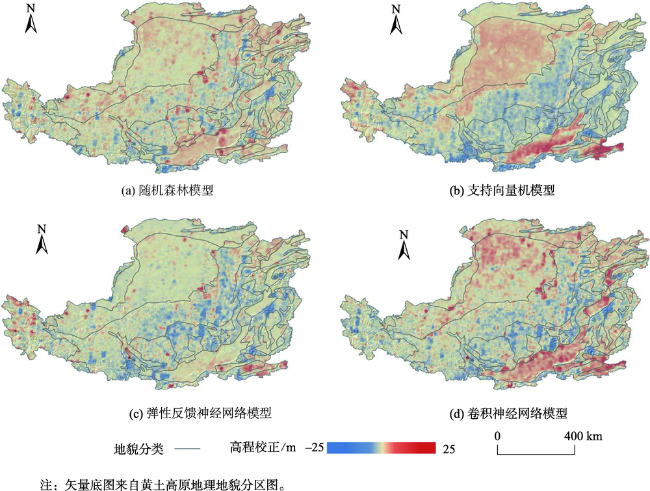
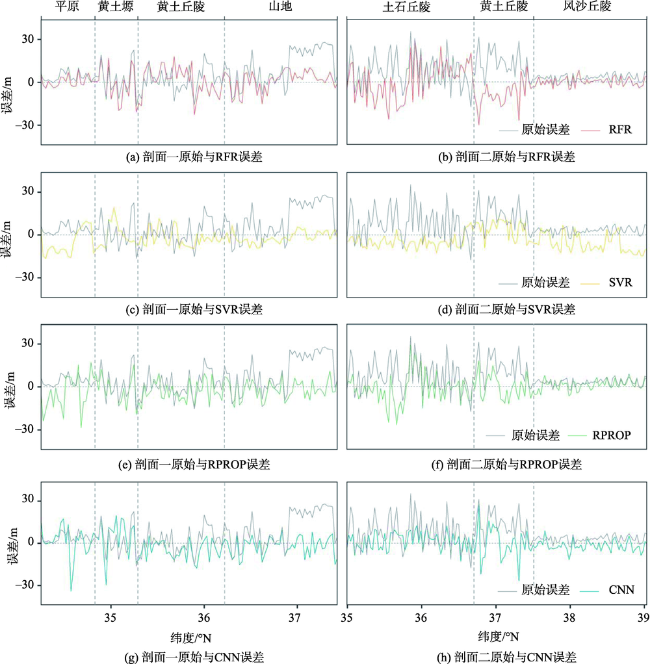
对SRTM1 DEM高程误差进行校正可有效提高其应用精度。以具有典型地貌特征的黄土高原作为研究区域,以ICESat-2/ATL08陆地高程作为参考数据,引入主流机器学习算法建立SRTM1高程误差与影响因子之间的关系模型对高程值进行校正;通过分析模型性能指标、误差频数分布、校正误差空间格局以及典型剖面误差分布,以此得到不同地貌类型区的高程误差校正模型适用性。实验结果表明:在平原、风沙丘陵和黄土塬地貌区随机森林模型高程校正效果最佳,平均绝对误差分别降低0.49、0.82和1.2 m,同时校正误差在空间分布上异常值较少,低起伏度的平原和风沙丘陵地貌区典型剖面误差与原误差较为贴合;山地区支持向量机模型适用性更强,均方根误差和平均绝对误差分布降低了6.79 m和5.43 m,可大幅提升误差绝对值较小的点位频数,同时在空间格局和典型剖面验证效果最佳;黄土丘陵地貌区弹性反馈神经网络模型效果最优,均方根误差和平均绝对误差分别降低了2.3 m和2.04 m,空间分布上误差降低效果显著,典型剖面误差异常值较少;土石丘陵地貌区卷积神经网络模型效果更理想,均方根误差与平均绝对误差分别降低4.14 m和3.5 m,空间分布与地形剖面误差降低效果良好。研究结果可为该区域不同地貌类型区选用SRTM1 DEM高程校正模型提供了参考。
黄帅元 , 董有福 , 李海鹏 . 黄土高原区SRTM1 DEM高程误差校正模型构建及对比分析[J]. 地球信息科学学报, 2023 , 25(3) : 669 -681 . DOI: 10.12082/dqxxkx.2023.220677
Correcting the error of SRTM1 DEM can effectively improve its application accuracy. Taking the Loess Plateau with typical landform characteristics as the research area and using the ICESat-2/ATL08 land laser elevation point as the reference data, the mainstream machine learning algorithms are introduced to establish the relationship between SRTM1 DEM error and its influencing factors to correct the elevation value. By analyzing the model performance indicators, error frequency distribution curve, spatial pattern of correction error, and the comparison of original and corrected distributions of error in typical profile, we can obtain the applicability of elevation error correction models for different landform types. Results show that the elevation correction effect using the random forest regression model is the best in the plain landform, wind-sand landform, and loess tableland landform, and the average absolute errors are reduced by 0.49 m, 0.82 m and 1.2 m, respectively. The errors in typical profile of the low relief plain and wind-sand landforms are more consistent with the original errors. The support vector machine model in mountainous areas is more applicable, and the root mean square error and mean absolute error is reduced by 6.79 m and 5.43 m, respectively. The frequency of small absolute errors is increased in the spatial pattern and typical profile. The resilient backpropagation model is the best in the loess hilly landform area, and the root mean square error and mean absolute error are reduced by 2.3 m and 2.04 m, respectively. The error reduction effect is significant at the spatial scale, and there are few outliers of error in typical profile. The convolutional neural network model in the soil-rocky hilly landform area is more ideal compared to other models, and the root mean square error and the mean absolute error are reduced by 4.14 m and 3.5 m, respectively. The error reduction effect of terrain profile is significant. The study provides a reference for the selection of the SRTM1 DEM elevation correction model for different landform types in this region.
表1 实验数据主要特征Tab. 1 Main characteristics of experimental data |
| 数据名称 | 发布时间 | 来源 | 分辨率 | 地理坐标系 |
|---|---|---|---|---|
| SRTM GL1 v003 | 2015年7月 | NASA数据档案中心 https://search.earthdata.nasa.gov/ | 30 m | WGS84 |
| ICESat-2/ATL08 | 2018年10月至2021年7月 | NASA冰雪数据中心 https://nsidc.org/data/icesat-2 | 沿轨100 m激光高程点 | WGS84 |
| GlobeLand30全球地表覆盖数据 | 2020年 | Globallandcover官网 http://www.globallandcover.com | 30 m | WGS84 |
| 黄土高原地区地理地貌分区图 | 2013年12月 | 国家地球系统科学数据中心 http://www.geodata.cn/ | 矢量数据 | GCS_Krasovsky_1940 |
表2 实验样区训练集地形统计信息Tab. 2 Terrain statistics of training set in experimental sample area (m) |
| 地形统计信息 | 整体 | 平原 | 风沙丘陵 | 黄土塬 | 山地 | 黄土丘陵 | 土石丘陵 |
|---|---|---|---|---|---|---|---|
| 样点数/个 | 108 387 | 17 335 | 24 817 | 6803 | 26 762 | 28 548 | 4092 |
| 高程差 | 4766 | 1719 | 2190 | 1964 | 4766 | 3602 | 1320 |
| 平均/最大坡度(°) | 12.22/66.68 | 3.54/43.77 | 4.86/47.66 | 13.56/55.39 | 17.49/66.68 | 13.89/54.28 | 17.84/46.06 |
| TRI范围 | 0~54.63 | 0~33.25 | 0~26.88 | 0~30.87 | 0~54.63 | 0.38~37.75 | 0.88~26.75 |
| TPI范围 | -26.00~30.75 | -19.38~14.75 | -13.25~14.50 | -16.00~18.25 | -26.00~30.75 | -17.38~18.50 | -17.88~20.00 |
| 平均绝对误差 | 7.70 | 3.49 | 4.37 | 9.65 | 10.96 | 9.58 | 12.89 |
| 误差标准差 | 10.48 | 4.89 | 5.48 | 12.03 | 13.53 | 11.49 | 13.79 |
| 误差均方根 | 11.65 | 5.55 | 6.46 | 13.65 | 15.04 | 12.89 | 16.59 |
表3 高程误差校正模型整体与不同地貌区校正均方根误差表Tab. 3 Root mean square error of correction elevation error model in different geomorphic areas (m) |
| 模型 | 测试集 整体 | 平原 | 风沙丘陵 | 黄土塬 | 山地 | 黄土丘陵 | 土石丘陵 | |||||||||||
|---|---|---|---|---|---|---|---|---|---|---|---|---|---|---|---|---|---|---|
| RMSE | 差 | RMSE | 差 | RMSE | 差 | RMSE | 差 | RMSE | 差 | RMSE | 差 | |||||||
| 原始 | 12.08 | 7.37 | 9.04 | 14.18 | 15.15 | 13.59 | 17.05 | |||||||||||
| RFR | 11.15 | 7.51 | -0.14 | 9.24 | -0.2 | 12.84 | 1.34 | 13.62 | 1.53 | 11.92 | 1.67 | 14.39 | 2.66 | |||||
| SVR | 11.19 | 10.51 | -3.14 | 10.05 | -1.01 | 11.06 | 3.12 | 8.36 | 6.79 | 11.74 | 1.85 | 13.33 | 3.72 | |||||
| RProp | 11.33 | 7.34 | 0.03 | 9.09 | -0.05 | 13.73 | 0.45 | 14.46 | 0.69 | 11.29 | 2.3 | 13.19 | 3.86 | |||||
| CNN | 11.37 | 8.48 | -1.11 | 9.70 | -0.66 | 12.96 | 1.22 | 13.31 | 1.84 | 11.63 | 1.96 | 12.91 | 4.14 | |||||
表4 高程误差校正模型整体与不同地貌区平均绝对误差表Tab. 4 Mean absolute error of correction elevation error model in different geomorphic areas (m) |
| 模型 | 测试集 整体 | 平原 | 风沙丘陵 | 黄土塬 | 山地 | 黄土丘陵 | 土石丘陵 | |||||||||||
|---|---|---|---|---|---|---|---|---|---|---|---|---|---|---|---|---|---|---|
| MAE | 差 | MAE | 差 | MAE | 差 | MAE | 差 | MAE | 差 | MAE | 差 | |||||||
| 原始 | 8.53 | 4.22 | 5.44 | 10.27 | 11.45 | 10.06 | 13.35 | |||||||||||
| RFR | 7.26 | 3.73 | 0.49 | 4.62 | 0.82 | 9.07 | 1.20 | 9.68 | 1.77 | 8.49 | 1.57 | 11.15 | 2.20 | |||||
| SVR | 7.96 | 8.02 | -3.80 | 7.58 | -2.14 | 8.12 | 2.15 | 6.02 | 5.43 | 9.32 | 0.74 | 10.15 | 3.20 | |||||
| RProp | 7.59 | 3.91 | 0.31 | 4.99 | 0.45 | 9.56 | 0.71 | 10.49 | 0.96 | 8.02 | 2.04 | 10.14 | 3.21 | |||||
| CNN | 7.66 | 5.38 | -1.16 | 5.68 | -0.24 | 9.31 | 0.96 | 9.53 | 1.92 | 8.33 | 1.73 | 9.85 | 3.50 | |||||
表5 模型应用检验样区不同地貌区校正均方根误差表Tab. 5 Root mean square error of correction elevation error model in different geomorphic areas for model extrapolation (m) |
| 模型 | 平原 | 风沙丘陵 | 黄土塬 | 山地 | 黄土丘陵 | 土石丘陵 | |||||||||||
|---|---|---|---|---|---|---|---|---|---|---|---|---|---|---|---|---|---|
| RMSE | 差值 | RMSE | 差值 | RMSE | 差值 | RMSE | 差值 | RMSE | 差值 | RMSE | 差值 | ||||||
| 原始 | 4.67 | 5.39 | 14.29 | 15.21 | 13.66 | 16.22 | |||||||||||
| RFR | 4.19 | 0.48 | 4.99 | 0.40 | 12.63 | 1.66 | 10.72 | 4.49 | 12.21 | 1.45 | 13.32 | 2.90 | |||||
| SVR | 6.13 | -1.46 | 6.53 | -1.14 | 12.69 | 1.60 | 9.08 | 6.13 | 12.75 | 0.91 | 12.64 | 3.58 | |||||
| RProp | 4.38 | 0.29 | 5.50 | -0.11 | 13.17 | 1.12 | 11.92 | 3.29 | 11.03 | 2.63 | 12.57 | 3.65 | |||||
| CNN | 5.79 | -1.12 | 5.56 | -0.17 | 13.06 | 1.23 | 12.02 | 3.19 | 11.05 | 2.61 | 12.61 | 3.61 | |||||
表6 模型应用检验样区不同地貌区校正平均绝对误差表Tab. 6 Mean absolute error of correction elevation error model in different geomorphic areas for model extrapolation (m) |
| 模型 | 平原 | 风沙丘陵 | 黄土塬 | 山地 | 黄土丘陵 | 土石丘陵 | |||||||||||
|---|---|---|---|---|---|---|---|---|---|---|---|---|---|---|---|---|---|
| RMSE | 差值 | RMSE | 差值 | RMSE | 差值 | RMSE | 差值 | RMSE | 差值 | RMSE | 差值 | ||||||
| 原始 | 4.38 | 4.32 | 10.63 | 11.58 | 10.61 | 12.56 | |||||||||||
| RFR | 4.03 | 0.35 | 3.66 | 0.66 | 9.11 | 1.52 | 8.85 | 2.73 | 9.20 | 1.41 | 10.42 | 2.14 | |||||
| SVR | 5.85 | -1.47 | 5.07 | -0.75 | 8.98 | 1.65 | 5.92 | 5.56 | 9.58 | 1.03 | 10.05 | 2.51 | |||||
| RProp | 4.18 | 0.20 | 4.59 | -0.27 | 10.21 | 0.42 | 9.95 | 1.63 | 8.09 | 2.52 | 9.76 | 2.80 | |||||
| CNN | 5.61 | -1.23 | 4.77 | -0.45 | 9.75 | 0.88 | 10.15 | 1.43 | 8.15 | 2.46 | 9.93 | 2.63 | |||||
| [1] |
|
| [2] |
|
| [3] |
|
| [4] |
|
| [5] |
|
| [6] |
陈学兄, 常庆瑞, 郭碧云, 等. 基于SRTM DEM数据的中国地形起伏度分析研究[J]. 应用基础与工程科学学报, 2013, 21(4):670-678.
[
|
| [7] |
|
| [8] |
沈焕锋, 刘露, 岳林蔚, 等. 多源DEM融合的高差拟合神经网络方法[J]. 测绘学报, 2018, 47(6):854-863.
[
|
| [9] |
|
| [10] |
|
| [11] |
|
| [12] |
胡海, 游涟, 胡鹏, 等. 数字高程模型内插方法的分析和选择[J]. 武汉大学学报(信息科学版), 2011, 36(1):82-85.
[
|
| [13] |
|
| [14] |
|
| [15] |
|
| [16] |
|
| [17] |
李鹏, 李振洪, 施闯, 等. 中国地区30 m分辨率SRTM质量评估[J]. 测绘通报, 2016(9):24-28.
[
|
| [18] |
张朝忙, 刘庆生, 刘高焕, 等. 太湖地区SRTM DEM高程精度质量评价[J]. 测绘科学, 2014, 39(3):139-142,123.
[
|
| [19] |
|
| [20] |
|
| [21] |
赵尚民, 何维灿, 王莉. DEM数据在黄土高原典型地貌区的误差分布[J]. 测绘科学, 2016, 41(2):67-70.
[
|
| [22] |
|
| [23] |
|
| [24] |
|
| [25] |
|
| [26] |
|
| [27] |
|
| [28] |
|
| [29] |
|
| [30] |
|
| [31] |
|
| [32] |
|
| [33] |
秦臣臣, 陈传法, 杨娜, 等. 基于ICESat/GLAS的山东省SRTM与ASTER GDEM高程精度评价与修正[J]. 地球信息科学学报, 2020, 22(3):351-360.
[
|
| [34] |
|
| [35] |
张丽, 董有福, 厉鸣. 利用弹性反馈神经网络融合ASTER GDEM和SRTM1高程数据[J]. 武汉大学学报·信息科学版, 2022, 47(1):1-9.
[
|
| [36] |
|
| [37] |
余婷婷, 董有福. 利用随机森林回归算法校正ASTER GDEM高程误差[J]. 武汉大学学报·信息科学版, 2021, 46(7):1098-1105.
[
|
| [38] |
NASA's Distributed Active Archive Centers[DB/OL]. https://search.earthdata.nasa.gov/.
|
| [39] |
|
| [40] |
National Snow&Ice Data Center. Data at NSIDC[DB/OL]. https://nsidc.org/data/icesat-2/.
|
| [41] |
王密, 韦钰, 杨博, 等. ICESat-2/ATLAS全球高程控制点提取与分析[J]. 武汉大学学报·信息科学版, 2021, 46(2):184-192.
[
|
| [42] |
|
| [43] |
|
| [44] |
Globeland30官方网站,2020版30米全球土地覆盖数据集[DB/OL]. http://globallandcover.com/.
|
| [45] |
杨勤科. 黄土高原地区地理分区图(2000年). 地球系统科学数据共享平台黄土高原科学数据共享平台, 2013.
[
|
| [46] |
|
| [47] |
|
| [48] |
邢晓语, 杨秀春, 徐斌, 等. 基于随机森林算法的草原地上生物量遥感估算方法研究[J]. 地球信息科学学报, 2021, 23(7):1312-1324.
[
|
| [49] |
毛亚萍, 房世峰. 基于机器学习的参考作物蒸散量估算研究[J]. 地球信息科学学报, 2020, 22(8):1692-1701.
[
|
| [50] |
周飞燕, 金林鹏, 董军. 卷积神经网络研究综述[J]. 计算机学报, 2017, 40(6):1229-1251.
[
|
| [51] |
厉鸣, 董有福, 张丽. 统计回归分析算法校正AW3D30高程误差适用性研究[J]. 测绘科学, 2022, 47(2):23-30.
[
|
/
| 〈 |
|
〉 |