
COVID-19疫情前后北美五大湖航运网络多尺度时空变化及影响因素研究
|
潘佳乐(2001— ),男,陕西咸阳人,硕士生,主要从事时空数据挖掘研究。E-mail: panjl@sdust.edu.cn |
收稿日期: 2022-11-13
修回日期: 2023-02-17
网络出版日期: 2023-06-30
基金资助
国家自然科学基金项目(42101452)
山东省自然科学基金项目(ZR2021QD027)
Multi-scale Spatio-temporal Changes and Influencing Factors of the Shipping Network in the Great Lakes of North America during the COVID-19 Pandemic Period
Received date: 2022-11-13
Revised date: 2023-02-17
Online published: 2023-06-30
Supported by
National Natural Science Foundation of China(42101452)
Shandong Provincial Natural Science Foundation, China(ZR2021QD027)
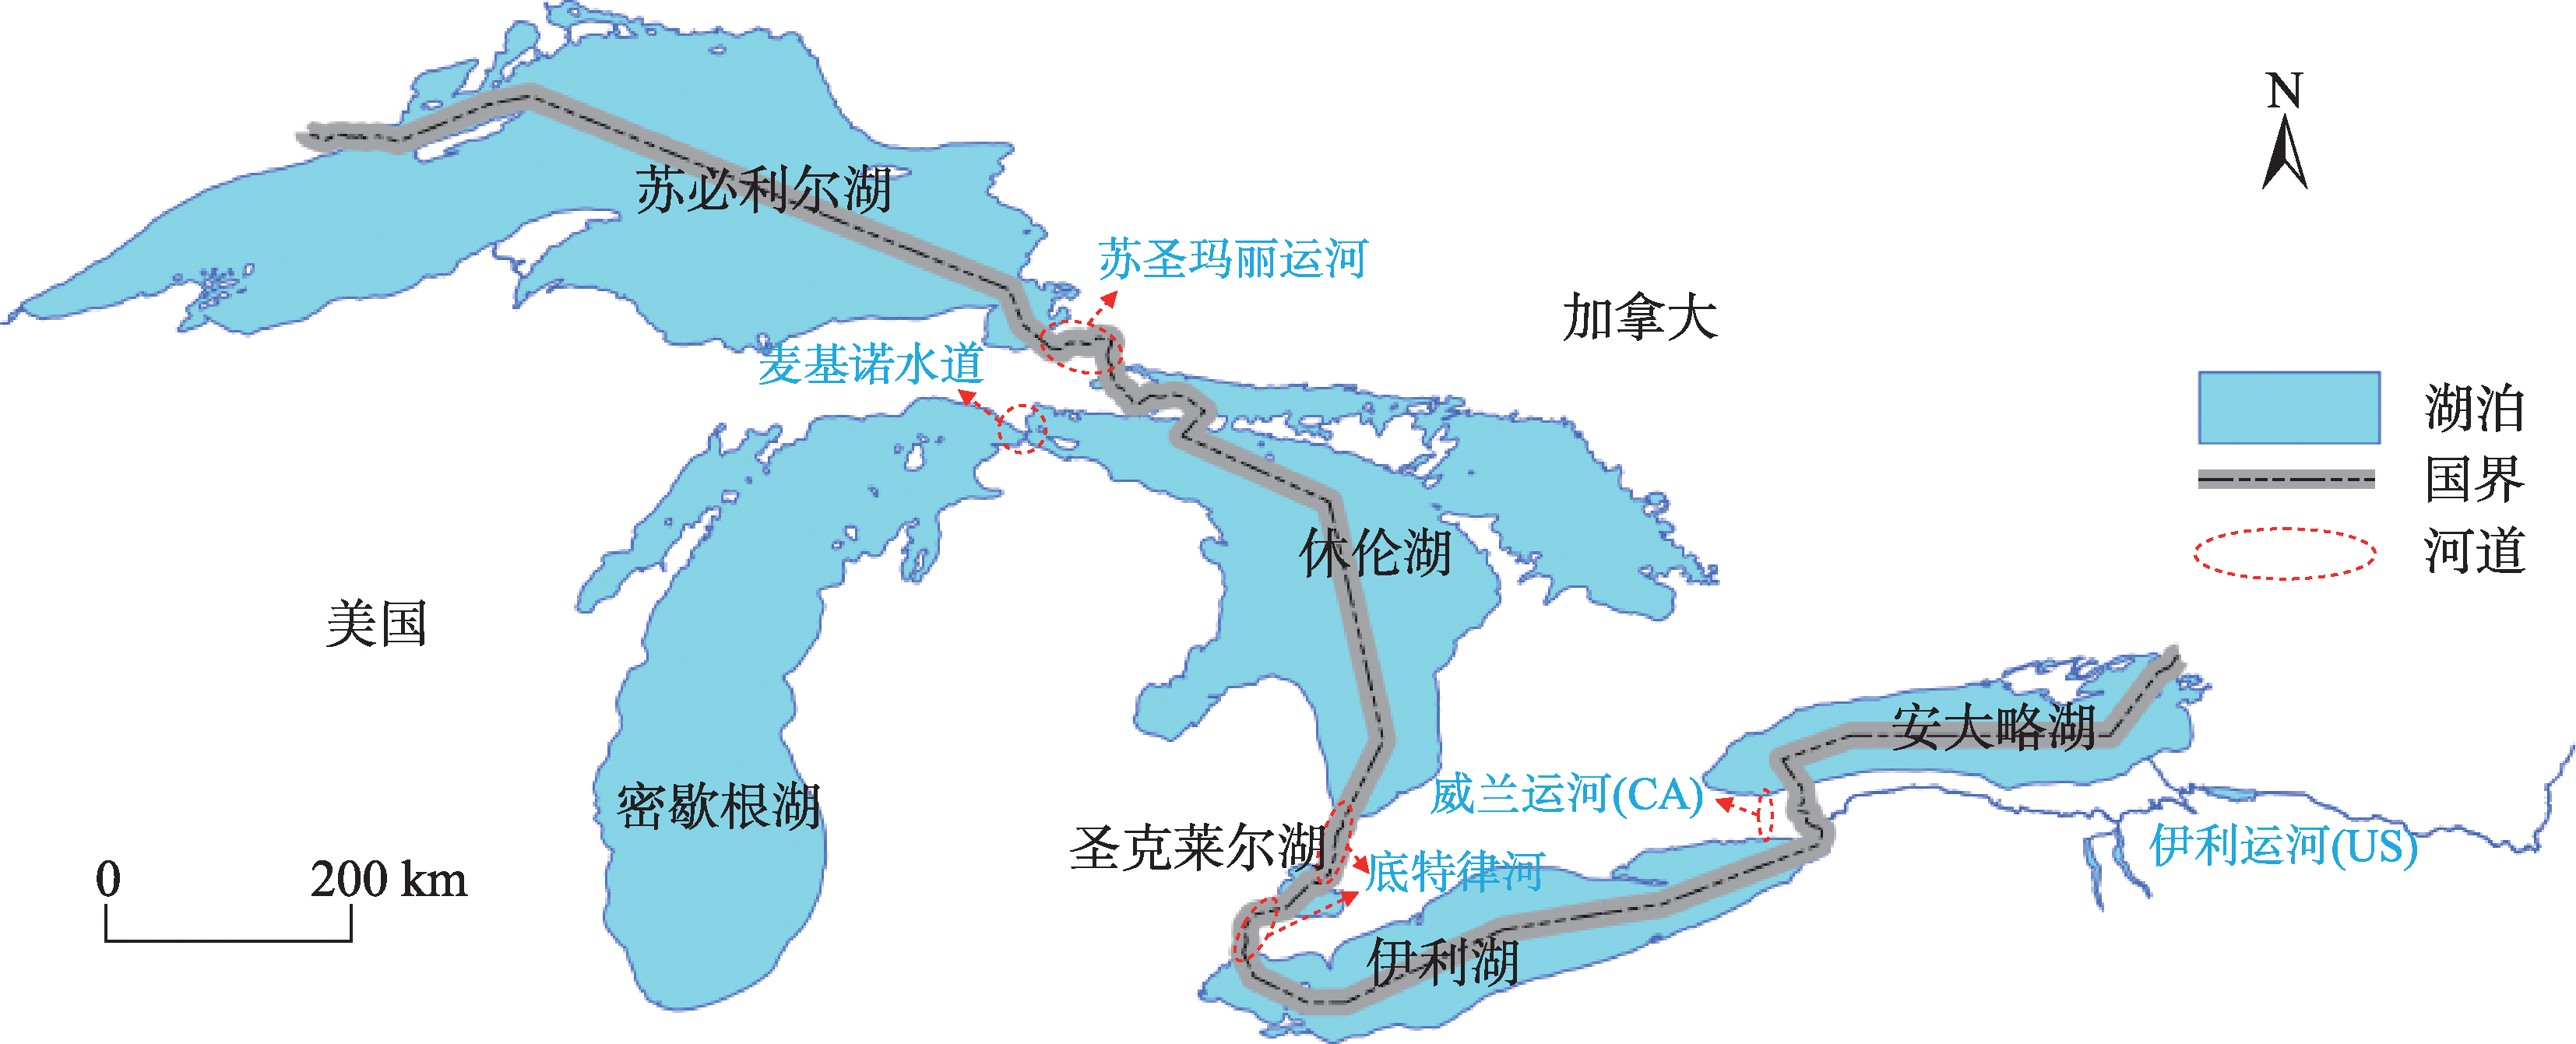
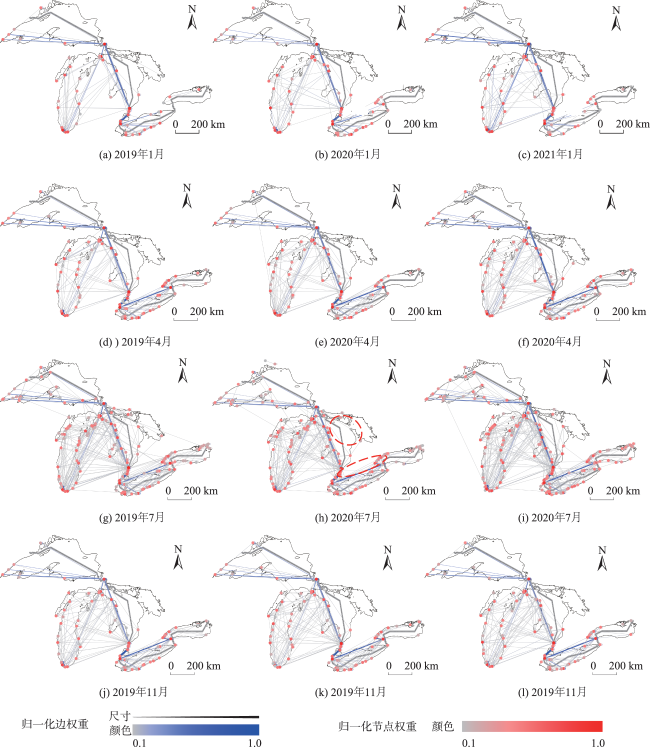
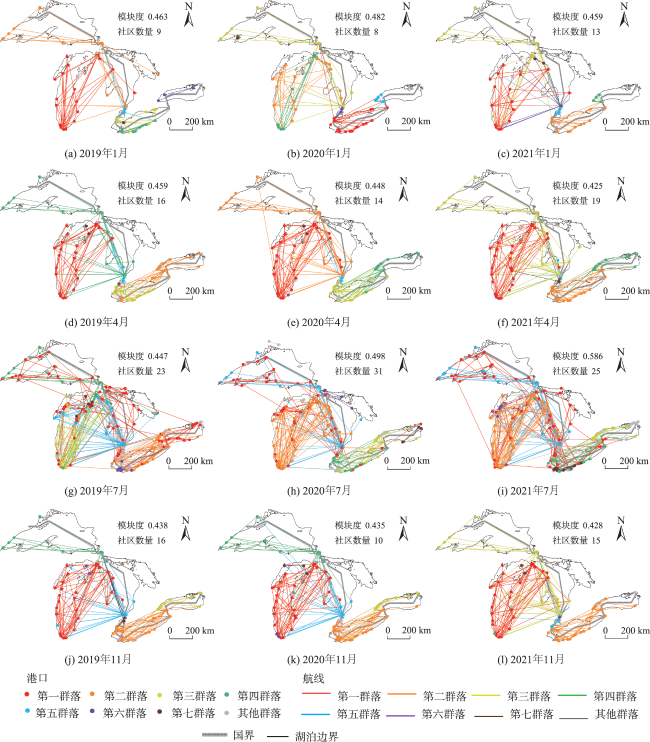
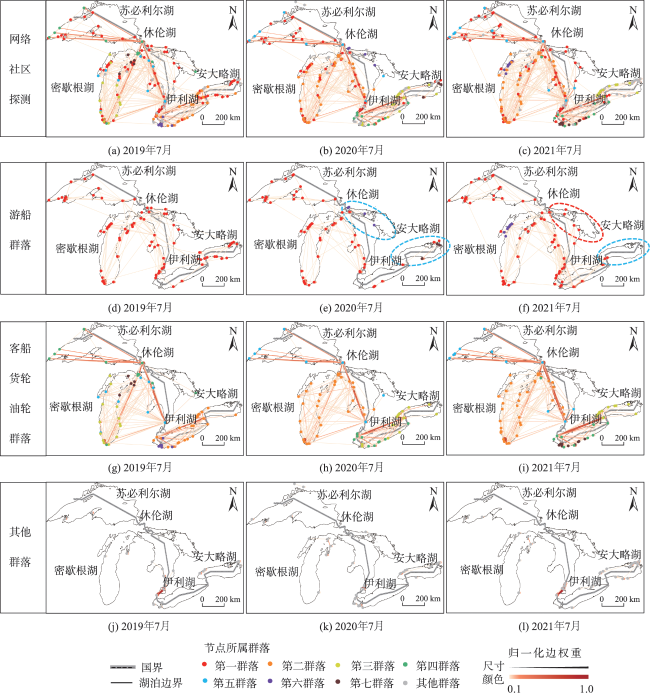
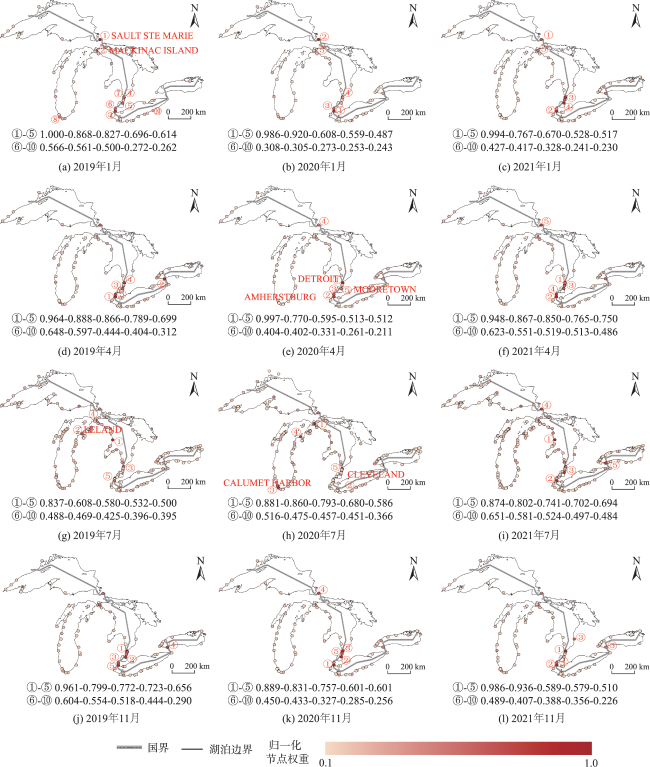
新冠疫情给全球海洋运输业造成了严重的影响,在后疫情时代航运产业的复苏过程中蕴含新的挑战与发展机遇。现有研究时间跨度不足,无法充分认识航运网络的变化过程,其次,仅对宏观尺度空间格局变化进行分析忽略了网络变化的内在驱动因素。因此本研究基于复杂网络理论、社区探测算法和TOPSIS分析方法,提出一种航运网络多尺度变化分析框架,结合2019—2021年北美五大湖船舶轨迹数据分析整体航运网络、港口群落和港口3个尺度的变化特征。此外,还对各类型航运网络的变化机理进行追踪。研究结果表明:① 网络流量方面,疫情前货轮和牵引船交通量占比达交通量总量的80%,疫情爆发后船舶交通量总量下降22.4%,各类型船舶交通量变化的时期、速度不同,其中,游船与货轮恢复能力强,油船次之,客船交通量降幅超50%为各类最高,受影响严重且恢复能力最弱,后疫情时期交通量总量较疫情前上涨4.4%,表明网络流量恢复能力整体较强;② 网络结构方面,疫情前航运网络随气温变暖呈扩张趋势,港口数量、航线数量递增式上升,疫情后网络结构受损连通性下降,后疫情时期指标值迅速恢复、航线密度增大,期间网络“骨架”未被破坏。整体而言,五大湖航运网络韧性较强; ③ 五大湖地区大型港口群位于各大湖泊内部且空间结构稳定,重要港口位于各大湖泊交界处,疫情前后港口评价值变化过程具有复杂性与不对称性。本研究通过多尺度视角分析网络变化,方法可应用于其他交通网络分析,为从业者认识疫情对航运业的影响提供参考。
潘佳乐 , 信睿 . COVID-19疫情前后北美五大湖航运网络多尺度时空变化及影响因素研究[J]. 地球信息科学学报, 2023 , 25(7) : 1481 -1499 . DOI: 10.12082/dqxxkx.2023.220884
The COVID-19 pandemic has had a serious impact on the global maritime transportation industry, and there are new challenges and opportunities for the recovery of the shipping industry in the post-pandemic era. However, the limited time span of existing studies is insufficient to fully recognize the change in shipping network. Additionally, analysis of only macro-scale changes in spatial pattern ignores the intrinsic drivers of network changes. Therefore, based on the complex network theory, community detection algorithm, and TOPSIS analysis method, this study proposes a multi-scale change analysis framework for shipping network. The change characteristics of the shipping network, port community, and ports of three scales are analyzed using the North American Great Lakes ship trajectory data from 2019 to 2021. In addition, the change mechanism of each type of shipping is tracked. The results show that: (1) In terms of network traffic, freighters and tugboats accounted for 80% of the total traffic volume before the pandemic outbreak. After the pandemic, the total volume of ship traffic decreased by 22.4%. The change period and rate of the traffic volume of various types of ships are different. Cruise and cargo ships have strong recovery capability, followed by oil tankers, while passenger ships have the highest decrease in traffic volume with a decrease of more than 50% and have the weakest recovery capability. During the post-pandemic period, the total traffic volume increased by 4.4% compared to that before the epidemic, indicating that the overall network traffic recovery ability is strong; (2) In terms of network structure, before the pandemic, the shipping network showed an expansion trend with warmer temperatures, and the number of ports and routes increased incrementally. After the pandemic, the network structure was damaged, leading to a decreased connectivity. The route density increased, and the network "skeleton" was not destroyed during the period. Overall, the Great Lakes shipping network demonstrated strong resilience; (3) Large port groups in the Great Lakes region are located inside the major lakes with a stable spatial structure, and the key ports are located at the junctions of major lakes. The change of port evaluation values before and after the pandemic is complex and asymmetric. This study analyzes network changes from a multi-scale perspective, providing reference for practitioners to understand the impact of the pandemic on the shipping industry, and the method can be applied to other transportation network analyses.
表1 AIS数据属性和示例值Tab. 1 AIS data attributes and example values |
| 属性 | 类型 | 属性含义 | 示例值 |
|---|---|---|---|
| MMSI | 静态 | 船舶ID | 369***030 |
| IMO | 静态 | 海事编号 | IMO92***12 |
| VesselName | 静态 | 船名 | KI** |
| CallSign | 静态 | 呼号 | KA**07 |
| VesselType | 静态 | 船舶类型 | 90 |
| LAT | 动态 | 船舶纬度 | 46.59858 |
| LON | 动态 | 船舶经度 | -90.8791 |
| BaseDateTime | 动态 | UTF时间 | 2019/1/1T00:09:12 |
| Status | 航行 | 航行状态 | 5 |
| Draft | 航行 | 吃水 | 2.4 |
表2 五大湖航运OD数据属性及示例值Tab. 2 Great Lakes maritime OD data attributes and example values |
| 序号 | 属性 | 示例值 | 序号 | 属性 | 示例值 |
|---|---|---|---|---|---|
| 1 | MMSI | 244***000 | 7 | VesselType | 80 |
| 2 | VesselName | IV** ***GHT | 8 | IMO | IMO96***59 |
| 3 | start_time | 2020/1/5 20:46 | 9 | end_time | 2020/1/8 6:20 |
| 4 | start_port_name | DETROIT | 10 | end_port_name | LEXINGTON |
| 5 | start_port_lat | 42.258 | 11 | end_port_lat | 43.268 |
| 6 | start_port_lon | -83.123 | 12 | end_port_lon | -82.524 |
表3 各类型船舶交通量统计Tab. 3 Statistical table of vessel traffic by type (次) |
| 时间 | 游船 | 客船 | 货轮 | 油轮 | 牵引船 | 全部 |
|---|---|---|---|---|---|---|
| 2019-01 | 0 | 32 | 805 | 165 | 583 | 1 585 |
| 2019-04 | 6 | 244 | 2 611 | 357 | 949 | 4 167 |
| 2019-07 | 847 | 613 | 3 082 | 415 | 1 319 | 6 276 |
| 2019-11 | 3 | 167 | 2 739 | 397 | 1 255 | 4 561 |
| 2020-01 | 0 | 56 | 599 | 230 | 497 | 1 382 |
| 2020-04 | 2 | 95 | 2 482 | 316 | 986 | 3 881 |
| 2020-07 | 705 | 301 | 2 287 | 307 | 1 268 | 4 868 |
| 2020-11 | 6 | 90 | 2 592 | 198 | 946 | 3 832 |
| 2021-01 | 0 | 43 | 801 | 121 | 461 | 1 426 |
| 2021-04 | 11 | 198 | 2 941 | 331 | 1 173 | 4 654 |
| 2021-07 | 1 068 | 418 | 3 194 | 384 | 1 396 | 6 460 |
| 2021-11 | 3 | 163 | 2 910 | 369 | 1 331 | 4 776 |
表4 五大湖船舶航行网络指标Tab. 4 Great Lakes vessel navigation network indicators |
| 指标 | 指标描述 | 年份 | 1月 | 4月 | 7月 | 11月 | |
|---|---|---|---|---|---|---|---|
| 拓扑指标 | N | 节点数 | 2019 | 53 | 80 | 180 | 80 |
| 2020 | 59 | 75 | 179 | 81 | |||
| 2021 | 55 | 85 | 200 | 81 | |||
| L | 边数 | 2019 | 186 | 357 | 718 | 389 | |
| 2020 | 216 | 335 | 635 | 388 | |||
| 2021 | 185 | 387 | 844 | 395 | |||
| D | 网络密度 | 2019 | 0.067 | 0.056 | 0.022 | 0.062 | |
| 2020 | 0.063 | 0.060 | 0.020 | 0.060 | |||
| 2021 | 0.062 | 0.054 | 0.021 | 0.061 | |||
| C | 全局聚集系数 | 2019 | 0.292 | 0.326 | 0.333 | 0.332 | |
| 2020 | 0.226 | 0.327 | 0.292 | 0.332 | |||
| 2021 | 0.223 | 0.359 | 0.339 | 0.346 | |||
| <K> | 节点平均度值 | 2019 | 7.019 | 8.925 | 7.978 | 9.725 | |
| 2020 | 7.322 | 8.933 | 7.095 | 9.580 | |||
| 2021 | 6.727 | 9.106 | 8.440 | 9.753 | |||
| 流量指标 | <F> | 节点平均流量 | 2019 | 59.811 | 104.175 | 69.733 | 114.025 |
| 2020 | 46.847 | 103.493 | 54.391 | 94.617 | |||
| 2021 | 51.855 | 109.506 | 64.600 | 117.926 | |||
| <W> | 边平均流量 | 2019 | 8.522 | 11.672 | 8.741 | 11.725 | |
| 2020 | 6.398 | 11.585 | 7.666 | 9.876 | |||
| 2021 | 7.708 | 12.026 | 7.654 | 12.091 | |||
| 指标分布 | CV(F) | 节点流量变异系数 | 2019 | 1.626 | 1.971 | 2.685 | 1.991 |
| 2020 | 1.656 | 1.974 | 2.555 | 2.020 | |||
| 2021 | 1.611 | 2.069 | 2.650 | 2.001 | |||
| CV(W) | 边流量变异系数 | 2019 | 2.061 | 2.755 | 3.409 | 2.923 | |
| 2020 | 2.176 | 2.797 | 3.150 | 2.921 | |||
| 2021 | 1.919 | 2.899 | 3.496 | 2.929 |
表5 游船网络指标Tab. 5 Cruise network indicators |
| 时间 | N | L | L/N | D | C |
|---|---|---|---|---|---|
| 2019-07 | 100 | 277 | 2.77 | 0.028 | 0.174 |
| 2020-07 | 100 | 238 | 2.38 | 0.024 | 0.155 |
| 2021-07 | 109 | 353 | 3.24 | 0.030 | 0.224 |
| <K> | <F> | <W> | CV(F) | CV(W) | |
| 2019-07 | 5.540 | 16.940 | 3.058 | 1.583 | 2.324 |
| 2020-07 | 4.760 | 14.100 | 2.962 | 1.500 | 2.081 |
| 2021-07 | 6.477 | 19.596 | 3.025 | 1.415 | 2.009 |
表6 客船网络指标Tab. 6 Passenger network indicators |
| 年份 | 拓扑指标 | 1月 | 4月 | 7月 | 11月 | 流量指标及分布 | 1月 | 4月 | 7月 | 11月 |
|---|---|---|---|---|---|---|---|---|---|---|
| 2019 | N | 9 | 30 | 49 | 23 | <F> | 7.111 | 16.267 | 25.020 | 14.522 |
| 2020 | 12 | 16 | 37 | 19 | 9.333 | 11.875 | 16.270 | 9.474 | ||
| 2021 | 11 | 25 | 51 | 28 | 7.818 | 15.840 | 16.392 | 11.643 | ||
| 2019 | L | 11 | 41 | 140 | 38 | <W> | 2.909 | 5.951 | 4.379 | 4.395 |
| 2020 | 14 | 20 | 62 | 25 | 4.000 | 4.750 | 4.855 | 3.600 | ||
| 2021 | 13 | 36 | 91 | 36 | 3.308 | 5.500 | 4.593 | 4.528 | ||
| 2019 | D | 0.153 | 0.047 | 0.060 | 0.075 | CV(F) | 0.754 | 2.218 | 1.205 | 1.749 |
| 2020 | 0.106 | 0.083 | 0.047 | 0.073 | 1.121 | 1.003 | 1.981 | 1.095 | ||
| 2021 | 0.118 | 0.060 | 0.036 | 0.048 | 0.907 | 1.676 | 2.158 | 1.614 | ||
| 2019 | <K> | 2.444 | 2.733 | 5.714 | 3.304 | CV(W) | 0.873 | 2.464 | 1.766 | 2.109 |
| 2020 | 2.333 | 2.500 | 3.351 | 2.632 | 1.073 | 1.120 | 2.342 | 1.267 | ||
| 2021 | 2.364 | 2.880 | 3.569 | 2.571 | 1.030 | 2.034 | 2.781 | 1.765 |
表7 货轮与油轮网络指标Tab. 7 Cargo and tanker network indicators |
| 指标 | 年份 | 货船 | 油轮 | |||||||
|---|---|---|---|---|---|---|---|---|---|---|
| 1月 | 4月 | 7月 | 11月 | 1月 | 4月 | 7月 | 11月 | |||
| 拓扑指标 | N | 2019 | 32 | 49 | 53 | 51 | 12 | 23 | 24 | 22 |
| 2020 | 36 | 46 | 47 | 48 | 14 | 19 | 18 | 18 | ||
| 2021 | 37 | 46 | 50 | 48 | 10 | 22 | 22 | 23 | ||
| L | 2019 | 100 | 194 | 245 | 218 | 31 | 57 | 61 | 53 | |
| 2020 | 102 | 188 | 204 | 221 | 34 | 44 | 48 | 48 | ||
| 2021 | 107 | 201 | 250 | 222 | 24 | 57 | 65 | 63 | ||
| D | 2019 | 0.101 | 0.082 | 0.089 | 0.085 | 0.235 | 0.113 | 0.111 | 0.115 | |
| 2020 | 0.081 | 0.091 | 0.094 | 0.098 | 0.187 | 0.129 | 0.157 | 0.157 | ||
| 2021 | 0.080 | 0.097 | 0.102 | 0.098 | 0.267 | 0.123 | 0.141 | 0.125 | ||
| C | 2019 | 0.279 | 0.302 | 0.351 | 0.294 | 0.214 | 0.244 | 0.277 | 0.340 | |
| 2020 | 0.175 | 0.327 | 0.321 | 0.345 | 0.217 | 0.179 | 0.263 | 0.371 | ||
| 2021 | 0.153 | 0.351 | 0.356 | 0.355 | 0.231 | 0.329 | 0.377 | 0.254 | ||
| <K> | 2019 | 6.250 | 7.918 | 9.245 | 8.549 | 5.167 | 4.957 | 5.083 | 4.818 | |
| 2020 | 5.667 | 8.174 | 8.681 | 9.208 | 4.857 | 4.632 | 5.333 | 5.333 | ||
| 2021 | 5.784 | 8.739 | 10.000 | 9.250 | 4.800 | 5.182 | 5.909 | 5.478 | ||
| 流量指标 | <F> | 2019 | 50.31 | 106.57 | 116.30 | 107.41 | 27.50 | 31.04 | 34.58 | 36.09 |
| 2020 | 33.28 | 107.91 | 97.32 | 108.00 | 32.86 | 33.26 | 34.11 | 22.00 | ||
| 2021 | 43.30 | 127.87 | 127.76 | 121.25 | 24.20 | 30.09 | 34.91 | 32.09 | ||
| <W> | 2019 | 8.050 | 13.459 | 12.580 | 12.564 | 5.323 | 6.263 | 6.803 | 7.491 | |
| 2020 | 5.873 | 13.202 | 11.211 | 11.729 | 6.765 | 7.182 | 6.396 | 4.125 | ||
| 2021 | 7.486 | 14.632 | 12.776 | 13.108 | 5.042 | 5.807 | 5.908 | 5.857 | ||
| 指标分布 | CV(F) | 2019 | 1.316 | 1.756 | 1.760 | 1.753 | 0.647 | 1.123 | 1.131 | 1.060 |
| 2020 | 1.450 | 1.671 | 1.642 | 1.694 | 0.859 | 0.973 | 0.906 | 0.841 | ||
| 2021 | 1.451 | 1.658 | 1.713 | 1.648 | 0.557 | 1.026 | 0.993 | 1.046 | ||
| CV(W) | 2019 | 1.617 | 2.331 | 2.526 | 2.425 | 0.799 | 1.199 | 1.202 | 1.097 | |
| 2020 | 1.702 | 2.306 | 2.369 | 2.475 | 0.977 | 0.974 | 1.078 | 0.973 | ||
| 2021 | 1.560 | 2.362 | 2.610 | 2.440 | 0.649 | 1.108 | 1.198 | 1.150 | ||
表8 船舶航行网络港口中心性指标全局权重Tab. 8 Global weighting of port centrality indicators for ship navigation networks |
| 时间 | 中介中心性 | 度中心性 | 接近中心性 |
|---|---|---|---|
| 2019-01 | 0.679 4 | 0.233 9 | 0.086 6 |
| 2019-04 | 0.687 8 | 0.204 2 | 0.108 0 |
| 2019-07 | 0.616 6 | 0.255 2 | 0.128 2 |
| 2019-11 | 0.682 1 | 0.244 8 | 0.073 1 |
| 2020-01 | 0.731 5 | 0.216 5 | 0.051 9 |
| 2020-04 | 0.686 6 | 0.211 3 | 0.102 1 |
| 2020-07 | 0.622 1 | 0.219 4 | 0.158 5 |
| 2020-11 | 0.712 8 | 0.233 6 | 0.053 6 |
| 2021-01 | 0.689 4 | 0.232 2 | 0.078 4 |
| 2021-04 | 0.653 9 | 0.208 3 | 0.137 8 |
| 2021-07 | 0.603 5 | 0.263 7 | 0.132 8 |
| 2021-11 | 0.693 8 | 0.223 9 | 0.082 3 |
| [1] |
尹凌, 刘康, 张浩, 等. 耦合人群移动的COVID-19传染病模型研究进展[J]. 地球信息科学学报, 2021, 23(11):1894-1909.
[
|
| [2] |
曹中浩, 张健钦, 杨木, 等. 基于GIS新冠智能体仿真模型及应用——以广州市为例[J]. 地球信息科学学报, 2021, 23(2):297-306.
[
|
| [3] |
周继彪, 马昌喜, 董升, 等. 新冠肺炎疫情下城市公共交通非常规防疫策略——以宁波市为例[J]. 中国公路学报, 2020, 33(11):1-10.
[
|
| [4] |
刘张, 千家乐, 杜云艳, 等. 基于多源时空大数据的区际迁徙人群多层次空间分布估算模型——以COVID-19疫情期间自武汉迁出人群为例[J]. 地球信息科学学报, 2020, 22(2):147-160.
[
|
| [5] |
|
| [6] |
|
| [7] |
|
| [8] |
郭九霞, 杨宗鑫, 夏正洪, 等. 新冠疫情前后机场加权网络抗毁性分析[J]. 中国安全科学学报, 2022, 32(8):91-97.
[
|
| [9] |
|
| [10] |
|
| [11] |
|
| [12] |
|
| [13] |
|
| [14] |
|
| [15] |
|
| [16] |
|
| [17] |
万程鹏, 陶嘉乐, 伍静, 等. 新冠肺炎疫情对中国国际航运网络空间格局影响分析[J]. 交通信息与安全, 2020, 38(2):129-135.
[
|
| [18] |
|
| [19] |
|
| [20] |
|
| [21] |
|
| [22] |
|
| [23] |
| [24] |
|
| [25] |
|
| [26] |
|
| [27] |
|
| [28] |
|
| [29] |
|
| [30] |
|
| [31] |
|
| [32] |
张静, 张智慧, 李小冬, 等. 基于熵权的TOPSIS法的港口军事运输能力评估[J]. 清华大学学报(自然科学版), 2018, 58(5):494-499.
[
|
| [33] |
NOAA Report on the U.S. Marine Economy: Regional and State Profiles[R]. Charleston, SC: Office for Coastal Management, 2021.
|
| [34] |
An Assessment of the Impacts of Climate Change on the Great Lakes[R]. Chicago: Environmental Law & Policy Center, 2019.
|
/
| 〈 |
|
〉 |


