
一种降水降尺度模型:地形约束下的条件生成对抗网络
|
杜晓婉(1997— ),女,新疆乌鲁木齐人,硕士生,主要主要从事多源数据融合研究。E-mail: duxiaowan20@mails.ucas.ac.cn |
收稿日期: 2023-01-24
修回日期: 2023-03-24
网络出版日期: 2023-07-14
基金资助
国家自然科学基金重点基金项目(42230708)
中国科学院先导研究计划项目(XDA20060303)
国家自然科学基金面上项目(42071245)
新疆维吾尔自治区重点研发专项科技计划项目(2022B03001-3)
A Precipitation Downscaling Model: Conditional Generative Adversarial Networks under Terrain Constraints
Received date: 2023-01-24
Revised date: 2023-03-24
Online published: 2023-07-14
Supported by
Key Program of National Natural Science Foundation of China(42230708)
Strategic Priority Research Program of the Chinese Academy of Sciences, Pan-Third Pole Environment Study for a Green Silk Road(XDA20060303)
National Natural Science Foundation of China(42071245)
Key Research and Development Program of Xinjiang Uygur Autonomous Region(2022B03001-3)
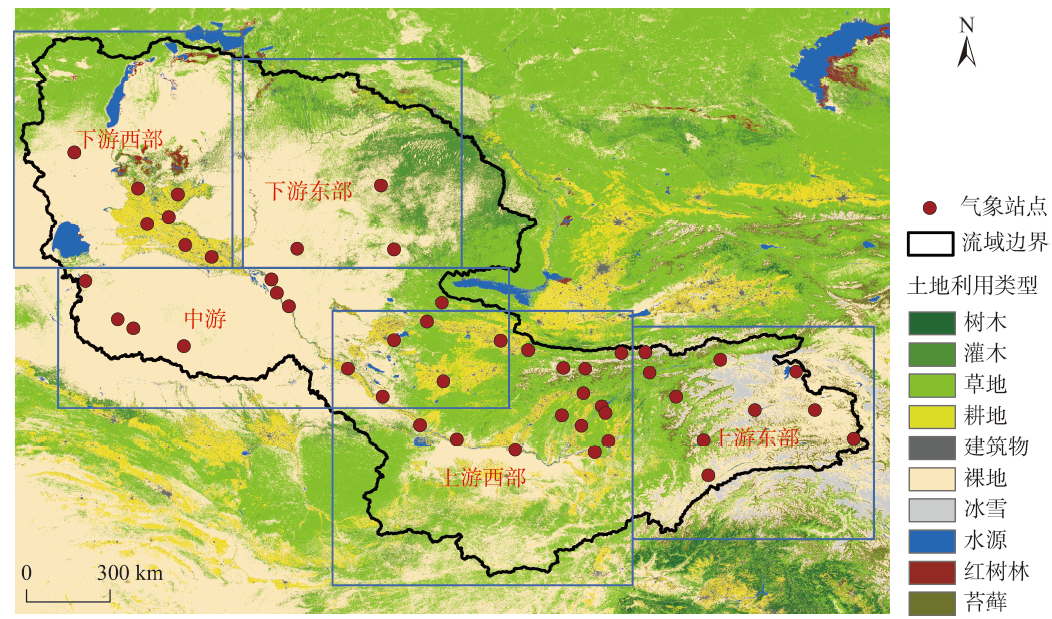
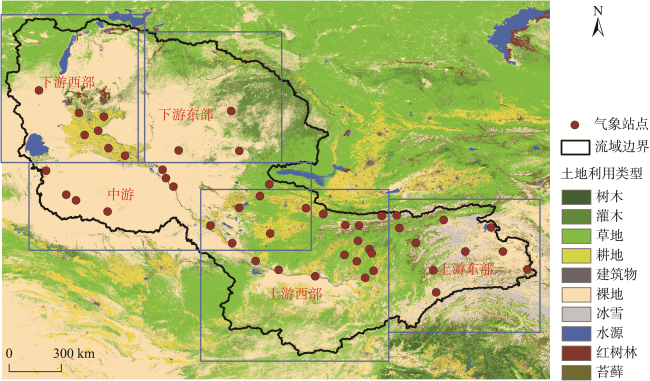
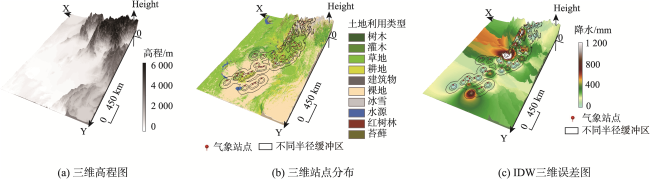
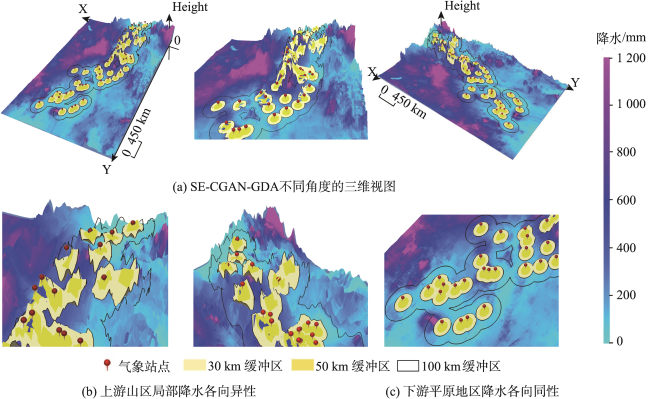
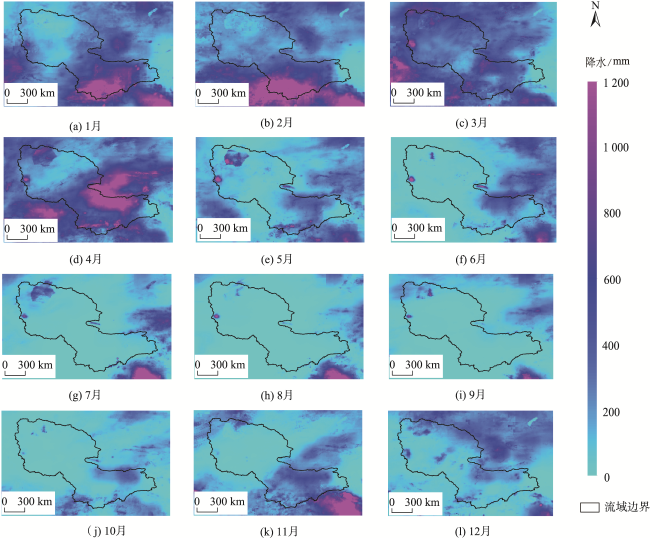
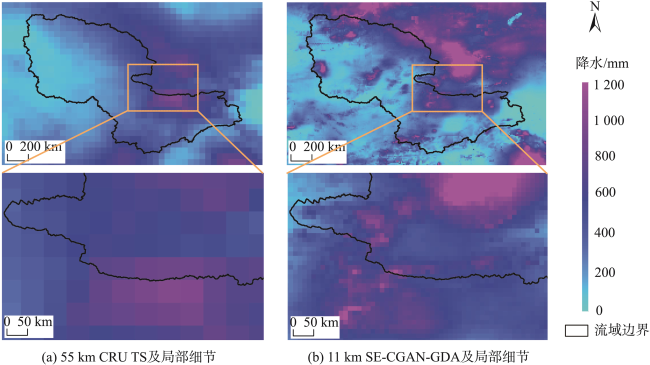
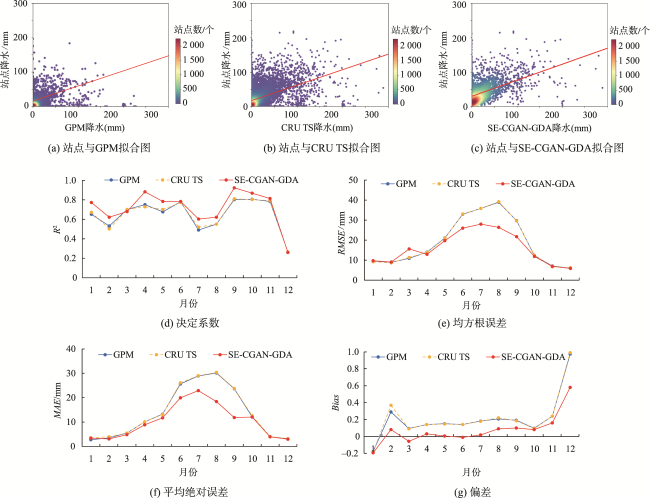
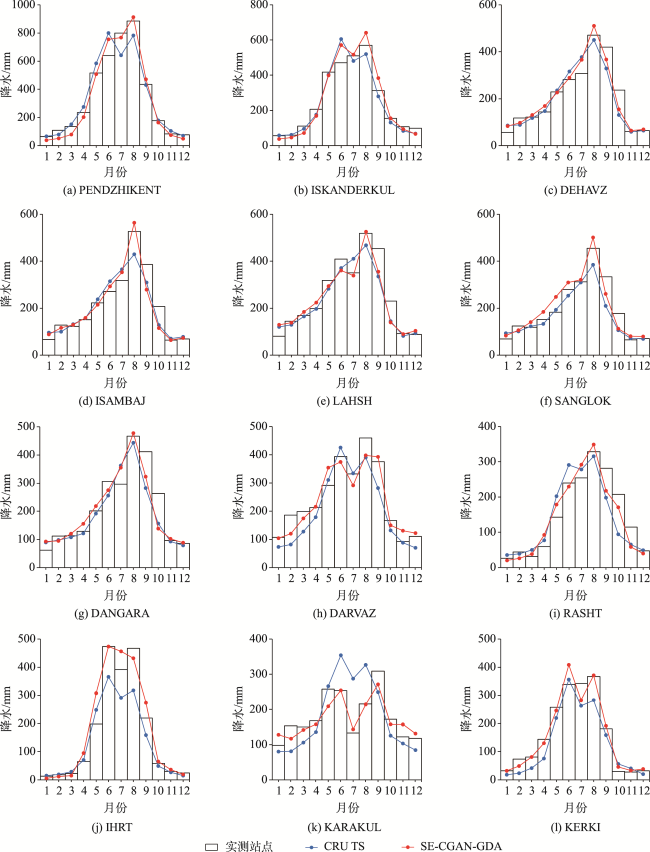
中亚降水数据存在缺失、地理偏差、分辨率低和采集难度大等问题。近年来,神经网络模型被广泛应用于降水降尺度研究。然而,由于山区自然环境复杂多变,普通神经网络模型的预测结果难以解释且适用性差。为此,本文以地理差异分析作为先验知识约束生成式对抗网络,构建一种新的降水降尺度模型,提高了阿姆河流域复杂环境下降水数据的空间分辨率和精度。首先,依据地形数据通过空间变形模型对输入的Climate Research Units Time Series (CRUTS)降水数据进行空间校正。然后,输入校正后的CRUTS降水数据、气温风速湿度等同化数据及遥感数据到条件生成式对抗网络,重建高分辨率降水数据。最后,考虑到山区降水的各向异性,尤其在地形复杂的上游区域,该模型基于气象站点的真值,对降水数据进行了反距离权重的地理差异分析。结果表明,基于地理差异约束生成式对抗网络的降水降尺度模型能够提升复杂环境降水数据的分辨率和精度。针对中亚阿姆河流域的实验表明,本方法可将CRUTS降水数据的分辨率由55 km提升至11 km,其R2值增加了0.34,均方根误差(RMSE)和平均绝对误差(MAE)分别减小19.4 mm和10.65 mm,偏差(Bias)也由原来的0.24降至0.08。本文为数据采集难、地形地貌复杂区域的降水数据空间分辨率的提高,提供了鲁棒性好、普适性强的方法和思路。
杜晓婉 , 陈曦 , 郑宏伟 , 刘英 , 刘铁 , 包安明 , 胡萍 . 一种降水降尺度模型:地形约束下的条件生成对抗网络[J]. 地球信息科学学报, 2023 , 25(8) : 1586 -1600 . DOI: 10.12082/dqxxkx.2023.230033
Most of the precipitation datasets in Central Asia have problems such as data missing, geographical bias and outliers, low resolution, and so on. The normal prediction results obtained by most machine learning methods are usually hard to interpret, not only due to the uncertainties from input information but also due to the complicated global geographical environments as well as the underlying local geographical conditions. In this paper, to overcome this problem, we proposed a novel downscaling precipitation model to adjust and optimize the precipitation computation results from Conditional Generative Adversarial Networks (CGAN) using an inverse distance weighting method based on the prior information of geographical differences of local digital terrain model and multiple weather stations. In this study, the Amu Darya River Basin was selected as the research area due to its various geographical environment and complicated topographic and geographical conditions. First, the input Climate Research Units (CRU) precipitation data with 55 km resolution were spatially corrected based on the topographic map using the spatial deformation model. The spatial deformation model was extended from spatial transformation network methods. Second, we input the corrected CRU precipitation data, temperature, wind speed, humidity equivalent data, and remote sensing data to the CGAN computing framework for high-resolution precipitation reconstruction. The experiment adopted the cross-validation method, taking 80% of the data as the training set, and the remaining 20% as the verification set. The test set contained 20 raster maps of annual precipitation from 2000 to 2019. The model was built based on pytorch 1.10.0, the batch size was 16, and the learning rate was 0.000 3. The epoch was 8 000 iterations in the Adam optimizer for gradient descent. Finally, the precipitation data of meteorological stations were used as the true values for analyzing the geographical differences of inverse distance weights and the accuracy of the corrected precipitation grid data. The results show that the proposed method can improve the resolution and accuracy of precipitation data,especially for the complex terrain and mountainous area. And Experiments on the Amu Darya in Central Asia show that the Root Mean Square Error (RMSE) of the downscaling result within the watershed was 15.96 mm, the Mean Absolute Error (MAE) was 11.82 mm, the R2 value was 0.83, and the deviation was 0.08. This study provides a robust, accurate method for improving the spatial resolution of precipitation data in complex geographical areas.
表1 遥感与同化数据及其来源Tab. 1 Sources of remote sensing data and assimilation data |
| 数据类型 | 数据名称 | 时间分辨率 | 空间分辨率 | 数据来源/方法 |
|---|---|---|---|---|
| 遥感数据 | TRMM数据[33] | 2000—2019年 | 0.25° | http://pmm.nasa.gov/data-acces/downloads/ trmm |
| NDVI数据[34] | 月平均 | 1 km | https://lpdaac.usgs.gov/resources/data-action/aster-ultimate-2018-winter-olympics-observer/ | |
| NDWI数据[34] | ||||
| SRTM数据[35] | 2000-02-11—2000-02-21 | 90 m | http://www.gscloud.cn/ | |
| 陆地同化数据[36] FLDAS | 风速(WS) | 2000—2019年 | 0.25° | https://disc.gsfc.nasa.gov/ |
| 气温(Ta) | ||||
| 蒸散(ET) | ||||
| 湿度(Hum) |
表2 混淆矩阵中的指标Tab. 2 The confusion matrix corresponding to the four indicators |
| 混淆矩阵 | 预报 | ||
|---|---|---|---|
| 正确 | 错误 | ||
| 真实 | 正确 | NA | NC |
| 错误 | NB | ND | |
表3 2000—2019年模型消融实验及精度评估Tab. 3 Model ablation experiment and accuracy evaluation from 2000 to 2019 |
| 检验指标 | Encoded-CGAN | SE-CGAN | Encoded-CGAN-GDA | SE-CGAN-GDA |
|---|---|---|---|---|
| R2 | 0.58 | 0.77 | 0.72 | 0.83 |
| RMSE | 29.73 | 20.34 | 25.26 | 15.96 |
| MAE | 19.51 | 15.22 | 18.90 | 11.82 |
| Bias | 0.24 | 0.18 | 0.19 | 0.08 |
表4 各类算法在不同地区的降水预报准确率评估Tab. 4 Evaluation of precipitation forecast accuracy of various algorithms in different regions |
| 算法 | 分辨率/km | 区域 | 漏报率/% | 空报率/% | 晴雨准确率/% |
|---|---|---|---|---|---|
| CRU TS原始输入数据 | 55 | UE | 10.2 | 11.1 | 87.7 |
| UW | 9.6 | 9.8 | 84.7 | ||
| MD | 8.9 | 9.2 | 90.3 | ||
| DE | 7.7 | 7.9 | 89.9 | ||
| DW | 7.9 | 8.5 | 90.1 | ||
| 双线性插值 | 11 | UE | 9.2 | 8.9 | 94.6 |
| UW | 9.0 | 9.0 | 90.6 | ||
| MD | 8.5 | 8.1 | 92.5 | ||
| DE | 7.9 | 7.8 | 91.1 | ||
| DW | 7.9 | 8.1 | 90.2 | ||
| Encoded-CGAN | 11 | UE | 5.5 | 6.1 | 94.1 |
| UW | 6.1 | 6.3 | 93.2 | ||
| MD | 4.0 | 5.3 | 94.3 | ||
| DE | 4.2 | 4.8 | 95.5 | ||
| DW | 3.9 | 4.2 | 95.3 | ||
| SR-GAN | 11 | UE | 8.1 | 7.8 | 90.0 |
| UW | 8.6 | 7.2 | 90.8 | ||
| MD | 7.7 | 6.8 | 92.4 | ||
| DE | 6.2 | 6.5 | 93.3 | ||
| DW | 6.6 | 6.8 | 93.5 | ||
| SE-CGAN-GDA | 11 | UE | 5.2 | 5.8 | 93.9 |
| UW | 4.9 | 5.6 | 94.4 | ||
| MD | 3.0 | 4.8 | 97.6 | ||
| DE | 3.4 | 4.2 | 96.8 | ||
| DW | 3.5 | 4.2 | 96.6 |
| [1] |
|
| [2] |
|
| [3] |
|
| [4] |
|
| [5] |
|
| [6] |
|
| [7] |
|
| [8] |
李克诚, 陆建忠, 张可睿, 等. 基于改进U-Net的CMIP5全球气候模式降尺度方法及其在鄱阳湖流域的应用[J]. 湖泊科学, 2022, 34(1):320-333.
[
|
| [9] |
|
| [10] |
范丽军, 符淙斌, 陈德亮. 统计降尺度法对未来区域气候变化情景预估的研究进展[J]. 地球科学进展, 2005, 20(3):320-329.
[
|
| [11] |
顾伟宗, 陈丽娟, 李维京, 等. 降尺度方法在中国不同区域夏季降水预测中的应用[J]. 气象学报, 2012, 70(2):202-212.
[
|
| [12] |
范丽军. 统计降尺度方法的研究及其对中国未来区域气候情景的预估[D]. 北京: 中国科学院研究生院(大气物理研究所), 2006.
[
|
| [13] |
|
| [14] |
|
| [15] |
陈文兵, 管正雄, 陈允杰. 基于条件生成式对抗网络的数据增强方法[J]. 计算机应用, 2018, 38(11):3305-3311.
[
|
| [16] |
|
| [17] |
陈凯, 雷少华, 代文, 等. 基于开源数据和条件生成对抗网络的地形重建方法[J]. 地球信息科学学报, 2023, 25(2):252-264.
[
|
| [18] |
|
| [19] |
|
| [20] |
张涛, 李宝林, 袁烨城, 等. 横断山区降水时空分布数据集(1998-2012)[J]. 全球变化数据学报(中英文), 2019, 3(2):168-174,215-221.
[
|
| [21] |
高歆, 袁胜元, 李京忠, 等. 面向稀疏降水站点的套合各向异性贝叶斯地统计估计研究[J]. 地球信息科学学报, 2022, 24(8):1445-1458.
[
|
| [22] |
|
| [23] |
|
| [24] |
|
| [25] |
|
| [26] |
|
| [27] |
|
| [28] |
|
| [29] |
高胖胖. 阿姆河流域径流变化分析与水资源优化配置[D]. 北京: 华北电力大学(北京), 2021.
[
|
| [30] |
陈桃, 包安明, 郭浩, 等. 中亚跨境流域生态脆弱性评价及其时空特征分析——以阿姆河流域为例[J]. 自然资源学报, 2019, 34(12):2643-2657.
[
|
| [31] |
阿也提古丽·斯迪克. 气候变化与人类活动对阿姆河流域水资源及咸海退缩的影响研究[D]. 北京: 中国科学院大学, 2017.
[
|
| [32] |
|
| [33] |
|
| [34] |
|
| [35] |
|
| [36] |
|
| [37] |
|
| [38] |
|
| [39] |
|
| [40] |
|
| [41] |
叶柏生, 杨大庆, 丁永建, 等. 中国降水观测误差分析及其修正[J]. 地理学报, 2007, 62(1):3-13.
[
|
| [42] |
|
| [43] |
|
| [44] |
|
| [45] |
|
| [46] |
|
| [47] |
|
| [48] |
|
| [49] |
|
/
| 〈 |
|
〉 |
