
IMERG和GSMaP对中国极端降水监测能力评估
|
尚 明(1988— ),男,山西运城人,博士,讲师,主要研究方向为遥感及GIS技术应用。E-mail: shangming@hebeu.edu.cn |
收稿日期: 2022-02-07
修回日期: 2022-11-14
网络出版日期: 2023-09-05
基金资助
国家自然科学基金项目(32001130)
河北省自然科学基金项目(C2021402011)
邯郸市科学技术研究与发展计划(21422903273)
河北工程大学博士专项基金项目(SJ2101003040)
Evaluation of IMERG and GSMaP Precipitation Products on Monitoring Extreme Precipitation Events over Mainland China
Received date: 2022-02-07
Revised date: 2022-11-14
Online published: 2023-09-05
Supported by
National Natural Science Foundation of China(32001130)
Natural Science Foundation of Hebei Province(C2021402011)
Science and Technology Research and Development Program of Handan City(21422903273)
PhD Special Fund of Hebei Univerisity of Engineering(SJ2101003040)
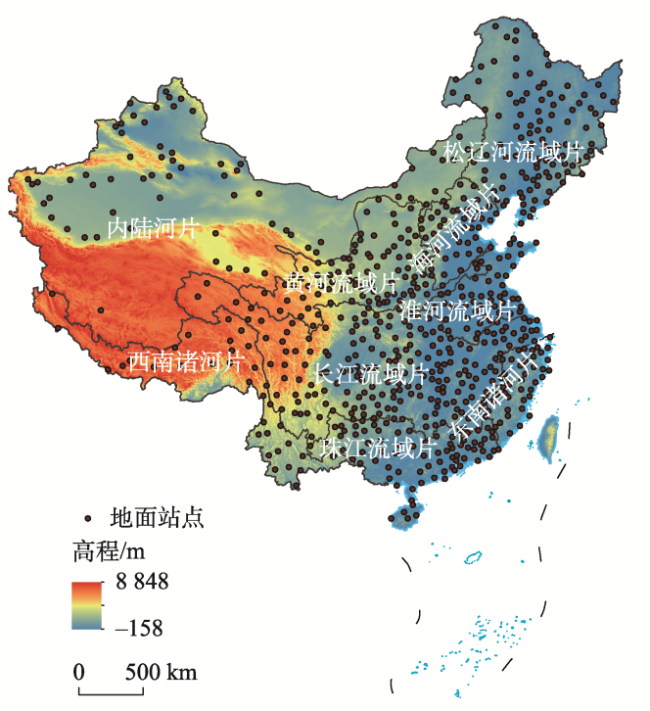
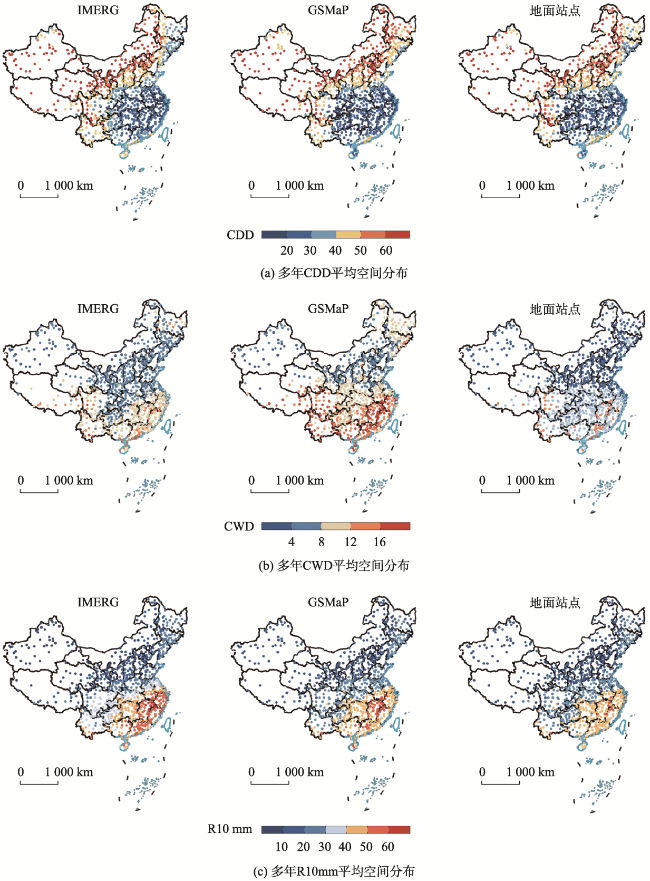
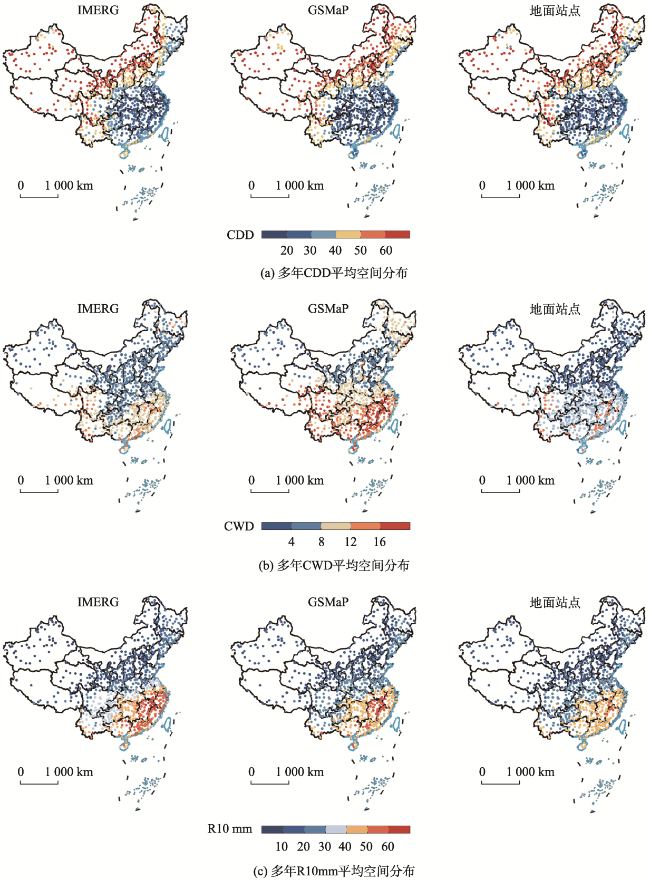
IMERG和GSMaP是GPM时代下2种主流的高分辨率卫星降水产品。为研究其对极端降水的监测能力,以2015—2020年中国698个气象台站逐日降水数据作为基准数据,选取6种极端降水指标及相关统计指标,评价IMERG和GSMaP在中国对极端降水的监测能力。结果表明:① 2种降水产品都可以很好的反映出各极端降水指数的空间分布特征且在低海拔地区对极端降水监测能力优于高海拔地区;② IMERG和GSMaP降水产品在东南诸河片、松辽河流域片和海河流域片等较为湿润的流域相关系数较高,内陆河相关系数较低,误差指标表明在中国GSMaP精度更高;③ 不同阈值下的探测率表现为东南部高于西北部,准确率西北部的较高;低阈值降水的探测率更高,而高阈值降水的准确率更高;另外, GSMaP对于弱降水的探测能力优于IMERG。总体上,IMERG和GSMaP在中国区域对极端降水的监测能力较好,在极端降水研究中有较好的应用前景。

尚明 , 任阳阳 , 宋宏利 , 姚亚楠 , 白磊 , 李悦 , 马杰 . IMERG和GSMaP对中国极端降水监测能力评估[J]. 地球信息科学学报, 2023 , 25(9) : 1813 -1826 . DOI: 10.12082/dqxxkx.2023.220056
The Integrated Multi-satellitE Retrievals for GPM (IMERG) and Global Satellite Mapping of Precipitation (GSMaP) are two high-precision multi-satellite precipitation products. In order to evaluate the applicability of IMERG and GSMaP products (i.e., IMERG_Final and GSMaP_Gauge) for monitoring extreme precipitation events over the Mainland of China, six extreme precipitation indicators and commonly used statistical indexes were selected to quantify the performance of IMERG and GSMaP products by comparing with the gauged daily precipitation data obtained from the 698 meteorological stations in the mainland of China during 2015—2020. The results show that: (1) Both IMERG and GSMaP products can well reflect the spatial distribution characteristics of extreme precipitation indicators in the mainland of China and have better monitoring capability for extreme precipitation in low-altitude areas than that in high-altitude areas; (2) IMERG and GSMaP perform relatively higher accuracy in the Southeast Drainage Basin, the Haihe River Basin, and the Songhua and the Liaohe River Basin, while the accuracy in the Inland Drainage basins show relatively lower accuracy. Based on the result of error indicators, it is found that the accuracy of GSMaP is higher in the mainland area than the other areas; (3) The rate of rainfall detection in the southeast is higher than that in the northwest, while the accuracy is higher in the northwest. The rate of rainfall detection for low-threshold precipitation is higher, while the accuracy for high-threshold precipitation is higher. In addition, the capability of GSMaP in detecting weak precipitation is better than that of IMERG. Overall, IMERG and GSMaP have well monitoring capabilities for extreme precipitation in the mainland of China, which indicates the great prospect of their applications in extreme precipitation research.
Key words: GSMaP; IMERG; China; extreme precipitation; accuracy evaluation
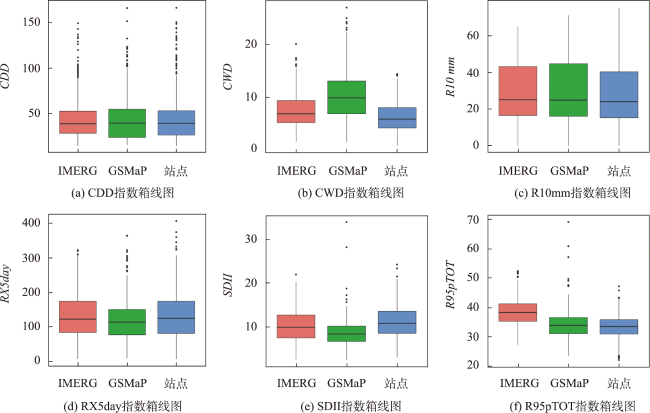
表1 极端降水指数定义Tab. 1 List of the extreme precipitation indices |
| 指标 | 描述 | 单位 |
|---|---|---|
| CDD | 持续干燥指数:日降水量<1 mm的最长连续日数 | d |
| CWD | 持续湿润指数:日降水量≥1 mm的最大持续日数 | d |
| R10 mm | 强降水日数:每年日降水量>=10 mm的总日数 | d |
| RX5day | 5日最大降水量:每月内连续五日的最大降水量 | mm |
| SDII | 普通日降水强度:降水量≥1 mm的总量与日数之比 | mm/d |
| R95pTOT | 极端强降水总量:>95%日降水百分位值的降水量之和 | mm |
图2 2015—2020年中国多年平均极端降水指数空间分布注:该图基于自然资源部标准地图服务网站下载的审图号为GS(2019)1822号的标准地图制作,底图无修改。由于数据获取困难,本研究不包括香港、台湾和澳门。 Fig. 2 Spatial distribution of multi-year average extreme precipitation index from 2015 to 2020 |
图3 2015—2020多年平均极端降水指数空间分布注:该图基于自然资源部标准地图服务网站下载的审图号为GS(2019)1822号的标准地图制作,底图无修改。由于数据获取困难,本研究不包括香港、台湾和澳门。 Fig. 3 Spatial distribution of multi-year average extreme precipitation index from 2015 to 2020 |
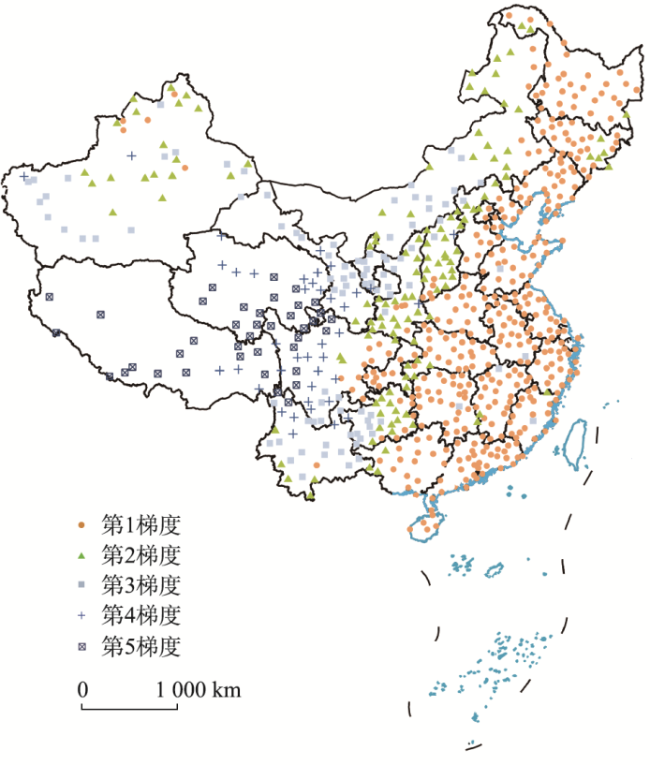
图5 站点高程空间分布注:该图基于自然资源部标准地图服务网站下载的审图号为GS(2019)1822号的标准地图制作,底图无修改。由于数据获取困难,本研究不包括香港、台湾和澳门。 Fig. 5 Spatial distribution of site elevations |
表2 不同梯度极端降水指标误差分析Tab. 2 Error analysis of extreme precipitation index with different gradients |
| 梯度分区 | 站点 数量 | 评价 指标 | CDD | CWD | SDII | RX5day | R10 mm | R95pTOT | |||||||||||
|---|---|---|---|---|---|---|---|---|---|---|---|---|---|---|---|---|---|---|---|
| A | B | A | B | A | B | A | B | A | B | A | B | ||||||||
| 梯度1 (<479 m) | 395 | R | 0.46 | 0.69 | 0.24 | 0.28 | 0.64 | 0.72 | 0.59 | 0.67 | 0.65 | 0.71 | 0.39 | 0.56 | |||||
| RMSE | 12.10 | 8.36 | 3.11 | 5.47 | 2.32 | 3.39 | 49.70 | 45.00 | 6.26 | 6.22 | 7.78 | 4.64 | |||||||
| rRMSE | 0.36 | 0.24 | 0.50 | 0.86 | 0.18 | 0.26 | 0.31 | 0.27 | 0.22 | 0.21 | 0.23 | 0.13 | |||||||
| ME | -2.30 | -1.49 | 1.58 | 4.46 | -1.10 | -3.10 | -0.60 | -19.60 | 2.61 | 3.63 | 5.52 | 0.19 | |||||||
| BIAS(%) | -2.80 | -5.40 | 27.60 | 69.90 | -8.50 | -23.80 | 1.10 | -10.50 | 10.50 | 10.80 | 16.30 | 0.70 | |||||||
| 梯度2 (479~1 128.8 m) | 130 | R | 0.33 | 0.54 | 0.18 | 0.26 | 0.59 | 0.64 | 0.54 | 0.60 | 0.55 | 0.60 | 0.30 | 0.44 | |||||
| RMSE | 17.50 | 12.43 | 2.27 | 4.36 | 1.75 | 2.39 | 29.20 | 29.30 | 4.29 | 4.48 | 7.82 | 5.68 | |||||||
| rRMSE | 0.41 | 0.26 | 0.43 | 0.78 | 0.21 | 0.31 | 0.34 | 0.52 | 0.37 | 0.44 | 0.24 | 0.17 | |||||||
| ME | 2.05 | -1.92 | 0.61 | 3.45 | -0.60 | -1.67 | -2.40 | -6.20 | 0.33 | 1.68 | 4.41 | 0.57 | |||||||
| BIAS(%) | 13.00 | -2.20 | 16.70 | 62.30 | -6.70 | -14.70 | 2.50 | 16.50 | 12.10 | 21.50 | 14.00 | 2.60 | |||||||
| 梯度3(1 128.8~1 990.5 m) | 95 | R | 0.31 | 0.53 | 0.26 | 0.22 | 0.54 | 0.65 | 0.42 | 0.57 | 0.50 | 0.60 | 0.29 | 0.37 | |||||
| RMSE | 21.20 | 16.19 | 2.38 | 3.99 | 1.86 | 2.59 | 30.60 | 28.30 | 4.69 | 4.01 | 8.00 | 6.53 | |||||||
| rRMSE | 0.43 | 0.30 | 0.48 | 0.73 | 0.23 | 0.34 | 0.38 | 0.53 | 0.46 | 0.64 | 0.24 | 0.19 | |||||||
| ME | 5.90 | 0.64 | 0.98 | 3.04 | -0.70 | -1.60 | -6.00 | -8.10 | -0.40 | -0.20 | 3.14 | 1.46 | |||||||
| BIAS(%) | 20.00 | 5.70 | 22.90 | 55.40 | -9.70 | -13.60 | -3.60 | 13.80 | 3.90 | 27.70 | 10.40 | 4.70 | |||||||
| 梯度4 (1 990.5~3 189 m) | 40 | R | 0.18 | 0.53 | 0.15 | 0.07 | 0.59 | 0.65 | 0.43 | 0.58 | 0.54 | 0.59 | 0.15 | 0.39 | |||||
| RMSE | 21.00 | 14.18 | 3.60 | 6.09 | 1.19 | 1.61 | 23.50 | 17.90 | 5.23 | 4.64 | 8.48 | 5.19 | |||||||
| rRMSE | 0.41 | 0.25 | 0.58 | 0.93 | 0.17 | 0.23 | 0.37 | 0.28 | 0.77 | 0.48 | 0.30 | 0.18 | |||||||
| ME | 3.06 | -0.04 | 1.32 | 4.95 | -0.50 | -1.40 | 2.01 | -4.80 | -1.30 | -1.00 | 5.85 | 2.38 | |||||||
| BIAS(%) | 11.70 | 2.00 | 28.00 | 76.10 | -6.20 | -19.30 | 9.80 | -2.00 | 26.90 | 0.40 | 21.50 | 8.70 | |||||||
| 梯度5 (>3 189 m) | 38 | R | 0.21 | 0.53 | 0.25 | 0.27 | 0.44 | 0.53 | 0.31 | 0.46 | 0.48 | 0.56 | 0.18 | 0.42 | |||||
| RMSE | 22.90 | 16.50 | 4.07 | 7.26 | 0.88 | 1.14 | 23.30 | 16.10 | 4.29 | 3.88 | 9.27 | 5.18 | |||||||
| rRMSE | 0.39 | 0.27 | 0.53 | 0.93 | 0.15 | 0.19 | 0.41 | 0.31 | 0.37 | 0.32 | 0.36 | 0.20 | |||||||
| ME | 4.41 | -0.09 | 1.91 | 5.79 | 0.10 | -1.00 | 11.70 | 0.34 | 0.56 | -1.60 | 7.54 | 2.81 | |||||||
| BIAS(%) | 13.90 | 4.70 | 26.90 | 74.40 | 2.60 | -15.80 | 21.90 | 3.70 | 11.40 | -12.30 | 29.70 | 11.10 | |||||||
注:A表示IMERG, B表示GSMaP。 |
表3 GSMaP和IMERG极端降水精度评价指标Tab. 3 Summary of error evaluation indexes for IMERG and GSMaP precipitation products |
| 中国 | 东南诸河片 | 海河流域片 | 淮河流域片 | 黄河流域片 | 内陆河片 | 松辽河流域片 | 西南诸河片 | 长江流域片 | 珠江流域片 | |||||||||||||||||||||
|---|---|---|---|---|---|---|---|---|---|---|---|---|---|---|---|---|---|---|---|---|---|---|---|---|---|---|---|---|---|---|
| A | B | A | B | A | B | A | B | A | B | A | B | A | B | A | B | A | B | A | B | |||||||||||
| CDD | R | 0.41 | 0.63 | 0.43 | 0.75 | 0.58 | 0.68 | 0.41 | 0.61 | 0.38 | 0.57 | 0.17 | 0.45 | 0.55 | 0.69 | 0.36 | 0.62 | 0.28 | 0.60 | 0.50 | 0.70 | |||||||||
| RMSE | 15.60 | 11.50 | 9.10 | 6.40 | 14.10 | 10.80 | 10.30 | 7.80 | 17.20 | 12.40 | 30.40 | 24.20 | 15.30 | 11.90 | 17.40 | 13.80 | 12.70 | 7.40 | 14.20 | 8.80 | ||||||||||
| NRMSE | 0.36 | 0.25 | 0.36 | 0.25 | 0.26 | 0.20 | 0.31 | 0.22 | 0.35 | 0.25 | 0.42 | 0.30 | 0.31 | 0.24 | 0.27 | 0.22 | 0.46 | 0.25 | 0.46 | 0.28 | ||||||||||
| ME | -0.60 | -1.30 | 0.00 | -2.60 | -0.50 | 2.10 | -4.60 | -4.30 | 4.70 | -1.20 | -1.80 | -2.90 | -3.40 | 4.20 | -4.80 | -3.10 | 2.50 | -2.20 | 2.70 | -2.00 | ||||||||||
| BIAS(%) | 2.40 | -2.10 | 2.30 | -8.10 | -0.20 | 4.50 | -13.10 | -12.30 | 10.50 | -1.20 | 6.80 | 2.30 | -5.90 | 9.90 | -4.80 | -1.60 | 12.20 | -7.70 | 13.70 | -4.90 | ||||||||||
| CWD | R | 0.22 | 0.26 | 0.09 | 0.20 | 0.17 | 0.12 | 0.34 | 0.39 | 0.16 | 0.11 | 0.30 | 0.34 | 0.31 | 0.27 | 0.26 | 0.32 | 0.21 | 0.24 | 0.17 | 0.34 | |||||||||
| RMSE | 3.10 | 5.10 | 4.30 | 7.00 | 1.90 | 3.60 | 2.50 | 3.40 | 2.10 | 3.60 | 1.60 | 1.80 | 2.60 | 4.40 | 5.50 | 8.30 | 3.10 | 6.70 | 4.20 | 6.90 | ||||||||||
| NRMSE | 0.52 | 0.82 | 0.51 | 0.81 | 0.48 | 0.88 | 0.50 | 0.68 | 0.44 | 0.74 | 0.61 | 0.67 | 0.55 | 0.92 | 0.66 | 0.99 | 0.41 | 0.90 | 0.49 | 0.81 | ||||||||||
| ME | 1.50 | 4.10 | 2.00 | 5.30 | 1.20 | 2.90 | 1.30 | 2.60 | 0.90 | 2.90 | 0.90 | 1.30 | 1.40 | 3.50 | 2.90 | 6.80 | 1.00 | 5.50 | 1.80 | 5.80 | ||||||||||
| BIAS(%) | 28.00 | 66.00 | 24.0 | 61.50 | 30.70 | 70.10 | 28.50 | 53.10 | 20.40 | 59.00 | 37.50 | 50.70 | 31.70 | 74.50 | 40.50 | 83.80 | 15.10 | 73.40 | 23.30 | 67.60 | ||||||||||
| SDII | R | 0.60 | 0.68 | 0.65 | 0.77 | 0.62 | 0.75 | 0.61 | 0.71 | 0.64 | 0.72 | 0.47 | 0.50 | 0.64 | 0.74 | 0.55 | 0.56 | 0.62 | 0.70 | 0.58 | 0.64 | |||||||||
| RMSE | 2.00 | 2.90 | 1.80 | 3.10 | 2.70 | 3.00 | 3.20 | 3.50 | 1.70 | 2.10 | 1.50 | 2.30 | 2.00 | 2.70 | 1.10 | 2.00 | 1.90 | 2.90 | 2.50 | 4.30 | ||||||||||
| NRMSE | 0.20 | 0.28 | 0.13 | 0.23 | 0.24 | 0.26 | 0.24 | 0.26 | 0.20 | 0.25 | 0.30 | 0.51 | 0.19 | 0.27 | 0.13 | 0.24 | 0.16 | 0.24 | 0.16 | 0.27 | ||||||||||
| ME | -1.00 | -2.40 | 0.20 | -2.90 | -2.30 | -2.70 | -2.50 | -3.10 | -1.10 | -1.80 | -0.80 | 0.00 | -1.20 | -2.50 | -0.20 | -1.80 | -0.40 | -2.60 | -0.20 | -4.00 | ||||||||||
| BIAS(%) | -8.60 | -19.60 | 1.90 | -21.30 | -19.80 | -23.70 | -18.90 | -23.60 | -12.00 | -21.70 | -14.80 | 5.60 | -10.90 | -24.10 | -0.80 | -21.20 | -2.20 | -21.60 | 0.30 | -25.20 | ||||||||||
| RX5day | R | 0.53 | 0.63 | 0.54 | 0.68 | 0.66 | 0.76 | 0.65 | 0.72 | 0.50 | 0.60 | 0.44 | 0.49 | 0.56 | 0.66 | 0.40 | 0.48 | 0.53 | 0.65 | 0.52 | 0.60 | |||||||||
| RMSE | 39.50 | 35.90 | 64.80 | 53.80 | 35.00 | 30.40 | 45.60 | 39.20 | 24.70 | 21.60 | 15.60 | 23.10 | 36.10 | 30.00 | 27.20 | 25.40 | 47.80 | 43.00 | 59.10 | 56.40 | ||||||||||
| NRMSE | 0.34 | 0.37 | 0.35 | 0.28 | 0.30 | 0.25 | 0.30 | 0.25 | 0.33 | 0.27 | 0.53 | 1.20 | 0.34 | 0.27 | 0.32 | 0.34 | 0.31 | 0.26 | 0.27 | 0.25 | ||||||||||
| ME | -0.20 | -12.60 | 6.20 | -29.20 | -8.00 | -8.80 | -4.20 | -17.20 | -0.10 | -4.80 | -1.30 | 8.10 | 0.70 | -9.90 | 6.10 | -6.90 | -3.00 | -21.00 | 1.80 | -23.60 | ||||||||||
| BIAS(%) | 3.00 | 1.00 | 5.70 | -14.90 | -4.20 | -5.80 | -1.40 | -10.60 | 3.20 | -3.70 | 5.40 | 73.60 | 2.60 | -7.60 | 12.40 | -1.00 | 0.60 | -11.60 | 2.90 | -10.00 | ||||||||||
| R10 mm | R | 0.59 | 0.67 | 0.67 | 0.83 | 0.43 | 0.52 | 0.76 | 0.82 | 0.61 | 0.63 | 0.44 | 0.50 | 0.68 | 0.67 | 0.59 | 0.71 | 0.59 | 0.64 | 0.55 | 0.72 | |||||||||
| RMSE | 5.50 | 5.20 | 8.70 | 7.80 | 4.20 | 3.60 | 5.50 | 5.10 | 3.90 | 3.80 | 3.00 | 2.30 | 4.30 | 3.70 | 6.10 | 5.40 | 6.70 | 6.90 | 7.10 | 8.10 | ||||||||||
| NRMSE | 0.35 | 0.35 | 0.19 | 0.16 | 0.27 | 0.24 | 0.23 | 0.21 | 0.30 | 0.27 | 1.18 | 1.43 | 0.26 | 0.22 | 0.37 | 0.27 | 0.19 | 0.19 | 0.16 | 0.18 | ||||||||||
| ME | 1.50 | 1.90 | 3.10 | 3.60 | 1.70 | 2.10 | 3.00 | 3.50 | 0.30 | 0.70 | -0.20 | -0.50 | 2.20 | 0.60 | 1.50 | -1.90 | 1.60 | 3.70 | 0.70 | 4.80 | ||||||||||
| BIAS(%) | 12.60 | 13.70 | 7.80 | 7.00 | 12.00 | 14.30 | 12.50 | 14.30 | 7.40 | 5.00 | 34.70 | 66.10 | 13.60 | 4.40 | 17.80 | -7.90 | 5.10 | 8.90 | 2.50 | 10.80 | ||||||||||
| R95pTOT | R | 0.35 | 0.51 | 0.42 | 0.61 | 0.42 | 0.60 | 0.48 | 0.68 | 0.19 | 0.36 | 0.25 | 0.26 | 0.42 | 0.54 | 0.34 | 0.51 | 0.30 | 0.50 | 0.36 | 0.51 | |||||||||
| RMSE | 8.10 | 5.30 | 5.90 | 3.60 | 10.40 | 5.60 | 10.10 | 4.70 | 9.90 | 5.10 | 9.10 | 9.60 | 8.50 | 5.40 | 6.60 | 5.20 | 6.80 | 4.30 | 5.90 | 4.00 | ||||||||||
| NRMSE | 0.25 | 0.16 | 0.19 | 0.11 | 0.31 | 0.16 | 0.28 | 0.13 | 0.31 | 0.16 | 0.28 | 0.29 | 0.24 | 0.15 | 0.24 | 0.18 | 0.22 | 0.13 | 0.18 | 0.12 | ||||||||||
| ME | 5.20 | 1.00 | 3.50 | -0.70 | 8.00 | 1.70 | 8.40 | 0.90 | 7.40 | 1.30 | 2.10 | 3.30 | 5.90 | 1.20 | 4.00 | 1.80 | 4.50 | -0.50 | 3.30 | -0.20 | ||||||||||
| BIAS(%) | 16.40 | 3.40 | 11.30 | -1.90 | 23.7 | 5.60 | 23.40 | 2.40 | 24.00 | 4.50 | 7.90 | 11.10 | 16.90 | 3.60 | 14.80 | 6.80 | 14.90 | -0.70 | 10.30 | -0.70 | ||||||||||
注:A表示IMERG, B表示GSMaP。 |
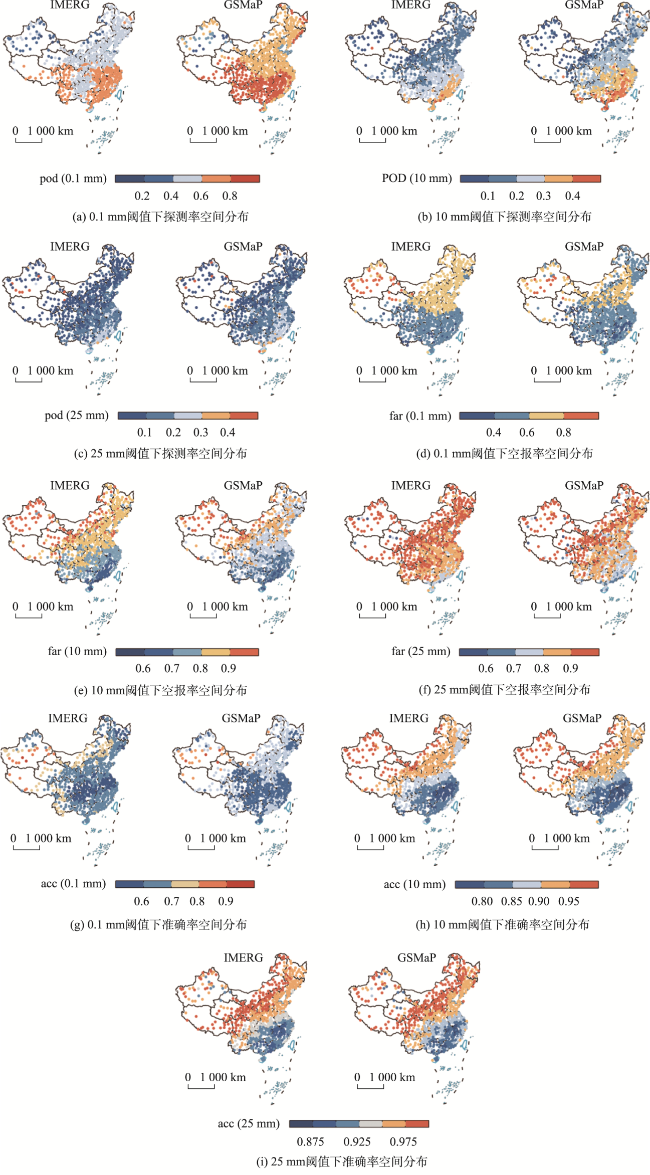
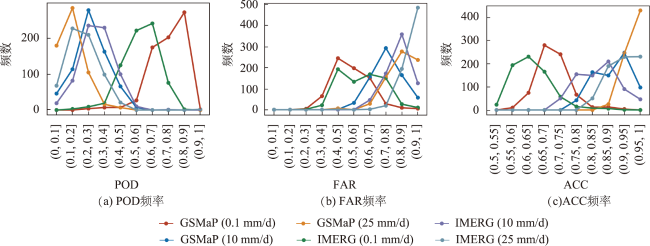
图6 2015—2020年GSMaP和IMERG多年平均探测能力指标空间分布注:该图基于自然资源部标准地图服务网站审图号为GS(2019)1822号的标准地图制作,底图无修改。由于数据获取困难,本研究不包括香港、台湾和澳门。 Fig. 6 Spatial distribution of multi-year average detection capability indicators of GSMaP and IMERG from 2015 to 2020 |
表4 IMERG和GSMaP日降水探测能力指标对比Tab. 4 Summary of detection capability indicators for IMERG and GSMaP daily precipitation under the threshold of 0.1, 10 and 25 mm/d |
| 0.1 mm/d | 10 mm/d | 25 mm/d | ||||||||||
|---|---|---|---|---|---|---|---|---|---|---|---|---|
| POD | FAR | ACC | POD | FAR | ACC | POD | FAR | ACC | ||||
| 全国 | IMERG | 0.429 | 0.418 | 0.648 | 0.224 | 0.763 | 0.882 | 0.129 | 0.861 | 0.952 | ||
| GSMaP | 0.496 | 0.221 | 0.701 | 0.288 | 0.687 | 0.891 | 0.186 | 0.836 | 0.959 | |||
| 东南诸河片 | IMERG | 0.540 | 0.352 | 0.623 | 0.276 | 0.704 | 0.801 | 0.125 | 0.699 | 0.859 | ||
| GSMaP | 0.571 | 0.203 | 0.668 | 0.330 | 0.643 | 0.817 | 0.207 | 0.814 | 0.924 | |||
| 海河流域片 | IMERG | 0.291 | 0.492 | 0.684 | 0.142 | 0.843 | 0.923 | 0.062 | 0.835 | 0.954 | ||
| GSMaP | 0.376 | 0.345 | 0.740 | 0.191 | 0.782 | 0.927 | 0.113 | 0.902 | 0.977 | |||
| 淮河流域片 | IMERG | 0.316 | 0.439 | 0.611 | 0.169 | 0.811 | 0.882 | 0.077 | 0.815 | 0.921 | ||
| GSMaP | 0.418 | 0.311 | 0.702 | 0.225 | 0.741 | 0.890 | 0.153 | 0.855 | 0.956 | |||
| 黄河流域片 | IMERG | 0.335 | 0.479 | 0.662 | 0.132 | 0.863 | 0.929 | 0.044 | 0.852 | 0.962 | ||
| GSMaP | 0.402 | 0.293 | 0.701 | 0.178 | 0.812 | 0.933 | 0.088 | 0.930 | 0.964 | |||
| 内陆河 | IMERG | 0.206 | 0.632 | 0.735 | 0.045 | 0.960 | 0.938 | 0.037 | 0.919 | 0.751 | ||
| GSMaP | 0.298 | 0.437 | 0.776 | 0.079 | 0.930 | 0.953 | 0.056 | 0.945 | 0.621 | |||
| 松辽河流域片 | IMERG | 0.325 | 0.507 | 0.643 | 0.140 | 0.842 | 0.913 | 0.055 | 0.841 | 0.947 | ||
| GSMaP | 0.433 | 0.272 | 0.718 | 0.213 | 0.777 | 0.924 | 0.110 | 0.911 | 0.975 | |||
| 西南诸河片 | IMERG | 0.540 | 0.324 | 0.713 | 0.196 | 0.787 | 0.893 | 0.060 | 0.793 | 0.909 | ||
| GSMaP | 0.538 | 0.147 | 0.721 | 0.260 | 0.755 | 0.909 | 0.127 | 0.918 | 0.948 | |||
| 长江流域片 | IMERG | 0.494 | 0.383 | 0.608 | 0.213 | 0.777 | 0.838 | 0.090 | 0.781 | 0.888 | ||
| GSMaP | 0.541 | 0.185 | 0.667 | 0.276 | 0.697 | 0.849 | 0.161 | 0.856 | 0.933 | |||
| 珠江流域片 | IMERG | 0.545 | 0.377 | 0.656 | 0.310 | 0.683 | 0.827 | 0.161 | 0.679 | 0.871 | ||
| GSMaP | 0.562 | 0.175 | 0.689 | 0.366 | 0.593 | 0.838 | 0.232 | 0.791 | 0.919 | |||
| [1] |
|
| [2] |
刘元波, 傅巧妮, 宋平, 等. 卫星遥感反演降水研究综述[J]. 地球科学进展, 2011, 26(11):1162-1172.
[
|
| [3] |
|
| [4] |
高涛, 谢立安. 近50年来中国极端降水趋势与物理成因研究综述[J]. 地球科学进展, 2014, 29(5): 577-589.
[
|
| [5] |
杨金虎, 江志红, 王鹏祥, 等. 中国年极端降水事件的时空分布特征[J]. 气候与环境研究, 2008, 13(1):75-83.
[
|
| [6] |
高玥, 徐慧, 刘国. GSMaP遥感降水产品对典型极端降水事件监测能力评估[J]. 遥感技术与应用, 2019, 34(5):1121-1132.
[
|
| [7] |
任国玉, 封国林, 严中伟. 中国极端气候变化观测研究回顾与展望[J]. 气候与环境研究, 2010, 15(4):337-353.
[
|
| [8] |
郭瑞芳, 刘元波. 多传感器联合反演高分辨率降水方法综述[J]. 地球科学进展, 2015, 30(8):891-903.
[
|
| [9] |
唐国强, 李哲, 薛显武, 等. 赣江流域TRMM遥感降水对地面站点观测的可替代性[J]. 水科学进展, 2015, 26(3):340-346.
[
|
| [10] |
|
| [11] |
|
| [12] |
|
| [13] |
曾岁康, 雍斌. 全球降水计划IMERG和GSMaP反演降水在四川地区的精度评估[J]. 地理学报, 2019, 74(7):1305-1318.
[
|
| [14] |
|
| [15] |
李彦妮, 黄昌, 庞国伟. 全球降雨计划GSMaP与IMERG卫星降雨产品在陕西地区的精度评估[J]. 干旱区地理, 2022, 45(1):80-90.
[
|
| [16] |
刘若兰, 江善虎, 任立良, 等. 全球降水观测计划IMERG降水产品对中国大陆极端降雨监测能力评估[J]. 中国农村水利水电, 2021(4):57-63.
[
|
| [17] |
李媛媛, 宁少尉, 丁伟, 等. 最新GPM降水数据在黄河流域的精度评估[J]. 国土资源遥感, 2019, 31(1):164-170.
[
|
| [18] |
陈汉清, 鹿德凯, 周泽慧, 等. GPM降水产品评估研究综述[J]. 水资源保护, 2019, 35(1):27-34.
[
|
| [19] |
《第三次气候变化国家评估报告》 编写委员会. 第三次气候变化国家评估报告[M]. 2版. 北京: 科学出版社, 2015.
|
| [20] |
|
| [21] |
刘瑜, 吴裕珍, 冯志州, 等. 多种卫星降水产品对中国极端降雨反演效果评估[J]. 热带地理, 2017, 37(3):417-433.
[
|
| [22] |
刘培, 吴凯, 许怡, 等. 中国大陆TRMM降水多尺度精度评价[J]. 水利水电科技进展, 2018, 38(3):42-47.
[
|
| [23] |
|
| [24] |
刘海文, 丁一汇. 华北汛期日降水特性的变化分析[J]. 大气科学, 2010, 34(1):12-22.
[
|
| [25] |
李乃强, 徐贵阳. 基于自然间断点分级法的土地利用数据网格化分析[J]. 测绘通报, 2020(4):106-110,156.
[
|
| [26] |
王戈飞. 多种降水产品在秦巴山区的精度评估[D]. 西安: 西北大学, 2018.
[
|
| [27] |
李麒崙, 张万昌, 易路, 等. GPM与TRMM降水数据在中国大陆的精度评估与对比[J]. 水科学进展, 2018, 29(3):303-313.
[
|
| [28] |
张茹, 雍斌, 曾岁康. GPM卫星降水产品在中国大陆的精度评估[J]. 人民长江, 2021, 52(5):50-59.
[
|
/
| 〈 |
|
〉 |