
气候干湿冷暖化复合类型的识别与量化方法
|
成星露(1999— ),女,云南丽江人,硕士生,主要研究方向为遥感地物分类。E-mail: Cxl19990908@163.com |
收稿日期: 2023-02-22
修回日期: 2023-03-23
网络出版日期: 2023-11-02
基金资助
北京市卓越青年科学家计划项目(BJJWZYJH01201910028032)
国家重点研发项目(2018YFC1508902)
国家重点研发项目(2017YFC0406006)
国家重点研发项目(2017YFC0406004)
Method to Identify and Quantify Compound Dry(Wet) -Cool(Warm) Climate Trend
Received date: 2023-02-22
Revised date: 2023-03-23
Online published: 2023-11-02
Supported by
Beijing Outstanding Young Scientists Program(BJJWZYJH01201910028032)
National Key Research and Development Project(2018YFC1508902)
National Key Research and Development Project(2017YFC0406006)
National Key Research and Development Project(2017YFC0406004)
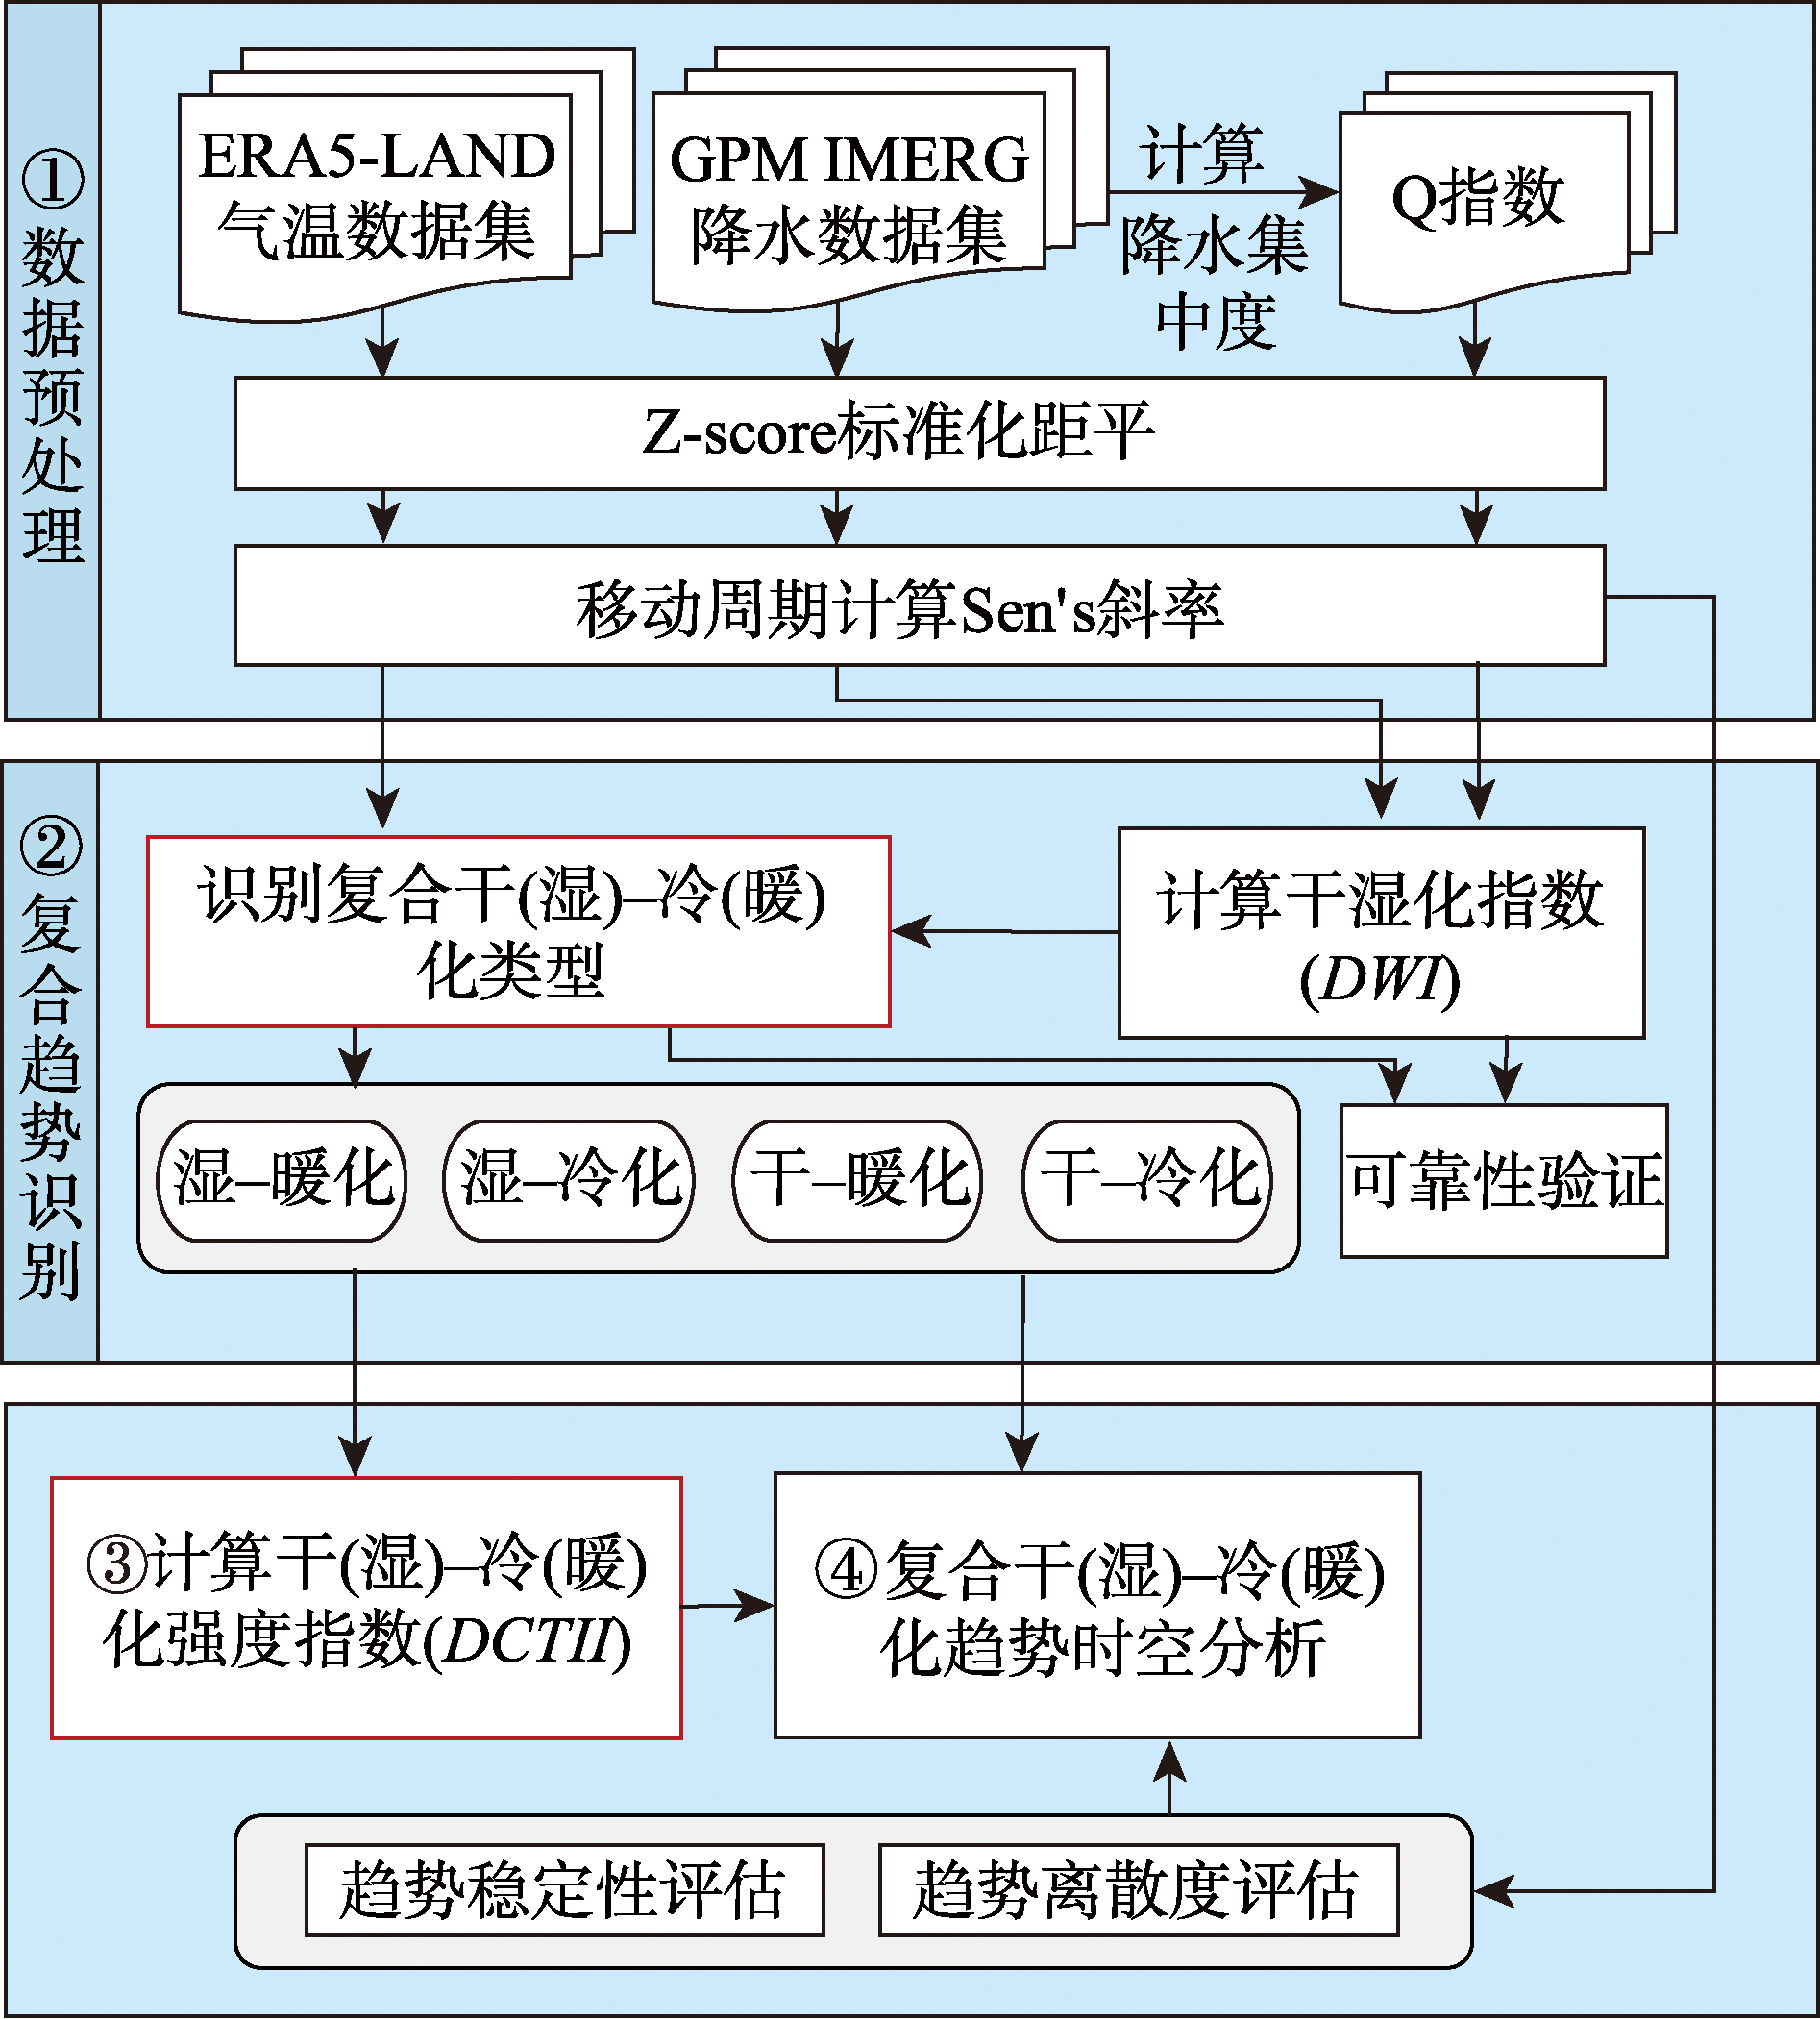
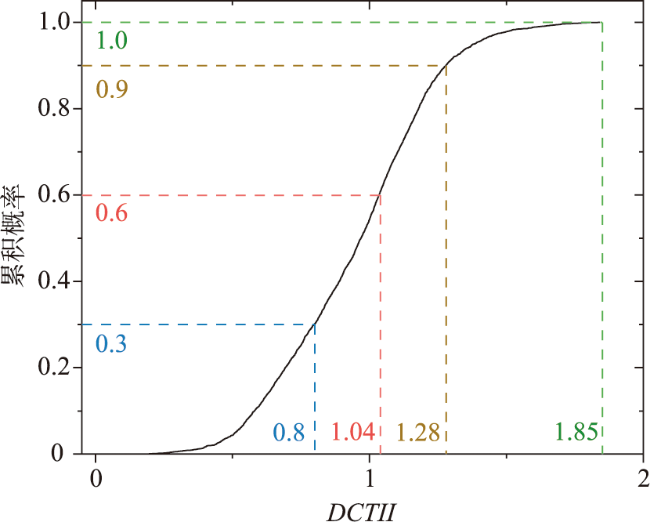
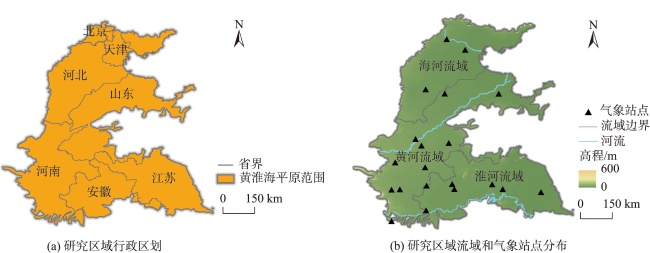
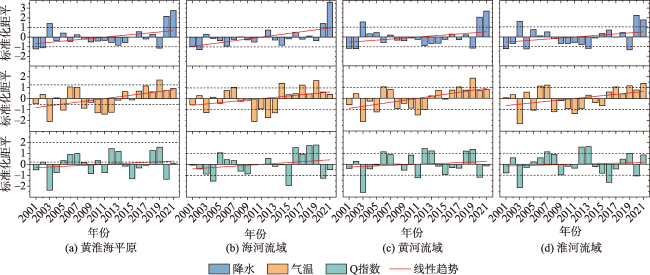
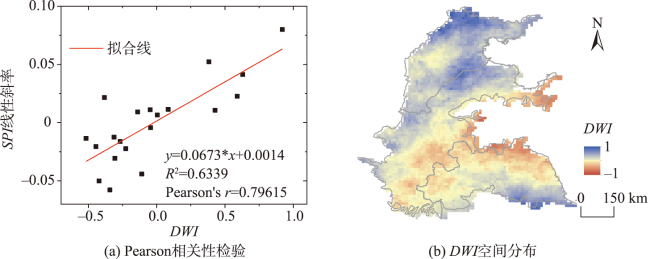
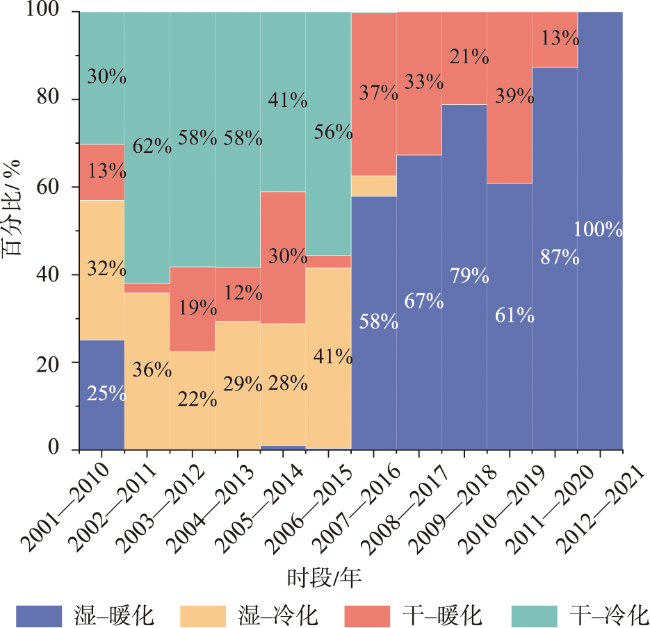
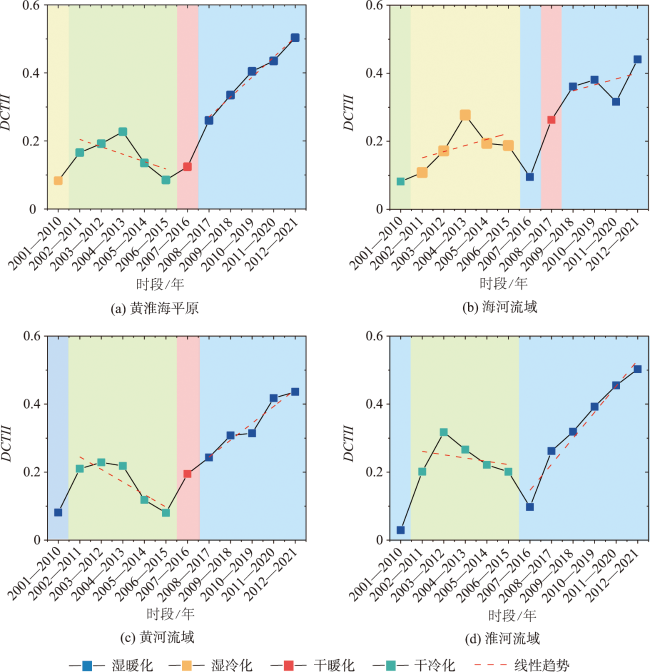
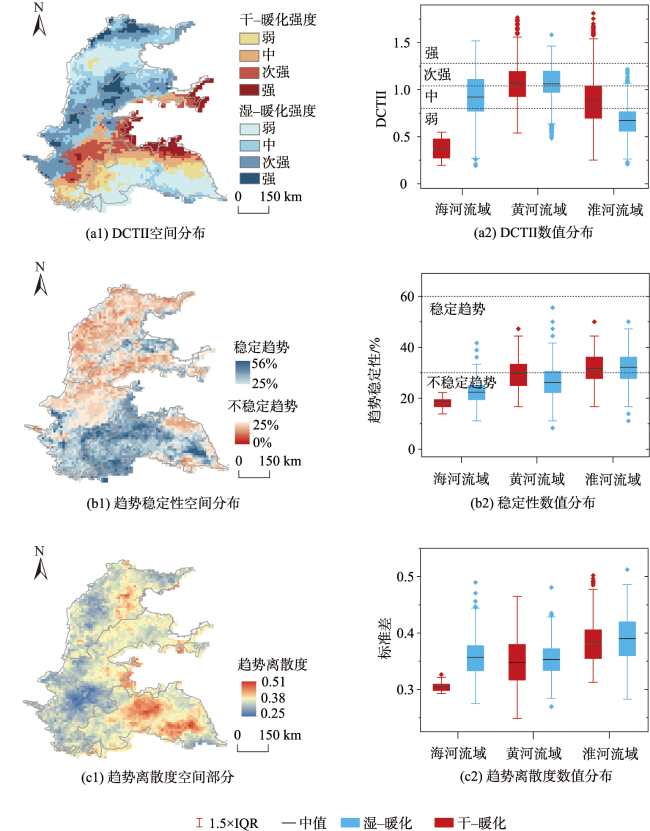
气候变化是21世纪的重大环境问题之一,气温和降水的长期变化趋势作为评估气候变化的重要指标,对研究气候变化模式及程度有着重要意义。基于长时序GPM降水数据及ERA5-Land再分析气温数据,提出了一种复合干(湿)-冷(暖)化类型(包括干-冷化、湿-冷化、干-暖化和湿-暖化)的判定方法,同时,创建了复合干(湿)-冷(暖)化强度指数(DCTII)定量评估复合趋势的变化程度。应用上述方法,探讨了黄淮海平原2001—2021年复合趋势的时空特征。结果表明:① 复合干(湿)-冷(暖)化类型识别及量化方法不仅同时兼顾了干湿结构和冷暖结构的变化模式及变化程度,并且结合了降水在时间中的分布特征,在验证结果中可靠度达到了85%;② 从时间上看,黄淮海平原2007—2018年逐渐从较为干-冷化转变为明显的湿-暖化趋势,并且近年来湿-暖化程度不断增加;③ 从空间上看,2001—2021年黄淮海平原主要呈湿-暖化,部分干-暖化地区集中在黄河以南;④ DCTII结合趋势稳定性及离散度评估得出,强趋势及低离散度趋势大部分位于黄淮海平原东部及沿海地区,稳定趋势则大部分位于北部地区。在3个流域中,黄河流域趋势最强,海河流域内湿-暖化趋势强度要高于干-暖化趋势强度,淮河流域趋势稳定性更为显著。复合干(湿)-冷(暖)识别与量化方法的构建,旨在全球气候变暖的条件下,为干湿/冷暖结构长期变化研究提供思路。
成星露 , 孙永华 , 张王宽 , 王一涵 , 曹许悦 , 王衍昭 . 气候干湿冷暖化复合类型的识别与量化方法[J]. 地球信息科学学报, 2023 , 25(11) : 2204 -2217 . DOI: 10.12082/dqxxkx.2023.230084
Climate change has been one of the most important environmental concerns in the 21st century. Temperature and precipitation are two of the most important variables for evaluating the magnitude and pattern of climate change. Assessing changes in long-term temperature and precipitation trends has important implication for understanding the underlying mechanisms of climate change and developing effective strategies to mitigate its impacts. In this study, we propose a method to identify and quantify compound Dry(wet)-Cool(warm) Trends (DCT) of climate, which include drying-cooling, wetting-cooling, drying-warming, and wetting-warming trends. We use long-term Global Precipitation Measurement (GPM) precipitation data and Fifth Generation European Reanalysis (ERA5-Land) temperature data to test this method. We also create a compound Dry(wet)-Cool(warm) Trend Intensity Index (DCTII) to quantitatively evaluate the magnitude of change in compound trends, which provides a useful tool for analyzing the strength and direction of trends in compound dry(wet)-cool(warm) trends over time. To test the effectiveness of this method, we apply it to analyze the temporal and spatial characteristics of compound trends in the Huang-Huai-Hai Plain, one of the most important agricultural regions in China, from 2001 to 2021. Our results show that: (1) the compound dry(wet)-cool(warm) identification and quantification method not only considers the change pattern and magnitude of dry-wet and cold-warm structures but also integrates the distribution characteristics of precipitation over time. The validation results show a reliability of 85%; (2) temporally, the Huang-Huai-Hai Plain gradually shifted from drying-cooling to wetting-warming from 2007 to 2018, and the wetting-warming trend has been increasing in recent years; (3) spatially, the long-term trend in the Huang-Huai-Hai Plain over the past 20 years was dominated by wetting-warming and drying-warming trends, with most of the areas experiencing wetting-warming trends, mainly distributed in the north of the Yellow River and the southernmost area of the plain; (4) the DCTII combined with trend stability and dispersion evaluation show that the strong trend in the Huang-Huai-Hai Plain is mainly located in the eastern and coastal areas. Among the three basins, the Yellow River Basin has the strongest trend; the intensity of the wetting-warming trend in the Haihe River Basin is higher than that of the drying-warming trend; and the trend stability in the Huaihe River Basin is more significant. Overall, our study highlights the importance of considering both temperature and precipitation in the analysis of climate change. The method we propose offers a useful framework for understanding long-term changes in dry-wet/cold-warm structures under the context of global warming. The findings provide valuable insights into the impact of climate change on the Huang-Huai-Hai Plain, which could help inform future climate change adaptation and mitigation strategies.
表1 复合干(湿)-冷(暖)化类型识别及DCTII表达式Tab. 1 DCT Identification and DCTII Expression |
| 条件 | 类型 | DCTII 计算公式 | 公式编号 | 变量含义 |
|---|---|---|---|---|
| 湿暖化 | (7) | 、 、 分别为 、 、 移动周期计算Sen's斜率的平均值; 为移动周期年数 | ||
| 湿冷化 | (8) | |||
| 干暖化 | (9) | |||
| 干冷化 | (10) |
表2 干(湿)-冷(暖)化类型判断检验结果Tab. 2 The DCT type identification test |
| 站点 | 气温趋势(°/10a) | 类型 | SPI趋势(/10a) | 类型 | 干湿化指数 | 类型 | 验证结果 |
|---|---|---|---|---|---|---|---|
| 北京 | 0.027 8 | 暖化 | 0.080 0 | 湿润化 | 0.919 5 | 湿暖化 | √ |
| 德州 | 0.036 3 | 0.022 6 | 0.589 6 | √ | |||
| 东营 | 0.060 0 | 0.052 2 | 0.382 6 | √ | |||
| 衡水 | 0.034 9 | 0.010 6 | 0.427 7 | √ | |||
| 淮安 | 0.047 9 | 0.011 4 | 0.084 6 | √ | |||
| 淮北 | 0.024 2 | 0.006 6 | 0.005 4 | √ | |||
| 天津 | 0.041 9 | 0.041 3 | 0.630 4 | √ | |||
| 宿迁 | 0.048 5 | 暖化 | 0.011 1 | 湿润化 | -0.047 6 | 干暖化 | × |
| 宿州 | 0.031 5 | 0.009 2 | -0.138 6 | × | |||
| 盐城 | 0.044 9 | 0.021 5 | -0.381 6 | × | |||
| 毫州 | 0.028 2 | 暖化 | -0.020 5 | 干旱化 | -0.444 2 | 干暖化 | √ |
| 阜阳 | 0.042 8 | -0.016 2 | -0.267 0 | √ | |||
| 菏泽 | 0.057 9 | -0.022 4 | -0.226 1 | √ | |||
| 济宁 | 0.052 5 | -0.030 7 | -0.305 4 | √ | |||
| 开封 | 0.062 6 | -0.044 2 | -0.109 0 | √ | |||
| 漯河 | 0.046 8 | -0.057 8 | -0.341 4 | √ | |||
| 濮阳 | 0.065 3 | -0.004 3 | -0.044 2 | √ | |||
| 商丘 | 0.041 8 | -0.013 5 | -0.516 4 | √ | |||
| 信阳 | 0.038 0 | -0.012 5 | -0.311 0 | √ | |||
| 周口 | 0.061 4 | -0.050 0 | -0.421 5 | √ |
| [1] |
National Academies Of Sciences E A M. Attribution of extreme weather events in the context of climate change[M]. Washington, DC: The National Academies Press, 2016.
|
| [2] |
Usgcrp. Climate science special report fourth National Climate Assessment[M]. Washington, DC:U.S. Global Change Research Program, 2017:470.
|
| [3] |
Ipcc. Climate change 2021:the Physical Science Basis. Contribution of working Group I to the sixth assessment report of the Intergovernmental Panel on climate change[M]. Cambridge,
|
| [4] |
|
| [5] |
|
| [6] |
|
| [7] |
|
| [8] |
|
| [9] |
|
| [10] |
孟宪贵, 郭俊建, 韩永清. ERA5再分析数据适用性初步评估[J]. 海洋气象学报, 2018, 38(1):91-99.
|
| [11] |
|
| [12] |
|
| [13] |
|
| [14] |
|
| [15] |
|
| [16] |
|
| [17] |
|
| [18] |
|
| [19] |
|
| [20] |
|
| [21] |
|
| [22] |
|
| [23] |
|
| [24] |
|
| [25] |
|
| [26] |
|
| [27] |
|
| [28] |
|
| [29] |
|
| [30] |
|
| [31] |
|
| [32] |
|
| [33] |
|
| [34] |
|
| [35] |
|
| [36] |
|
| [37] |
|
| [38] |
|
| [39] |
|
| [40] |
|
| [41] |
|
| [42] |
韩海涛, 胡文超, 陈学君, 等. 三种气象干旱指标的应用比较研究[J]. 干旱地区农业研究, 2009, 27(1):237-241, 247.
[
|
| [43] |
|
| [44] |
|
| [45] |
|
| [46] |
|
| [47] |
|
| [48] |
|
| [49] |
孔宇. 中国大陆GPM/IMERG产品的精度评估[D]. 南京: 南京信息工程大学, 2017.
[
|
| [50] |
|
| [51] |
|
| [52] |
|
| [53] |
郭斌, 邢文雪, 李云, 等. 基于TRMM 3B43产品的1998—2016年黄淮海平原降水时空特征研究[J]. 地理科学, 2021, 41(7):1285-1294.
|
| [54] |
王胜杰, 赵国强, 王旻燕, 等. 1961—2020年黄河流域气候变化特征研究[J]. 气象与环境科学, 2021, 44(6):1-8.
|
| [55] |
李翔翔, 居辉, 刘勤, 等. 基于SPEI-PM指数的黄淮海平原干旱特征分析[J]. 生态学报, 2017, 37(6):2054-2066.
|
| [56] |
|
| [57] |
|
| [58] |
|
| [59] |
|
/
| 〈 |
|
〉 |
