
工业污染对癌症影响的挖掘方法:改进的空间同位模式
|
张玲莉(1997— ),女,云南昆明人,硕士生,主要研究方向为空间数据挖掘。E-mail: zlily9424@163.com |
收稿日期: 2023-03-25
修回日期: 2023-06-22
网络出版日期: 2023-12-05
基金资助
国家自然科学基金项目(62276227)
国家自然科学基金项目(61966036)
国家自然科学基金项目(62266050)
云南省基础研究计划重点项目(202201AS070015)
云南省创新团队项目(2018HC019)
Mining the Influence of Industrial Pollution on Cancer: An Improved Spatial Co-location Pattern
Received date: 2023-03-25
Revised date: 2023-06-22
Online published: 2023-12-05
Supported by
National Natural Science Foundation of China(62276227)
National Natural Science Foundation of China(61966036)
National Natural Science Foundation of China(62266050)
Yunnan Fundamental Research Projects(202201AS070015)
Project of Innovative Research Team of Yunnan Province(2018HC019)
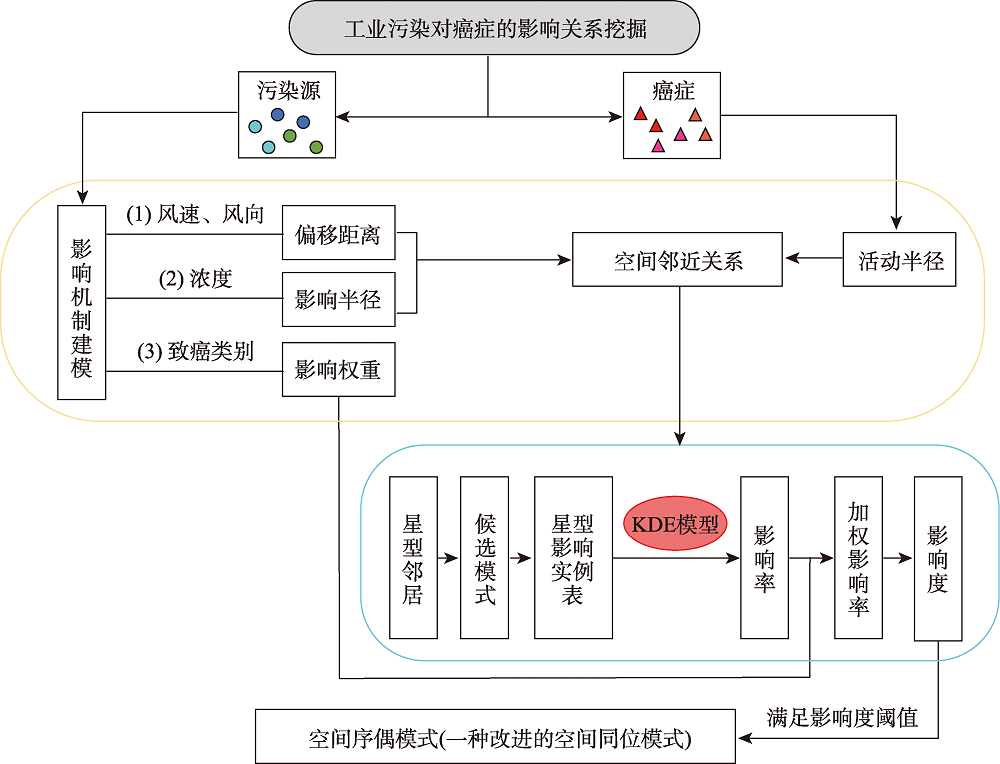
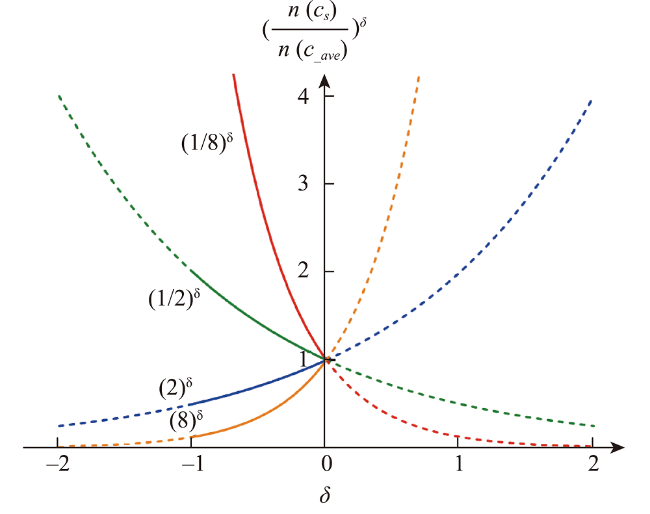
引起人类患癌的原因,环境污染占比60%。空间同位(co-location)模式挖掘算法可以识别其实例在地理空间中频繁邻近的模式,可应用于探究工业排放的室外空气污染物与癌症的潜在联系。传统的空间同位模式挖掘算法在衡量模式兴趣度时通常基于模式实例出现频次计算其频繁性,但污染源实例对癌症实例的影响还与实例之间的距离相关,加之污染源受气象条件、浓度大小、危害程度等因素的影响具有差异性,因此不能只依靠实例出现次数度量其兴趣度。为此,基于高斯核密度估计模型提出了空间序偶模式及相应挖掘算法,高斯核函数可以较好地刻画污染源对癌症病例的影响随距离衰减的过程,为了尽可能地还原污染源在真实世界中的扩散情况,将城市风向、风速以及污染源排放浓度考虑在内定义了新的空间邻近关系度量准则,并且对污染源所属致癌类别进行了归类,对不同致癌类别的污染物进行加权区分,提出了更加新颖的污染源与癌症关系模式的度量和相应的挖掘算法。最后,在真实和合成数据集上验证了所提度量和挖掘算法的有效性和高效率,结果表明,提出的影响度度量较传统参与度度量更能捕获现实生活中更具有现实意义的空间序偶模式,且相较于同类型算法挖掘效率平均提高了60%左右。
张玲莉 , 王丽珍 , 杨培忠 . 工业污染对癌症影响的挖掘方法:改进的空间同位模式[J]. 地球信息科学学报, 2023 , 25(12) : 2340 -2360 . DOI: 10.12082/dqxxkx.2023.230148
About 60% of all known causes of cancer are related to environmental pollution. Identifying the spatial co-location pattern of prevalent neighbor spatial feature sets in geographical space is important to explore the potential relationship between industrial outdoor air pollutants and cancer risk. The traditional spatial co-location pattern mining algorithms usually calculate the prevalence of co-locations based on the frequency of cancer instances when measuring pattern interest. However, the influence of pollution source on cancer instances is also dependent on their proximity. In addition, pollution sources are also influenced by factors such as meteorological conditions, concentration levels, and the degree of harm. So, the pattern interest cannot be measured by relying solely on the number of instance occurences. To address this issue, a new spatial co-location pattern (called spatial ordered-pair pattern) is defined, and a novel mining algorithm is proposed based on the Gaussian kernel density estimation model. The Gaussian kernel function can well capture the decay of the influence of pollution sources on cancer cases with distance. To better represent the real-world diffusion of pollution sources, a spatial neighbor relationship between pollution source and cancer is defined, which considers urban wind direction, wind speed, and pollution emission concentration. Furthermore, pollution sources are categorized into different carcinogenic groups, and a weighted differentiation method is employed to distinguish pollutants based on their carcinogenic categories. The influence of various pollutants on cancer is calculated by weighting their contributions by the "carcinogenic coefficient." Therefore, a novel metric of the influence of pollution sources on cancer along with corresponding mining algorithm is presented. It not only effectively measures the impact of distance between pollution sources and cancer instances on the prevalence patterns but also models the mechanism of the influence of pollution sources on cancer by incorporating real-world conditions, overcoming the limitations of the traditional methods. Furthermore, this study improves the robustness of the method by using a smoothing factor to mitigate mining anomalies caused by uneven distributions of cancer instances. Finally, the effectiveness and efficiency of the metric and the mining algorithm proposed in this study are tested through experiments on real and synthetic datasets, and insights are also provided for cancer prevention and urban planning for Yunnan Province. The experimental results indicate that both the influence degree and participation index can accurately reflect the pattern interest from both macroscopic and microscopic perspectives. Furthermore, the mining efficiency increases by an average of 60% compared to other algorithms. The proposed influence degree measurement can more effectively capture spatial co-location patterns and can better reflect the impact of pollution sources on the incidence of cancer.
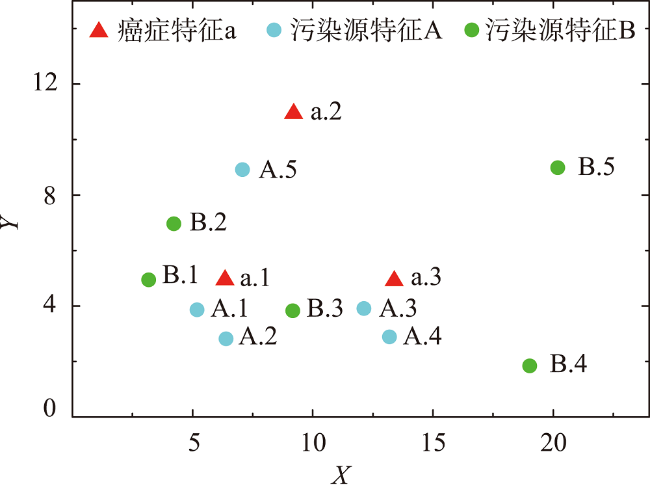
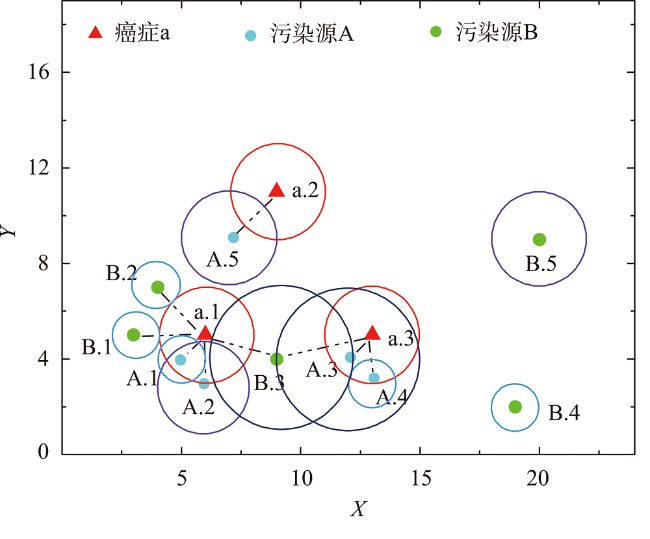
表1 候选模式的星型影响实例表示例Tab. 1 An example of star effect instance table of candidate patterns |
| 候选模式 | [A, a] | [B, a] | [{A, B}, a] |
|---|---|---|---|
| {{A.1, A.2}, a.1} | {{B.1, B.2, B.3}, a.1} | {{{A.1, A.2}, {B.1, B.2, B.3}}, a.1} | |
| 星型影响实例表 | {{A.5}, a.2} | {{B.3}, a.3} | {{{A.3, A.4}, {B.3}}, a.3} |
| {{A.3, A.4}, a.3} |
注:表格中的A,B表示污染源特征,a表示癌症特征,数字代表实例序号,如A.1表示污染源特征A的第一个实例,候选模式星型影响实例表的生成依据定义10与图5中的数据计算得到。 |
| 算法1 基于KDE模型的空间序偶模式挖掘算法 |
|---|
| 输入:1污染源空间数据集 ,癌症空间数据集 2拉伸系数 ,风速 3污染源实例影响半径 、 、 ;癌症病人活动半径 4致癌系数 , , 5平滑因子 6影响度阈值 输出:所有频繁空间序偶模式 变量: :带有局部平均浓度信息的污染源实例集 :污染源实例的全局平均浓度集 :所有癌症实例的星型邻居集 :模式的阶数 : 阶候选模式 : 的星型影响实例表集 : 阶频繁模式 步骤: 1 = get_wind_influence_PS( , , ) 2 = get_local_mean_Concentration( ) 3 = get_global_mean_Concentration( ) 4 = gen_star_neighbor_set ( ) 5 = gen_candidate_patterns ( ) 6 =2 7 WHILE( NULL) = gen_InsTable ( , ) = gen_prev_SOPP ( ) = gen_candidate_patterns( ) k=k+1 8 RETURN |
表2 数据集Tab. 2 Data Set |
| 数据集 | 污染源(特征/实例) | 癌症(特征/实例) | 数据分布(经度97 °E—107 °E、纬度20 °N—30 °N) |
|---|---|---|---|
| 真实数据集 | 19(A-S)/9294 | 28(a-beta)/28797 | 真实地理坐标 |
| 合成数据集1 | 19(A-S)/9294 | 28(a-beta) /28797 | 随机分布 |
| 合成数据集2 | 10(A-J)/10000 | 10(a-j)/10000 | 随机分布 |
| 合成数据集3 | 10(A-J)/20000 | 10(a-j)/20000 | 随机分布 |
| 合成数据集4 | 10(A-J)/30000 | 10(a-j)/30000 | 随机分布 |
| 合成数据集5 | 10(A-J)/40000 | 10(a-j)/40000 | 随机分布 |
表3 2阶频繁模式频繁指数极值Tab. 3 The extreme values of the prevalence indices of size-2 patterns |
| 数据集 | 影响度 | 参与度 | |||||
|---|---|---|---|---|---|---|---|
| 最小值 | 最大值 | 平均值 | 最小值 | 最大值 | 平均值 | ||
| 真实数据集 | 0 | 0.628 | 0.211 | 0 | 0.443 | 0.099 | |
| 合成数据集1 | 0 | 1.000 | 0.253 | 0 | 0.518 | 0.128 | |
表4 top_10模式对比Tab. 4 Top_10 patterns comparison |
| Top_10 | Kde_SOPPMA | 排序 | PI- SOPPMA | 排序 |
|---|---|---|---|---|
| [颗粒物,TBL(气管、支气管和肺癌)] | 0.628 | 1 | 0.443 | 1 |
| [酸雾,肝癌] | 0.610 | 2 | 0.074 | 292 |
| [钴及其化合物,TBL] | 0.601 | 3 | 0.036 | 441 |
| [酸雾,TBL] | 0.596 | 4 | 0.061 | 343 |
| [烟尘,TBL] | 0.575 | 5 | 0.166 | 70 |
| [苯并芘,TBL] | 0.569 | 6 | 0.023 | 497 |
| [颗粒物,结直肠癌] | 0.563 | 7 | 0.341 | 9 |
| [苯并芘,骨癌} | 0.559 | 8 | 0.032 | 463 |
| [颗粒物,子宫癌] | 0.550 | 9 | 0.367 | 4 |
| [颗粒物,骨癌] | 0.541 | 10 | 0.302 | 22 |
表5 Top_100模式中癌症特征及实例数分布情况Tab. 5 Distribution of cancer characteristics and the number of examples in the TOP_100 patterns |
| 排序 | Kde_SOPPMA | PSSOPP_OA | ||||
|---|---|---|---|---|---|---|
| 癌症特征 | 实例数/个 | 占比/% | 癌症特征 | 实例数/个 | 占比/% | |
| 1 | o | 1 592 | 5.5 | w | 104 | 0.3 |
| 2 | w | 104 | 0.3 | t | 362 | 1.2 |
| 3 | d | 1 637 | 5.6 | p | 291 | 1.0 |
| 4 | g | 449 | 1.5 | y | 127 | 0.4 |
| 5 | x | 470 | 1.6 | u | 132 | 0.4 |
| 6 | alpha | 308 | 1.0 | f | 359 | 1.2 |
| 7 | e | 2 032 | 7.0 | |||
| 8 | k | 1 065 | 3.7 | |||
表6 按影响度排序的部分挖掘结果Tab. 6 Partial mining results sorted by influence degree |
| 空间序偶模式 | 影响度 |
|---|---|
| [{颗粒物},TBL(气管、支气管和肺癌)] | 0.966 |
| [{颗粒物},结直肠癌] | 0.905 |
| [{颗粒物,烟尘,酸雾,苯并芘},骨癌] | 0.903 |
| [{颗粒物,铅及其化合物,烟尘,酸雾},肝癌] | 0.876 |
| [{颗粒物,酸雾,苯并芘,二噁英类},乳腺癌] | 0.870 |
| [{颗粒物},子宫癌] | 0.857 |
| [{烟尘,酸雾,苯并芘,二噁英类},头颈部癌] | 0.830 |
| [{颗粒物},淋巴癌] | 0.819 |
| [{六价铬及其化合物,酸雾,镍及其化合物,二噁英类},白血病] | 0.808 |
| [{颗粒物,烟尘,酸雾,苯并芘},腹部恶性肿瘤] | 0.763 |
| [{颗粒物,烟尘,酸雾,二噁英类},宫颈癌] | 0.754 |
| [{颗粒物,烟尘,酸雾},胰腺癌] | 0.751 |
| [{颗粒物,酸雾,苯并芘,二噁英类},胸部恶性肿瘤] | 0.739 |
| [{铅及其化合物,镉及其化合物,砷及其化合物,镍及其化合物},盆腔癌] | 0.716 |
| [{铅及其化合物,镉及其化合物,砷及其化合物,六价铬及其化合物},脑癌] | 0.699 |
| [{颗粒物,铅及其化合物,烟尘,酸雾},肾癌] | 0.670 |
| [{烟尘,酸雾,苯并芘,二噁英类},眼耳部恶性肿瘤] | 0.669 |
| [{烟尘,酸雾,苯并芘,二噁英类},皮肤癌] | 0.628 |
| [{颗粒物,镉及其化合物,烟尘,酸雾},胃癌] | 0.626 |
| [{颗粒物,烟尘,酸雾,镍及其化合物},甲状腺癌] | 0.618 |
| [{铅及其化合物,酸雾,镍及其化合物,二噁英类},肢体恶性肿瘤] | 0.610 |
| [{颗粒物,烟尘,酸雾},胆部恶性肿瘤] | 0.609 |
| [{烟尘,酸雾,苯并芘,二噁英类},卵巢癌] | 0.517 |
| [{颗粒物,二氧化硫},前列腺癌] | 0.488 |
| [{颗粒物,酸雾,苯并芘,二噁英类},食管癌] | 0.453 |
| [{颗粒物,二氧化硫,烟尘,苯并芘},肛门癌] | 0.440 |
| [{颗粒物,二氧化硫},膀胱癌] | 0.415 |
| [{颗粒物,石油类,烟尘,氯类致癌物},垂体恶性肿瘤] | 0.336 |
表7 top_10模式影响度排序Tab. 7 top_10 patterns influence degree sequence |
| 模式 | 未进行混杂控制 | 进行混杂控制 | |
|---|---|---|---|
| 全体肺癌病例 | 吸烟肺癌病例 | 未吸烟肺癌病例 | |
| [{颗粒物},肺癌] | 0.733 267 | 0.547 896 | 0.663 529 |
| [{颗粒物,二氧化硫},肺癌] | 0.707 699 | 0.537 499 | 0.660 082 |
| [{颗粒物,烟尘},肺癌] | 0.703 397 | 0.537 169 | 0.602 412 |
| [{颗粒物,烟尘,酸雾},肺癌] | 0.698 457 | 0.470 928 | 0.659 817 |
| [{颗粒物,二氧化硫,烟尘},肺癌] | 0.693 392 | 0.533 641 | 0.591 096 |
| [{颗粒物,烟尘,苯并芘},肺癌] | 0.6899 48 | 0.451 520 | 0.646 803 |
| [{颗粒物,二氧化硫,苯并芘},肺癌] | 0.674 282 | 0.408 540 | 0.641 783 |
| [{颗粒物,苯并芘},肺癌] | 0.671 279 | 0.405 032 | 0.638 911 |
| [{颗粒物,汞及其化合物,烟尘},肺癌] | 0.664 098 | 0.499 861 | 0.571 227 |
| [{颗粒物,酸雾},肺癌] | 0.653 135 | 0.421 261 | 0.606 689 |
表8 进行混杂控制与未进行混杂控制时top_50、top_100模式中相同模式百分比Tab. 8 Percentage of the same patterns in top_50 and top_100 patterns with or without confounding control (%) |
| 模式 | 吸烟 | 未吸烟 |
|---|---|---|
| Top_50 | 72 | 88 |
| Top_100 | 69 | 90 |
| [1] |
|
| [2] |
|
| [3] |
|
| [4] |
|
| [5] |
|
| [6] |
|
| [7] |
|
| [8] |
|
| [9] |
|
| [10] |
|
| [11] |
|
| [12] |
|
| [13] |
|
| [14] |
|
| [15] |
|
| [16] |
|
| [17] |
|
| [18] |
杨培忠, 王丽珍, 王晓璇, 等. 一种基于列计算的空间并置模式挖掘方法[J]. 中国科学:信息科学, 2022, 52(6):1053-1068.
[
|
| [19] |
|
| [20] |
|
| [21] |
|
| [22] |
胡添, 刘涛, 杜萍, 等. 空间同位模式支持下城市服务业关联发现及特征分析[J]. 地球信息科学学报, 2021, 23(6):969-978.
[
|
| [23] |
徐振, 荆耀栋, 毕如田, 等. 基于资源环境数据格网化表达的关联模式发现[J]. 地球信息科学学报, 2018, 20(1):28-36.
[
|
| [24] |
谢旺, 王丽珍, 陈红梅, 等. 基于空间序偶模式挖掘污染源与癌症病例的关系[J]. 数据分析与知识发现, 2021, 5(2):14-31.
[
|
| [25] |
邓星. 典型地域的风向特征研究[J]. 风能, 2017(8):46-51.
[
|
| [26] |
|
/
| 〈 |
|
〉 |
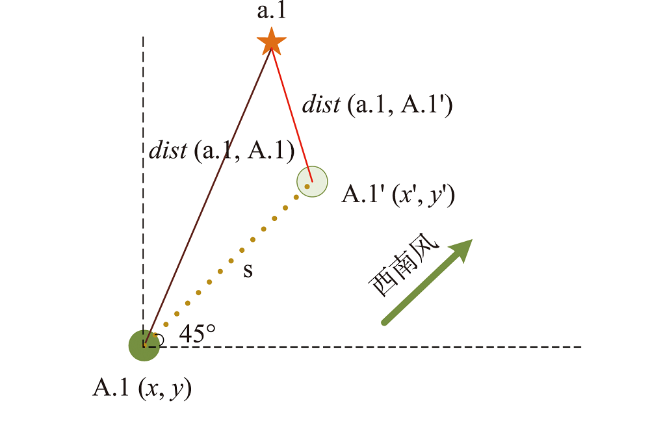
 表示污染源实例影响范围不超过半径为1、2、3的圆;
  表示癌症病例活动范围不超过半径为2的圆。
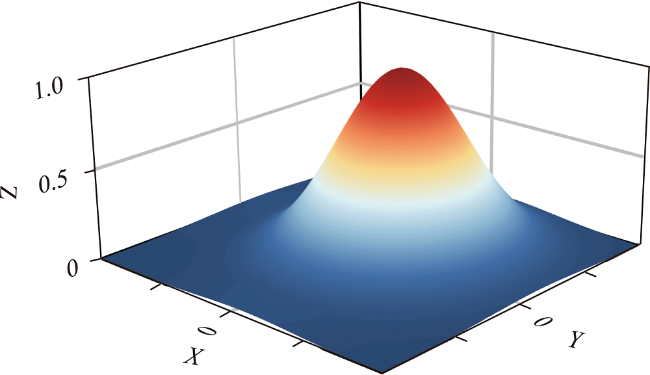