
融合特征交叉与用户历史行为序列的微地图推荐
|
杨 军(1973— ),男,宁夏吴忠人,博士,教授,主要从事深度学习、三维模型空间分析、遥感大数据智能解译、地理信息系统等研究。E-mail: yangj@mail.lzjtu |
Copy editor: 蒋树芳
收稿日期: 2023-03-11
修回日期: 2023-06-12
网络出版日期: 2024-03-26
基金资助
国家自然科学基金项目(42261067)
2021年度中央引导地方科技发展资金(2021-51)
兰州市人才创新创业项目(2020-RC-22)
兰州交通大学天佑创新团队(TY202002)
甘肃省教育厅优秀研究生“创新之星”项目(2023CXZX-548)
Integration of Feature Interaction and User Historical Behavior Sequence for WeMaps Recommendation
Received date: 2023-03-11
Revised date: 2023-06-12
Online published: 2024-03-26
Supported by
National Natural Science Foundation of China(42261067)
2021 Central Government Funds for Guiding Local Science and Technology Development(2021-51)
Talent Innovation and Entrepreneurship Project of Lanzhou City(2020-RC-22)
Tianyou Innovation Team of Lanzhou Jiaotong University(TY202002)
Gansu Provincial Department of Education Excellent Graduate "Innovation Star" Project(2023CXZX-548)
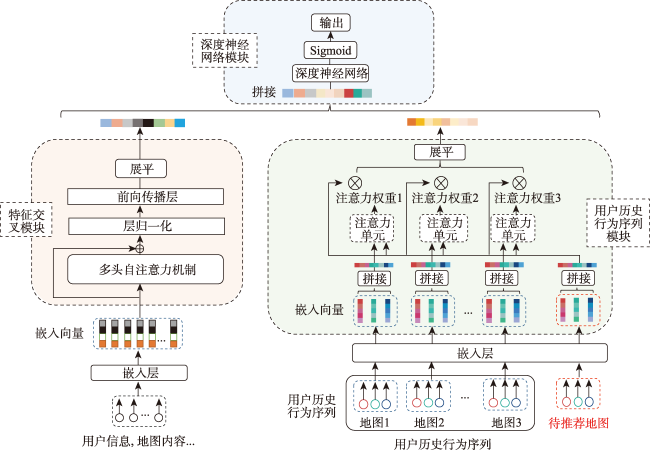
针对现有微地图(WeMaps)推荐算法未充分挖掘用户与微地图特征,推荐结果准确率较低的问题,提出融合特征交叉与用户历史行为序列的微地图推荐算法。首先,在用户与地图特征交叉过程中通过引入跳跃连接和多头自注意力机制,让不同特征组合能够自动获得权重,并通过在多个子空间下进行特征交叉获得了更丰富的特征组合信息。其次,在用户历史行为序列中引入了交叉注意力机制,捕捉与候选地图相关的兴趣点。最后,融合特征交叉和用户行为序列模块的输出,获得了综合多个维度的推荐结果。在公开数据集Criteo和自制微地图(WeMaps)数据集上的对数损失值分别为0.446 1、0.379 7,受试者操作特征曲线下面积值(Area Under the ROC Curve, AUC)分别为0.805 2、0.788 3。相较于本文对比实验中的二阶特征交叉模型,损失值分别降低了1.7%、14.2%,AUC值提高了0.8%、0.4%。相较于本文对比实验中的高阶特征交叉模型,损失值平均降低了1.3%、2.6%, AUC值平均提高了0.6%,0.2%。较低的损失值和较高的AUC值说明模型进行预测时具有较高的准确性和较好的分类能力。实验结果表明,本文算法不但能为用户提供更为准确的推荐结果,也能使推荐结果具备良好的可解释性。
杨军 , 王琛锡 , 闫浩文 . 融合特征交叉与用户历史行为序列的微地图推荐[J]. 地球信息科学学报, 2024 , 26(1) : 158 -169 . DOI: 10.12082/dqxxkx.2024.20230119
The existing WeMaps recommendation algorithm cannot fully exploit the features of users and maps, resulting in a low recommendation accuracy. In this study, a WeMaps recommendation algorithm is proposed which combines feature interaction and user history behavior sequence. To begin with, a multi-head attention mechanism and skip connections are introduced in the process of feature interaction between the user and the map. The multi-head attention mechanism allows for interactions between different features in multiple subspaces, resulting in richer feature combinations. The skip connections combine low-level and high-level feature interactions, ensuring model effectiveness and avoiding the occurrence of model degradation. Additionally, a cross-attention mechanism is incorporated into the user's historical behavior sequence to identify the points of interest related to the candidate map. This mechanism effectively captures points of interest within the user's historical behavior sequence that align with the recommended map. It assigns greater attention to the recommended map that corresponds to the user's short-term dynamic interests. Finally, by utilizing a deep neural network, the output results from the feature interaction module and the user's historical behavior sequence module are fused together, resulting in a more accurate recommendation that takes multiple dimensions into consideration. The values of log loss on the public datasets Criteo and WeMaps datasets are 0.446 1, and 0.379 7, respectively, and the values of area under the receiver operating characteristic curve are 0.805 2, and 0.788 3, respectively. For convenience of expression, the area under the receiver operating characteristic curve will be referred to as AUC in the following text. Compared to the second-order feature interaction model in the experimental study of this paper, the loss values decreases by 1.7% and 14.2%, respectively, while the AUC values increases by 0.8% and 0.4%, respectively. Compared to the high-order feature interaction model in the experimental study of this paper, the average decrease in loss values is 1.3% and 2.6%, respectively, while the average increase in AUC values is 0.6% and 0.2%, respectively. When the model has a low loss value and a high AUC value, it indicates that the model has a small discrepancy between its predicted results on the training data and the actual labels, and the model is capable of effectively distinguishing between positive and negative examples at different thresholds. This is generally considered as a good indicator of model performance, indicating that the model has higher accuracy and better classification ability. Experimental results show that the model proposed in this paper can not only provide users with more accurate recommendation results but also make the recommendation results have good explainability.
表1 旅游微地图数据集的数据结构Tab. 1 Data structure of tourism WeMaps dataset |
| 实体类别 | 特征名称 | 特征值 |
|---|---|---|
| 用户 | 用户id | 1 118 |
| 年龄 | 26 | |
| 性别 | 男 | |
| 职业 | 学生 | |
| 所处省/市 | 甘肃,兰州 | |
| 历史点击序列(每个数字代表一个地图id) | 36, 56, 69, 39, 74, 7, 66, 52 | |
| 地图 | 地图id | 32 |
| 地图所属省/市/区 | 四川,阿坝藏族羌族自治州,若尔盖县 | |
| 地图作者id | 369 | |
| 地图内容 | 若尔盖花湖生态旅游区,河它温泉谷,格尔底寺,白龙江大峡谷,湿地保护区…… | |
| 预测目标(用户是否点击,0-未点击,1-点击) | 1 | |

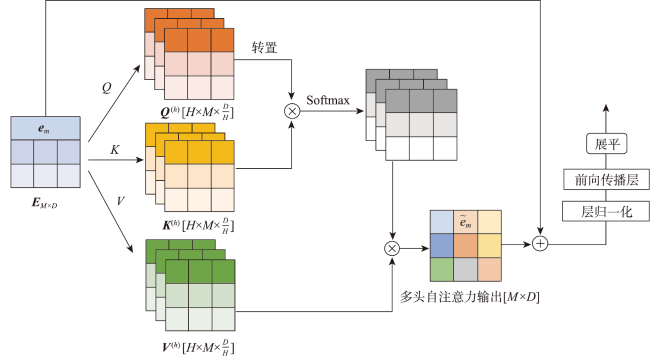
图3 特征交叉模块的细部结构注: em为地图第m个特征的嵌入向量, $\boldsymbol{E}_{m \times D}$为多个特征嵌入向量拼接后得到的矩阵; Q、K、V为$\boldsymbol{E}_{m \times D}$经不同线性变换后得到的结果,$Q^{(k)}$、$K^{(k)}$、$K^{(k)}$为Q、K、V映射到多个注意力头下的矩阵,$[H\times M\times\frac DH]$是其维度, H为注意力头数,M为地图的特征数,D为特征嵌人向量的维度; $\tilde{\boldsymbol{e}}_{m}$为所有注意力头空间下自注意力机制计算结果的组合。 Fig. 3 Detailed architecture diagram of the feature interaction module |
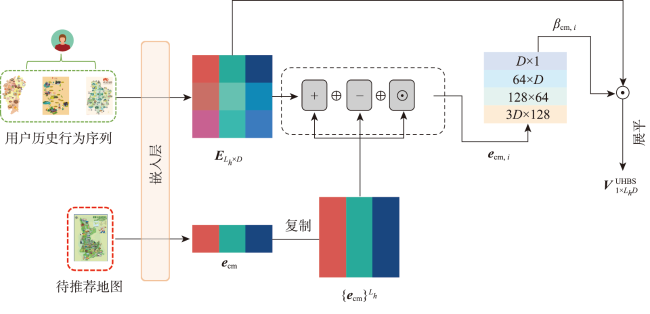
图4 用户历史行为序列模块的细部结构注: $E_{L_{h^{\times D}}}$为用户历史行为序列中的地图经嵌人后的矩阵,其中Lh为历史行为序列长度,D为嵌入向量的维度;ecm为候选地图的嵌入向量; $\{e_{\mathrm{cm}}\}^{L_h}$为ecm复制Lh,次后拼接得到的矩阵; $e_{\mathfrak{cm},i}$为$\{e_{\mathrm{cm}}\}^{L_h}$与$E_{L_{h^{\times D}}}$多种交叉方式后的交叉结果; $\beta_{\mathfrak{cm},i}$为$E_{L_{h^{\times D}}}$中的向量ei,与$\{e_{\mathrm{cm}}\}^{L_h}$计算得到的相关性值;$ V_{_{1}\times L_{h}D}^{\mathrm{UHBS}}$为用户历史行为序列模块最终的输出结果。 Fig. 4 Detailed architecture diagram of the user historical behavior sequence module |
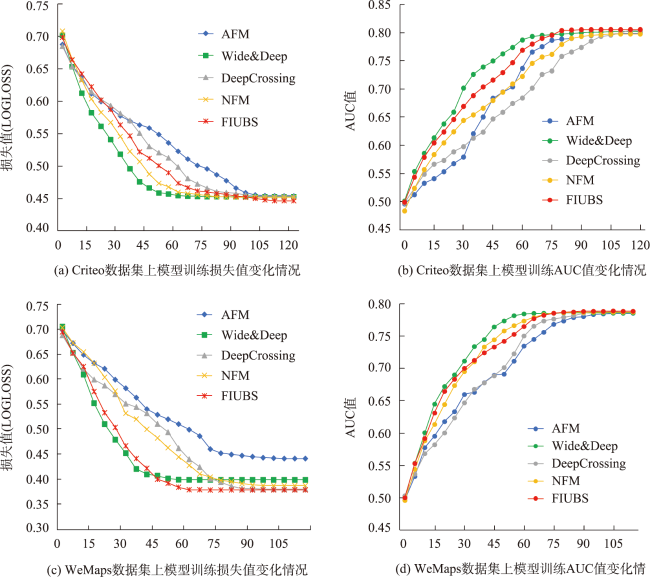
表2 不同算法在Criteo和WeMaps数据集上实验得到的损失值及AUC值结果比较Tab. 2 Comparison of Logloss values and AUC values obtained from experiments on the Criteo and WeMaps datasets using different algorithms |
| 模型类别 | 算法名称 | Criteo | WeMaps | |||
|---|---|---|---|---|---|---|
| Logloss | AUC | LogLoss | AUC | |||
| 二阶交叉 | AFM | 0.453 7 | 0.798 5 | 0.442 4 | 0.785 2 | |
| 高阶交叉 | Wide&Deep | 0.452 4 | 0.801 4 | 0.399 8 | 0.785 6 | |
| DeepCrossing | 0.452 6 | 0.803 3 | 0.381 4 | 0.788 1 | ||
| NFM | 0.451 3 | 0.797 3 | 0.388 3 | 0.786 9 | ||
| 本文算法 | 0.446 1 | 0.805 2 | 0.379 7 | 0.788 3 | ||
表3 特征交叉模块与用户历史行为序列模块对文本算法的影响对比Tab. 3 Comparison of the impact of the feature interaction module and the user history behavior sequence module on the proposed algorithms in this paper |
| 数据集 | 模型名称 | Logloss | AUC |
|---|---|---|---|
| Criteo | 模型A | 0.450 7 | 0.798 1 |
| 模型B | 0.451 4 | 0.801 7 | |
| WeMaps | 模型A | 0.385 6 | 0.787 3 |
| 模型B | 0.384 2 | 0.787 6 |
| [1] |
闫浩文, 张黎明, 杜萍, 等. 自媒体时代的地图:微地图[J]. 测绘科学技术学报, 2016, 33(5):520-523.
[
|
| [2] |
牛雪磊, 杨军, 闫浩文. 融合知识图谱与协同过滤的微地图推荐[J/OL]. 地球信息科学学报. https://link.cnki.net/urlid/11.5809.P.20230830.1132.002.
[
|
| [3] |
|
| [4] |
|
| [5] |
|
| [6] |
|
| [7] |
|
| [8] |
|
| [9] |
|
| [10] |
|
| [11] |
|
| [12] |
|
| [13] |
|
| [14] |
|
| [15] |
|
| [16] |
|
| [17] |
|
| [18] |
|
| [19] |
|
| [20] |
|
| [21] |
|
| [22] |
|
| [23] |
|
| [24] |
|
| [25] |
|
/
| 〈 |
|
〉 |