
中国城市居民心理压力程度时空格局及与休闲设施供给的关系
|
高非凡(1998— ),女,河北廊坊人,硕士生,主要从事城市休闲与健康城市研究。E-mail: gaofeifan@whu.edu.cn |
Copy editor: 蒋树芳 黄光玉
收稿日期: 2022-04-09
修回日期: 2022-09-05
网络出版日期: 2024-03-27
基金资助
国家自然科学基金项目(42271182)
广东省哲学社会科学规划项目(GD20SQ21)
Spatial-temporal Pattern of Residents' Psychological Distress Degree and its Relationship with Leisure Facilities in China
Received date: 2022-04-09
Revised date: 2022-09-05
Online published: 2024-03-27
Supported by
National Natural Science Foundation of China(42271182)
Philosophy and Social Sciences Planning Project of Guangdong Province(GD20SQ21)
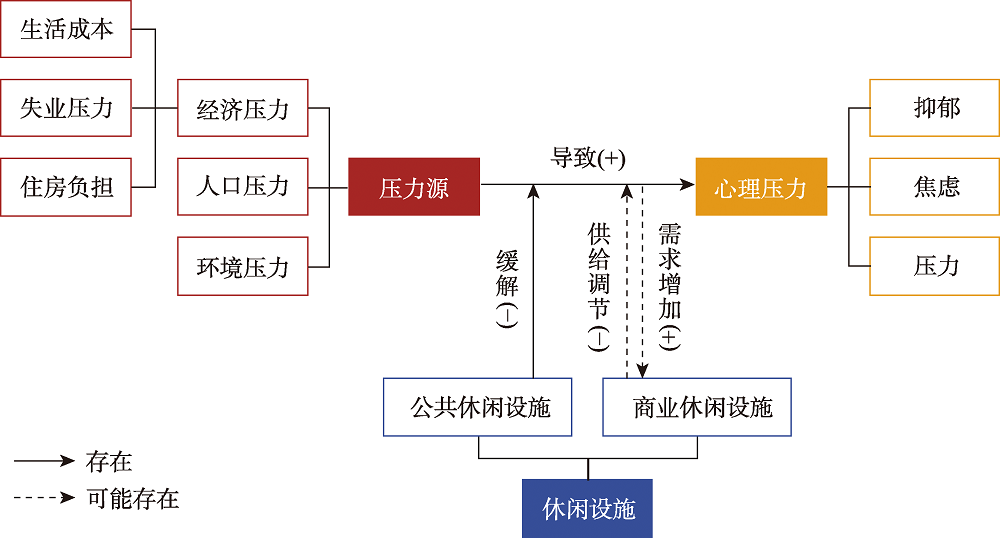
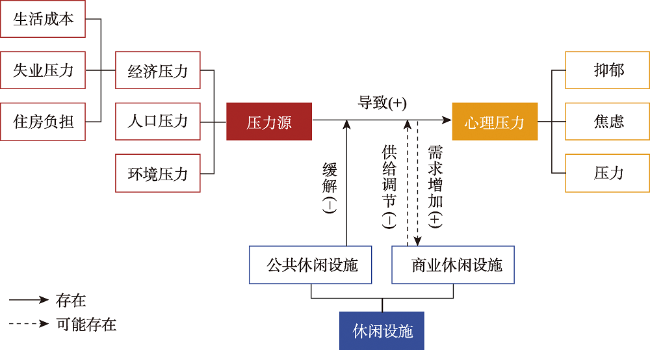
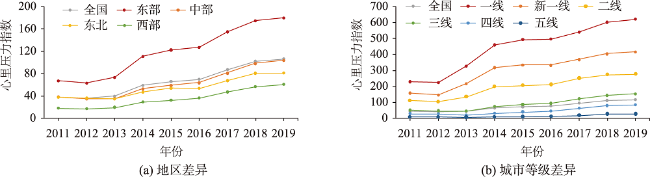
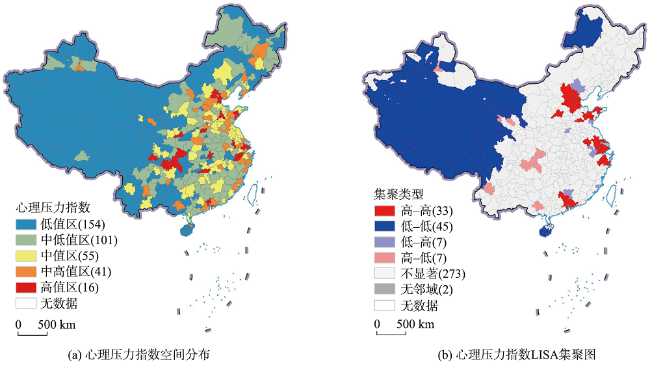
随着近年我国全面进入高质量发展阶段,高水平的城市休闲供给愈加重要。面向“人民对美好生活的向往”,系统探究城市休闲设施供给与居民心理健康的关系具有重要意义。为此,本文提出地区“心理压力指数”(Psychological Distress Index,简称PDI)这一概念,以城市为基本单元,基于百度搜索指数进行测算,刻画了2011—2019年PDI的时空分布格局,在控制经济、人口和环境等因素的基础上,通过回归模型探究PDI与休闲设施供给的关系。研究发现:① 从时间来看,近年来全国和分地区的PDI都呈现明显的上升趋势;② 从空间来看,越发达地区的PDI通常越高,PDI在全国呈现“东-中-东北-西”递减特征,并且从沿海向内陆形成了高-高、低-高、高-低、低-低的集聚格局;③ 通过逐步回归发现PDI与夜间商业休闲设施(夜宵、酒吧、KTV)和公共休闲设施(公园)的供给水平显著相关,而与日间商业休闲设施(商场、影剧院)的关系不显著,其中,夜宵设施密度和PDI显著正相关,酒吧密度、KTV密度和人均公园数和PDI显著负相关。本文应用大数据初步揭示了居民心理健康水平和不同类型休闲设施供给的关系,为打造健康城市提供了新的研究视角。未来应完善城市休闲谱系,丰富休闲设施供给,以满足居民对高质量休闲的需求,促进居民心理健康。
高非凡 , 刘逸 , 李志刚 . 中国城市居民心理压力程度时空格局及与休闲设施供给的关系[J]. 地球信息科学学报, 2024 , 26(2) : 530 -541 . DOI: 10.12082/dqxxkx.2024.220165
With China entering the stage of high-quality development in an all-round way, high-level urban leisure supply becomes increasingly important. It is of great significance to systematically explore the relationship between urban leisure supply and residents' mental health to meet people's yearning for a better life. Therefore, this paper calculates the residents' Psychological Distress Index (PDI) from 2011 to 2019 based on Baidu index, applies spatial autocorrelation analysis to specify the spatial-temporal pattern of PDI, and uses stepwise regression analysis to further explore the relationship between PDI and leisure facilities with economic, population, and environmental factors controlled. The results show that: (1) In recent years, the PDI of the whole country and sub-regions has been rising continuously; (2) The more developed the region/city, the higher the PDI of residents. PDI presents a decreasing pattern of East-Central-Northeast-West. It also shows a significant spatial agglomeration, with high-high, low-high, high-low, and low-low agglomeration patterns from the coast to the inland; (3) PDI is significantly associated with the supply level of commercial leisure facilities at night (e.g., midnight snack, bar, and KTV), but not significantly associated with that in the daytime (e.g., shopping mall and cinema). The density of midnight snack, which reflects the degree of overtime work, is significantly positively associated with PDI. While as typical nightlife places, the densities of bars and KTV are significantly negatively associated with PDI. Besides, typical public leisure facilities (e.g., park) can effectively alleviate PDI. This study tentatively verifies the correlation between residents' PDI and different leisure facilities. Such effort offers a better understanding of urban health problem and how to cure it. It is important to improve the pedigree and enrich the supply of urban leisure facilities, so as to meet residents' demand for high-quality leisure life and promote their mental health.
表1 变量描述性统计结果Tab. 1 Descriptive statistics of variables |
| 变量类别 | 变量 | 数据来源 | 数据年份 | 平均值 | 标准差 | VIF |
|---|---|---|---|---|---|---|
| 心里压力 | 心理压力指数 | 百度指数(https://index.baidu.com/) | 2019 | 127.59 | 122.14 | - |
| 商业休闲设施 | 夜宵密度/(个/km2) | 美团网(https://www.meituan.com/) | 2020 | 72.54 | 51.10 | 1.985 |
| 商场密度/(个/km2) | 美团网(https://www.meituan.com/) | 2020 | 2.10 | 1.53 | 1.541 | |
| 酒吧密度/(个/km2) | 美团网(https://www.meituan.com/) | 2020 | 1.48 | 1.28 | 1.996 | |
| KTV密度/(个/km2) | 美团网(https://www.meituan.com/) | 2020 | 1.05 | 0.56 | 1.554 | |
| 影剧院密度/(个/km2) | 美团网(https://www.meituan.com/) | 2020 | 0.16 | 0.47 | 1.029 | |
| 公共休闲设施 | 人均公园数/(个/百万人) | 《中国城市建设统计年鉴-2019》[59] | 2019 | 11.60 | 17.17 | 1.393 |
| 人均公园绿地面积/m2 | 《中国城市建设统计年鉴-2019》[59] | 2019 | 14.99 | 4.43 | 1.168 | |
| 建成区绿地率/% | 《中国城市建设统计年鉴-2019》[59] | 2019 | 37.37 | 4.17 | 1.290 | |
| 经济压力 | 人均GDP/(元) | 《中国城市统计年鉴-2020》[60] | 2019 | 62 999.46 | 35 924.66 | 2.747 |
| 在岗职工平均工资/元 | 《中国城市统计年鉴-2020》[60] | 2019 | 78 261.12 | 17 281.43 | 2.629 | |
| 城镇登记失业率/% | 中经数据(https://ceidata.cei.cn/) | 2019 | 2.81 | 0.75 | 1.365 | |
| 二手房均价/(元/m2) | 安居客(https://www.anjuke.com/) | 2020 | 9 049.85 | 6 961.47 | 3.937 | |
| 人口压力 | 人口密度/(人/km2) | 红黑人口库(https://www.hongheiku.com/) | 2020 | 490.07 | 721.58 | 2.479 |
| 环境压力 | PM2.5年均浓度/(ug/m3) | 《中国城市统计年鉴-2020》[60] | 2019 | 37.79 | 12.73 | 1.446 |
表2 逐步回归拟合过程Tab. 2 Fitting process of the stepwise regression |
| 模型 | 输入的变量 | 剔除的变量 | R | R2 | 调整R2 | F | 显著性 |
|---|---|---|---|---|---|---|---|
| 模型1 | 二手房均价 | - | 0.748 | 0.560 | 0.558 | 374.158 | 0.000 |
| 模型2 | PM2.5年均浓度 | - | 0.784 | 0.615 | 0.612 | 233.710 | 0.000 |
| 模型3 | 人均GDP | - | 0.806 | 0.649 | 0.645 | 179.965 | 0.000 |
| 模型4 | 夜宵密度 | - | 0.812 | 0.659 | 0.654 | 140.387 | 0.000 |
| 模型5 | 人均公园数 | - | 0.817 | 0.668 | 0.663 | 116.834 | 0.000 |
| 模型6 | KTV密度 | - | 0.823 | 0.678 | 0.671 | 101.349 | 0.000 |
| 模型7 | 人口密度 | - | 0.827 | 0.684 | 0.677 | 89.149 | 0.000 |
| 模型8 | 在岗职工平均工资 | - | 0.830 | 0.689 | 0.681 | 79.576 | 0.000 |
| 模型9 | 酒吧密度 | - | 0.834 | 0.695 | 0.685 | 72.349 | 0.000 |
表3 多元回归模型拟合结果Tab. 3 Estimation results of multiple regression model |
| 输入量 | 未标准化系数 | 标准化系数 | t值 | 显著性 | VIF | |
|---|---|---|---|---|---|---|
| B | 标准误 | |||||
| 常量 | -122.251 | 32.910 | - | -3.715 | 0.000 | - |
| 夜宵密度 | 0.482 | 0.106 | 0.202 | 4.552 | 0.000 | 1.838 |
| 酒吧密度 | -9.700 | 4.251 | -0.101 | -2.282 | 0.023 | 1.854 |
| KTV密度 | -15.553 | 8.560 | -0.072 | -1.817 | 0.070 | 1.466 |
| 人均公园数 | -0.984 | 0.271 | -0.138 | -3.628 | 0.000 | 1.364 |
| 人均GDP | 0.001 | 0.000 | 0.179 | 3.520 | 0.001 | 2.420 |
| 在岗职工平均工资 | 0.001 | 0.000 | 0.146 | 2.759 | 0.006 | 2.621 |
| 二手房均价 | 0.007 | 0.001 | 0.382 | 6.005 | 0.000 | 3.791 |
| 人口密度 | 0.025 | 0.008 | 0.146 | 2.969 | 0.003 | 2.260 |
| PM2.5年均浓度 | 1.724 | 0.373 | 0.180 | 4.623 | 0.000 | 1.416 |
| [1] |
|
| [2] |
央视网. 《中国城镇居民心理健康白皮书》正式发布[EB/OL].(2018-04-30) [2022-08-13]. http://jiankang.cctv.com/2018/04/30/ARTIWf496N6d9O0lrIdJM4rG180430.shtml
[ CCTV. The White Paper on Mental Health of Chinese Urban Residents was officially released[EB/OL]. (2018-04-30) [2022-08-13]. http://jiankang.cctv.com/2018/04/30/ARTIWf496N6d9O0lrIdJM4rG180430.shtml
|
| [3] |
|
| [4] |
|
| [5] |
|
| [6] |
|
| [7] |
|
| [8] |
|
| [9] |
|
| [10] |
|
| [11] |
|
| [12] |
|
| [13] |
|
| [14] |
|
| [15] |
|
| [16] |
|
| [17] |
|
| [18] |
|
| [19] |
|
| [20] |
刘逸, 孟令坤, 曹轶涵, 等. 扩散性危机影响下公众心理韧性空间特征初探[J]. 地理科学, 2020, 40(11):1763-1773.
[
|
| [21] |
|
| [22] |
|
| [23] |
|
| [24] |
林江, 周少君, 魏万青. 城市房价、住房产权与主观幸福感[J]. 财贸经济, 2012(5):114-120.
[
|
| [25] |
孙三百, 黄薇, 洪俊杰, 等. 城市规模、幸福感与移民空间优化[J]. 经济研究, 2014, 49(1):97-111.
[
|
| [26] |
符婷婷, 张艳, 柴彦威. 大城市郊区居民通勤模式对健康的影响研究——以北京天通苑为例[J]. 地理科学进展, 2018, 37(4):547-555.
[
|
| [27] |
|
| [28] |
|
| [29] |
杨振之, 周坤. 也谈休闲城市与城市休闲[J]. 旅游学刊, 2008, 23(12):51-57.
[
|
| [30] |
|
| [31] |
|
| [32] |
|
| [33] |
陈筝, 翟雪倩, 叶诗韵, 等. 恢复性自然环境对城市居民心智健康影响的荟萃分析及规划启示[J]. 国际城市规划, 2016, 31(4):16-26,43.
[
|
| [34] |
周素红, 黄畅如, 张琳. 城市公园环境对个体恢复性感知的影响及设计启示:以青少年活动环境感知为例[J]. 风景园林, 2021, 28(5):16-22.
[
|
| [35] |
刘逸, 陈銮, 刘子惠, 等. 基于同位模式的休闲产业空间集聚特征研究[J]. 旅游学刊, 2022, 37(2):94-104.
[
|
| [36] |
|
| [37] |
王宁. 略论休闲经济[J]. 中山大学学报(社会科学版), 2000, 40(3):13-16.
[
|
| [38] |
|
| [39] |
|
| [40] |
林耿, 王炼军. 全球化背景下酒吧的地方性与空间性——以广州为例[J]. 地理科学, 2011, 31(7):794-801.
[
|
| [41] |
|
| [42] |
韩光明. 城市休闲娱乐空间与城市消费文化的对偶规律研究——以西安市消费群体选择KTV休闲场所为例[J]. 消费导刊, 2008(14):12-13.
[
|
| [43] |
杨晓俊, 朱凯凯, 陈朋艳, 等. 城市电影院空间分布特征及演变——以西安市为例[J]. 经济地理, 2018, 38(6):85-93.
[
|
| [44] |
|
| [45] |
|
| [46] |
|
| [47] |
华钢, 楼嘉军. 城市休闲系统研究[J]. 旅游论坛, 2009, 2(3):419-423.
[
|
| [48] |
中国互联网络信息中心. 2019年中国网民搜索引擎使用情况研究报告[R]. 2019.
[ China Internet Network Information Center. Research report on the usage of search engines of Chinese netizens in 2019[R]. 2019. ]
|
| [49] |
刘华山. 心理健康概念与标准的再认识[J]. 心理科学, 2001, 24(4):481-480.
[
|
| [50] |
|
| [51] |
|
| [52] |
|
| [53] |
|
| [54] |
游士兵, 严研. 逐步回归分析法及其应用[J]. 统计与决策, 2017(14):31-35.
[
|
| [55] |
魏小安, 李莹. 城市休闲与休闲城市[J]. 旅游学刊, 2007, 22(10):71-76.
[
|
| [56] |
柴彦威, 尚嫣然. 深圳居民夜间消费活动的时空特征[J]. 地理研究, 2005, 24(5):803-810.
[
|
| [57] |
韩会然, 宋金平. 芜湖市居民购物行为时空间特征研究[J]. 经济地理, 2013, 33(4):82-87,100.
[
|
| [58] |
赵雪雁, 王伟军, 万文玉. 中国居民健康水平的区域差异:2003-2013[J]. 地理学报, 2017, 72(4):685-698.
[
|
| [59] |
中华人民共和国住房和城乡建设部. 中国城市建设统计年鉴-2019[M]. 北京: 中国统计出版社, 2020.
[ Ministry of Housing and Urban-Rural Development of the People's Republic of China. China urban construction statistical yearbook: 2019[M]. Beijing: China Statistics Press, 2020. ]
|
| [60] |
国家统计局城市社会经济调查司. 中国城市统计年鉴-2020[M]. 北京: 中国统计出版社, 2021.
[ Department of Urban Social and Economic Surveys, National Bureau of Statistics. China city statistical yearbook: 2020[M]. Beijing: China Statistics Press, 2021. ]
|
| [61] |
国家统计局. 东西中部和东北地区划分方法[EB/OL].(2011-06-13) [2022-08-13]. http://www.stats.gov.cn/ztjc/zthd/sjtjr/dejtjkfr/tjkp/201106/t20110613_71947.htm
[ National Bureau of Statistics. Method of dividing east, west, central and northeast regions[EB/OL]. (2011-06-13) [2022-08-13]. http://www.stats.gov.cn/ztjc/zthd/sjtjr/dejtjkfr/tjkp/201106/t20110613_71947.htm
|
| [62] |
第一财经. 合肥、佛山晋升新一线城市! 2020最新1-5线城市排名发布(附完整名单)[EB/OL].(2020-05-29) [2022-08-13]. https://www.yicai.com/news/100648666.html
[ YICAI. Hefei and Foshan are promoted to new first-tier cities! 2020 latest ranking of 1-5 tier cities released (with complete list)[EB/OL]. (2020-05-29) [2022-08-13]. https://www.yicai.com/news/100648666.html
|
| [63] |
竟立中国. BLINK中国夜间经济[R]. 2019.
[ Mediacom. China after dark[R]. 2019. ]
|
| [64] |
美团研究院. 2020年上半年美团夜宵指数发展报告[R]. 2020.
[ Meituan Research Institute. Report on the development of Meituan supper index in the first half of 2020[R]. 2020. ]
|
/
| 〈 |
|
〉 |