
FY-4A地表温度产品质量评估与偏差订正方法研究
|
黄大鹏(1978—),男,安徽潜山人,副研究员,研究方向为卫星遥感应用及气候变化影响评估与风险评估。E-mail: dapenghuang@163.com |
收稿日期: 2023-08-18
修回日期: 2024-01-23
网络出版日期: 2024-05-21
基金资助
新一代人工智能国家科技重大专项(2022ZD0119500)
中国气象局风云卫星应用先行计划项目(23-512)
Research on FY-4A Land Surface Temperature Quality Assessment and Bias Correction Method
Received date: 2023-08-18
Revised date: 2024-01-23
Online published: 2024-05-21
Supported by
National Science and Technology Major Project(2022ZD0119500)
Fengyun Satellite Application Pilot Program of China Meteorological Administration(23-512)
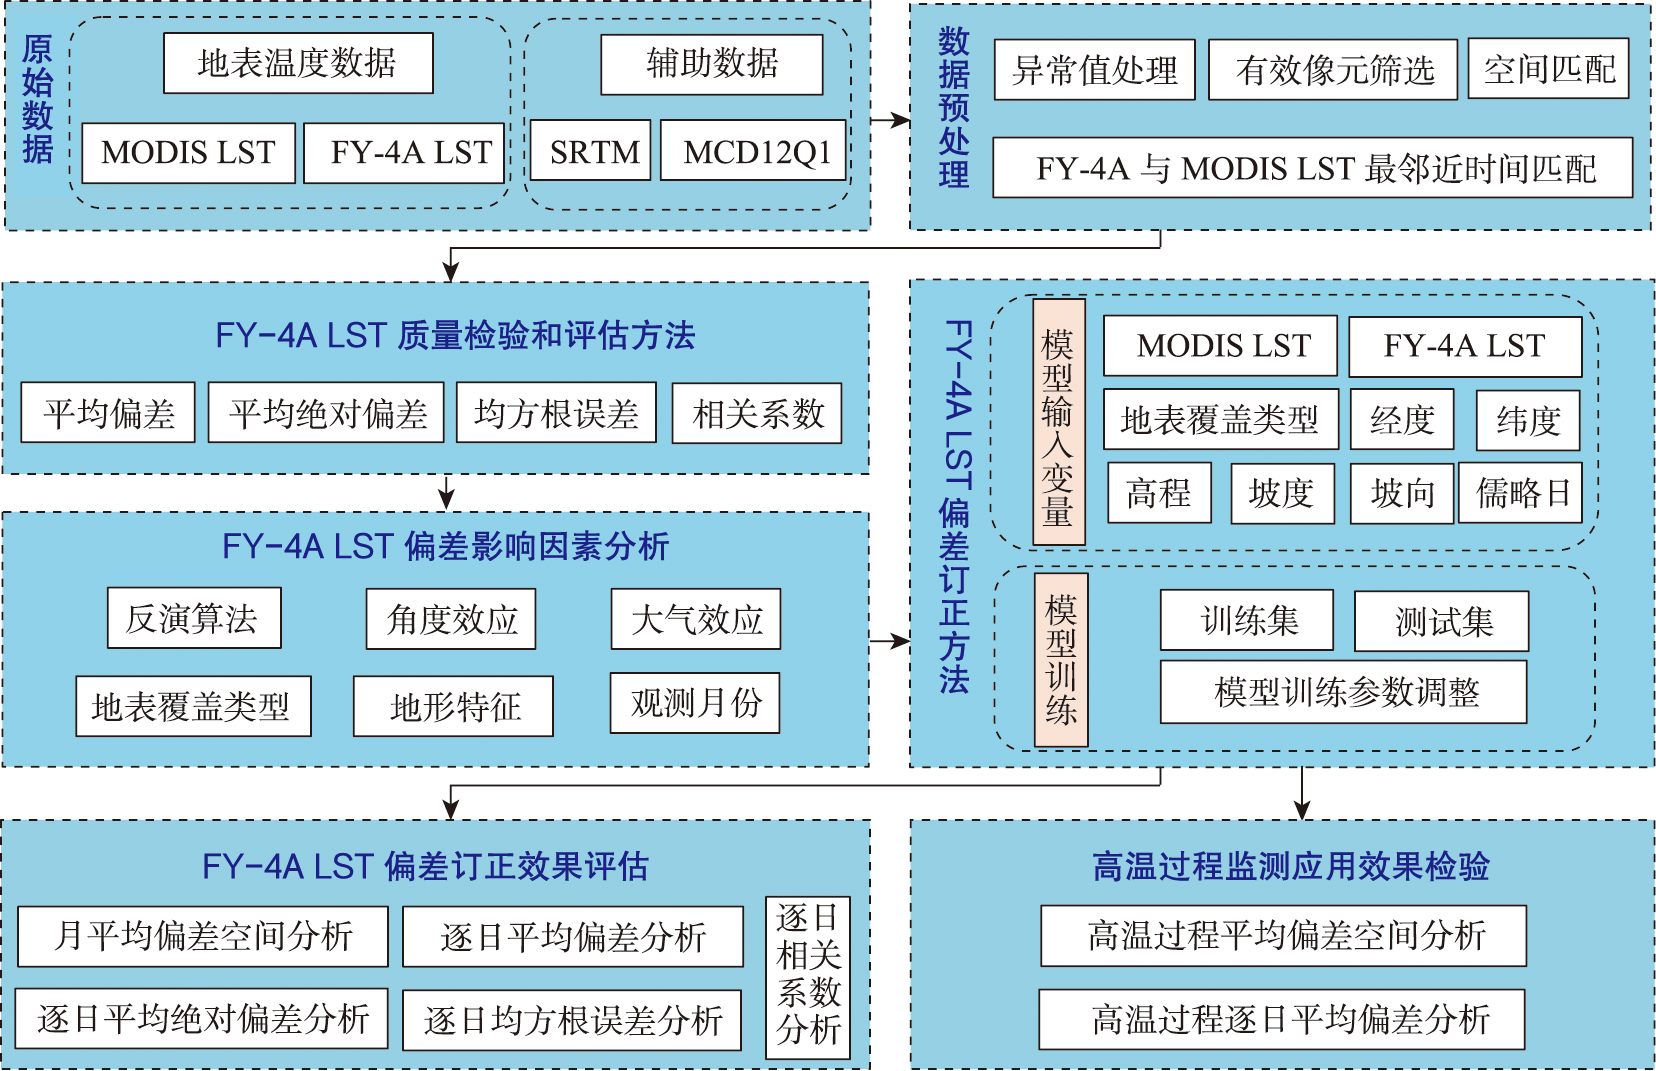
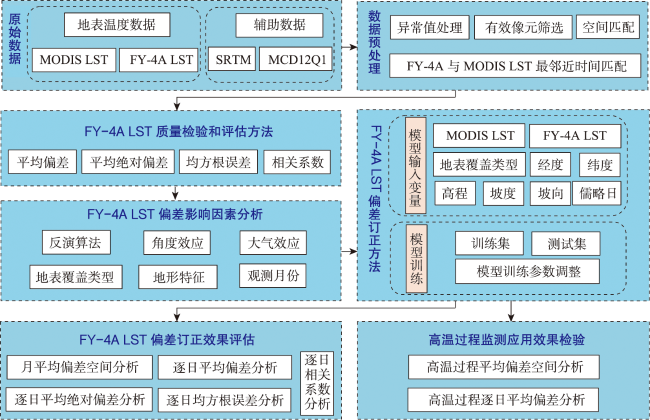
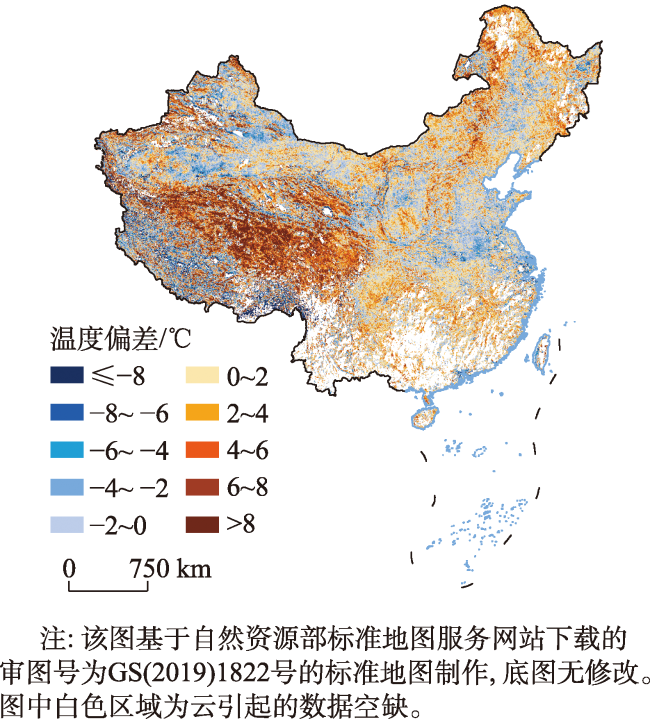
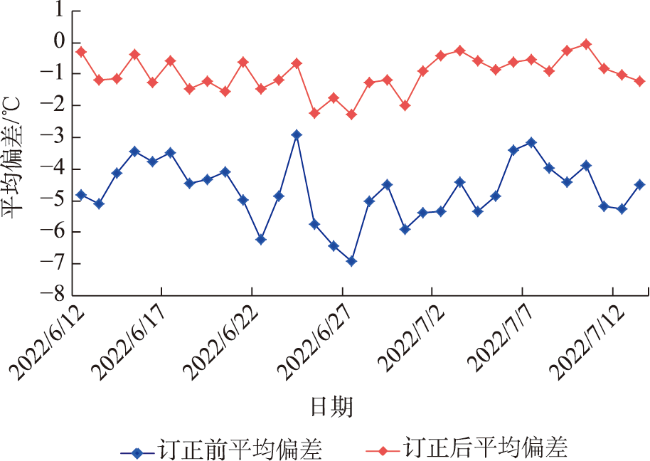
气候变化研究需要长时间序列、稳定的、均一化的地表温度(LST)气候数据集支持。气候变化实时监测对数据集的要求则更高,还需要LST气候数据集实时的更新和快速便捷的获取,而国际上公开的实时更新的LST气候数据集则较少。本研究以国外长时间序列MODIS LST历史数据集为参照,对我国易于获取的FY-4A LST实时数据进行质量评估,在此基础上研发随机森林偏差订正算法,将FY-4A LST数据实时订正到MODIS LST质量水平上,从而研发融合静止气象卫星FY-4A和极轨卫星AQUA/MODIS的 LST气候数据集。对偏差订正后的2022年1、4、7和10月共4个月产品检验评估的结果表明:从4个月份偏差的平均值来看,订正后的LST平均偏差由-1.98 ℃降低到-0.42 ℃,平均绝对偏差由4.02 ℃降到2.84 ℃,均方根误差由5.13 ℃降到3.91 ℃,相关系数由0.86提升到0.90。随机森林回归偏差订正算法能够有效减小FY-4A LST与MODIS LST的偏差,订正后的FY-4A LST数据在全国范围不同区域和不同时段与MODIS LST均具有较好的一致性。对中国区域高温过程监测评估发现:订正后的FY4A LST与MODIS LST在全国大部分地区平均偏差较小,仅在海拔较高和地形相对复杂的山区存在较大偏差;偏差订正后2类卫星逐日平均偏差减小到-1 ℃左右,平均偏差较订正前显著减小。因此本文研发的融合FY-4A和MODIS的LST气候数据集可以很好支撑我国的气候变化研究和气候业务服务工作。
黄大鹏 , 王艳姣 , 肖风劲 , 陈彦红 . FY-4A地表温度产品质量评估与偏差订正方法研究[J]. 地球信息科学学报, 2024 , 26(5) : 1243 -1256 . DOI: 10.12082/dqxxkx.2024.230484
Climate change research requires the support of long time series, stable, and uniform Land Surface Temperature (LST) climate datasets. Real-time monitoring of climate change has requirements on datasets, such as requiring LST climate datasets to be updated in real-time and accessible conveniently. However, there are still limited publicly available LST climate datasets with real-time updates internationally. Scholars have conducted extensive research on the development of long time series LST datasets and achieved a series of innovative results. However, most of the existing LST datasets utilize polar orbit satellite data or geostationary meteorological satellite data, and there are few LST datasets that integrate geostationary meteorological satellites and polar orbit satellites. This study evaluated the quality of the real-time FY-4A LST data available in China using the long term MODIS LST historical dataset as a reference. A random forest bias correction algorithm was developed, and the FY-4A LST data were corrected to the quality level of MODIS LST, so as to develop a real-time bias-corrected LST climate dataset integrating FY-4A geostationary meteorological satellite and polar orbit satellite AQUA/MODIS. The evaluation results of the bias-corrected FY-4A LST in January, April, July, and October 2022 showed that the mean bias between the FY-4A LST and MODIS LST decreased from -1.98 ℃ to -0.42 ℃, the mean absolute bias decreased from 4.02 ℃ to 2.84 ℃, the root mean square error decreased from 5.13 ℃ to 3.91 ℃, and the correlation coefficient increased from 0.86 to 0.90 after bias correction. This random forest bias correction algorithm can effectively reduce the bias between FY-4A LST and MODIS LST. The corrected FY-4A LST data exhibited good consistency with MODIS LST in different regions of China and over different time periods. The monitoring and evaluation results of high temperature process in China showed that the mean bias of corrected FY-4A LST and MODIS LST was relatively small in most regions of the country, and there was a significant bias only in mountainous areas with higher elevations and relatively complex terrain. After the bias correction, the daily mean bias between corrected FY-4A LST and MODIS LST decreased to around -1 ℃, and the mean bias decreased significantly compared to that before the correction. Therefore, the LST climate dataset developed in the study by integrating FY-4A LST and MODIS LST can effectively support China's climate change research and provide better data quality for climate service.
表1 不同月份和全年中国FY-4A和MODIS平均地表温度和偏差统计Tab.1 Mean LST and mean bias between FY-4A LST and MODIS LST in different months and all year over China during 2018—2022 (℃) |
| 1月 | 4月 | 7月 | 10月 | 年平均 | |
|---|---|---|---|---|---|
| FY-4A LST | 7.2 | 26.2 | 32.4 | 20.9 | 21.7 |
| MODIS LST | 6.2 | 27.2 | 35.5 | 21.2 | 22.6 |
| LST平均偏差(FY4A-MODIS) | 1.0 | -1.0 | -3.1 | -0.3 | -0.9 |
表2 各月FY-4A LST和MODIS LST训练集和测试集拟合优度(R2)和均方根误差(RMSE)Tab. 2 The goodness of fit and RMSE of the training and testing sample sets for FY-4A LST and MODIS LST from January to December |
| 指标 | 数据集 | 月份 | |||||||||||
|---|---|---|---|---|---|---|---|---|---|---|---|---|---|
| 1 | 2 | 3 | 4 | 5 | 6 | 7 | 8 | 9 | 10 | 11 | 12 | ||
| R2 | 训练集 | 0.93 | 0.93 | 0.91 | 0.90 | 0.88 | 0.89 | 0.92 | 0.93 | 0.91 | 0.89 | 0.93 | 0.92 |
| 测试集 | 0.87 | 0.89 | 0.86 | 0.84 | 0.82 | 0.83 | 0.87 | 0.89 | 0.87 | 0.85 | 0.88 | 0.87 | |
| RMSE /℃ | 训练集 | 3.82 | 4.36 | 4.58 | 4.94 | 5.84 | 6.18 | 6.72 | 6.50 | 4.98 | 4.22 | 3.81 | 3.72 |
| 测试集 | 3.81 | 4.26 | 4.63 | 4.82 | 5.96 | 6.18 | 6.71 | 6.45 | 4.98 | 4.18 | 3.86 | 3.78 | |
表3 1—12月FY-4A-LST偏差订正模型各输入要素的贡献值Tab. 3 Contribution values of each input element in the bias correction model for FY-4A LST from January to December |
| 月份 | FY4A-LST | 地表覆盖类型 | 高程 | 坡度 | 坡向 | 经度 | 纬度 | 儒略日 |
|---|---|---|---|---|---|---|---|---|
| 1 | 0.849 | 0.017 | 0.023 | 0.043 | 0.013 | 0.018 | 0.026 | 0.011 |
| 2 | 0.871 | 0.033 | 0.019 | 0.030 | 0.019 | 0.011 | 0.019 | 0.011 |
| 3 | 0.844 | 0.055 | 0.019 | 0.032 | 0.007 | 0.013 | 0.023 | 0.007 |
| 4 | 0.809 | 0.044 | 0.033 | 0.030 | 0.016 | 0.027 | 0.026 | 0.015 |
| 5 | 0.839 | 0.049 | 0.027 | 0.025 | 0.008 | 0.026 | 0.018 | 0.009 |
| 6 | 0.870 | 0.033 | 0.024 | 0.021 | 0.010 | 0.016 | 0.018 | 0.007 |
| 7 | 0.888 | 0.041 | 0.022 | 0.012 | 0.006 | 0.015 | 0.012 | 0.006 |
| 8 | 0.880 | 0.046 | 0.025 | 0.016 | 0.005 | 0.014 | 0.010 | 0.005 |
| 9 | 0.884 | 0.040 | 0.015 | 0.025 | 0.005 | 0.011 | 0.013 | 0.006 |
| 10 | 0.824 | 0.063 | 0.022 | 0.038 | 0.005 | 0.018 | 0.022 | 0.008 |
| 11 | 0.883 | 0.033 | 0.016 | 0.033 | 0.004 | 0.010 | 0.017 | 0.003 |
| 12 | 0.883 | 0.022 | 0.016 | 0.042 | 0.006 | 0.009 | 0.017 | 0.006 |
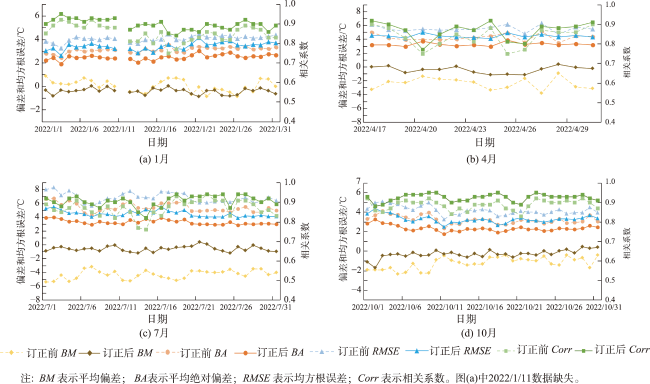
图6 2022年各月偏差订正前后FY-4A LST与MODIS LST平均偏差、平均绝对偏差、均方根误差和相关系数逐日变化曲线Fig. 6 The daily variation curves of the mean bias, mean absolute bias, root mean square error, and correlation coefficient of FY-4A LST and MODIS LST before and after monthly bias correction in 2022 |
表4 不同月份中国地表温度偏差订正结果统计Tab. 4 Statistics of bias correction results for land surface temperature in different months over China |
| 时间 | 平均偏差/℃ | 平均绝对偏差/℃ | 均方根误差/℃ | 相关系数 | ||||
|---|---|---|---|---|---|---|---|---|
| 订正前 | 订正后 | 订正前 | 订正后 | 订正前 | 订正后 | 订正前 | 订正后 | |
| 202201 | 0.05 | -0.39 | 3.02 | 2.42 | 3.93 | 3.32 | 0.82 | 0.87 |
| 202204 | -2.42 | -0.43 | 4.29 | 3.28 | 5.54 | 4.48 | 0.84 | 0.87 |
| 202207 | -4.32 | -0.57 | 5.44 | 3.28 | 6.85 | 4.52 | 0.87 | 0.91 |
| 202210 | -1.23 | -0.29 | 3.22 | 2.35 | 4.20 | 3.31 | 0.89 | 0.93 |
| 均值 | -1.98 | -0.42 | 4.02 | 2.84 | 5.13 | 3.91 | 0.86 | 0.90 |
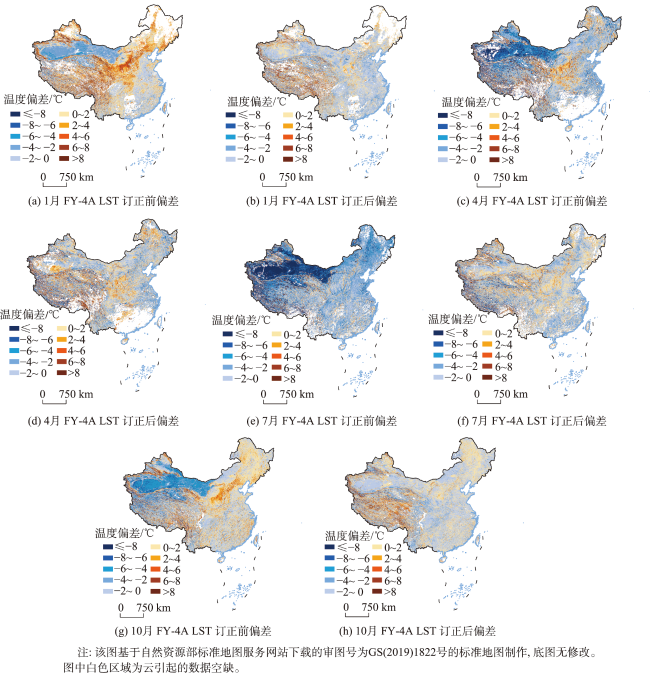
图8 偏差订正后中国FY-4A LST与MODIS LST平均偏差空间分布Fig. 8 Spatial distribution of mean bias between corrected FY-4A LST and MODIS LST during the high temperature process in China |
| [1] |
|
| [2] |
程元良, 吴骅, 李召良, 等. FY-3D MERSI-Ⅱ地表温度遥感反演与验证[J]. 遥感学报, 2021, 25(8):1792-1807.
[
|
| [3] |
|
| [4] |
|
| [5] |
邓雅文, 凌子燕, 孙娜, 等. 基于广义回归神经网络的京津冀地区土壤湿度遥感逐日估算研究[J]. 地球信息科学学报, 2021, 23(4):749-761.
[
|
| [6] |
|
| [7] |
|
| [8] |
刘宇翔, 杨英宝, 胡佳, 等. 基于长时序MODIS数据的中国城市昼夜热岛强度时空特征[J]. 地球信息科学学报, 2022, 24(5):981-995.
[
|
| [9] |
|
| [10] |
|
| [11] |
|
| [12] |
|
| [13] |
|
| [14] |
|
| [15] |
|
| [16] |
|
| [17] |
|
| [18] |
|
| [19] |
|
| [20] |
|
| [21] |
|
| [22] |
|
| [23] |
|
| [24] |
|
| [25] |
|
| [26] |
|
| [27] |
|
| [28] |
|
| [29] |
|
| [30] |
|
| [31] |
|
| [32] |
|
| [33] |
|
| [34] |
|
| [35] |
|
| [36] |
|
| [37] |
|
| [38] |
|
| [39] |
|
| [40] |
|
| [41] |
|
| [42] |
|
| [43] |
|
| [44] |
|
| [45] |
|
| [46] |
|
| [47] |
|
| [48] |
|
| [49] |
李娅丽, 汪小钦, 陈芸芝, 等. 福建省地表温度与植被覆盖度的相关性分析[J]. 地球信息科学学报, 2019, 21(3):445-454.
[
|
| [50] |
|
| [51] |
|
/
| 〈 |
|
〉 |