
满足多维功能需求的通用机场区域布局研究
|
姜 雨(1975—),女,山东烟台人,博士,副教授,研究方向为通用航空网络设计与优化。E-mail: jiangyu07@nuaa.edu.cn |
收稿日期: 2023-09-12
修回日期: 2023-11-29
网络出版日期: 2024-05-21
基金资助
国家自然科学基金项目(52372298)
Research on the Regional Layout Planning of General Airports for Multi-dimensional Functional Demand
Received date: 2023-09-12
Revised date: 2023-11-29
Online published: 2024-05-21
Supported by
National Natural Science Foundation of China(52372298)
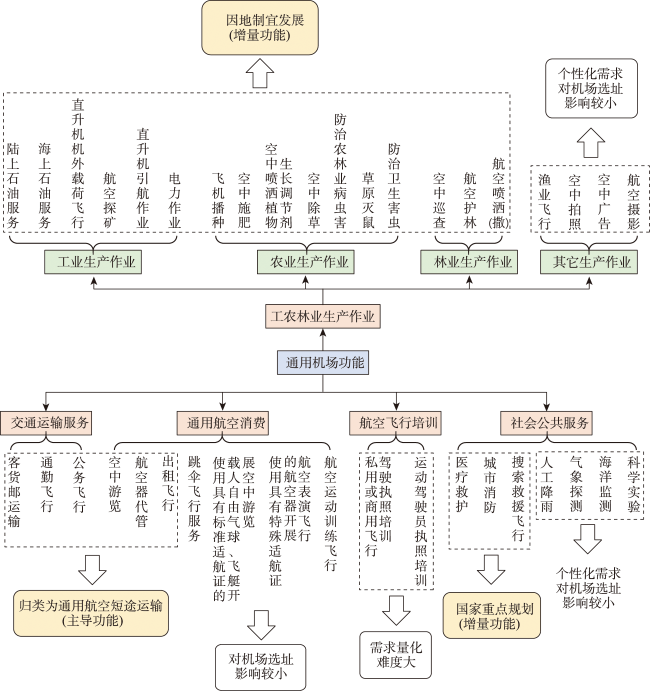
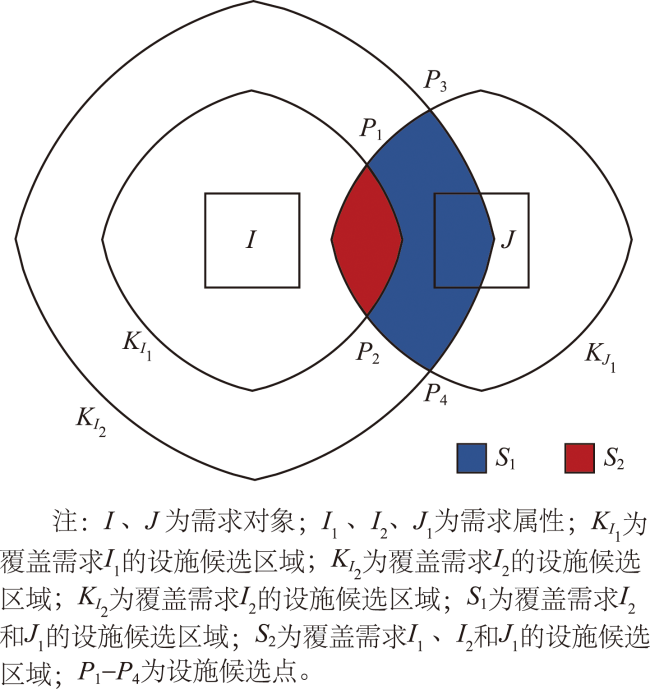
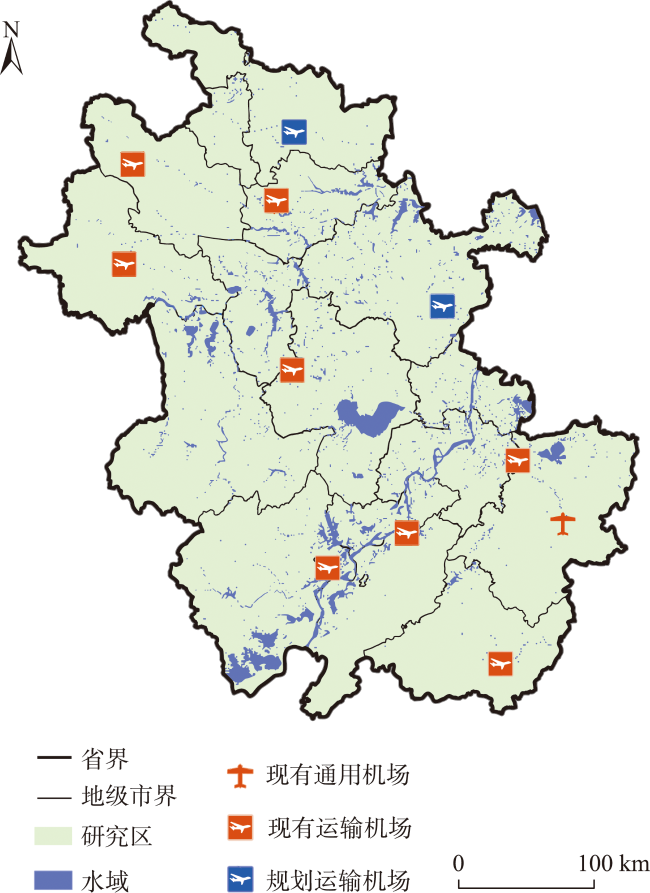
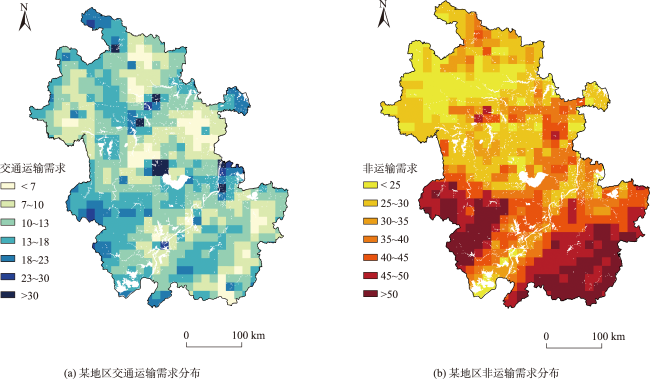
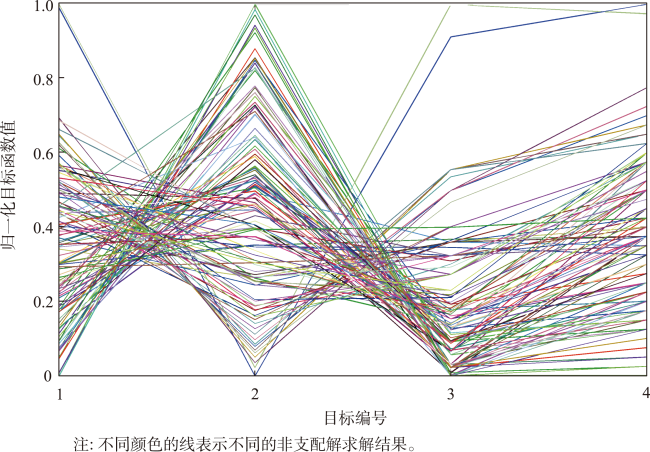
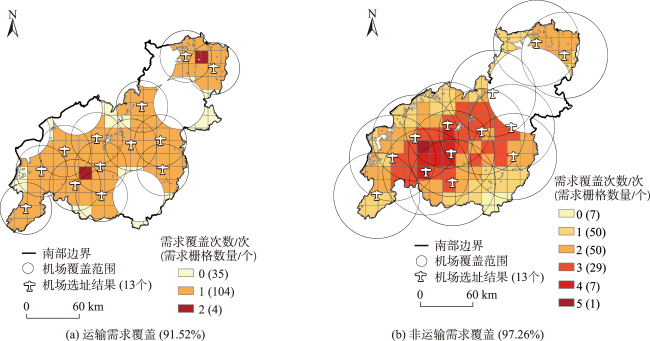
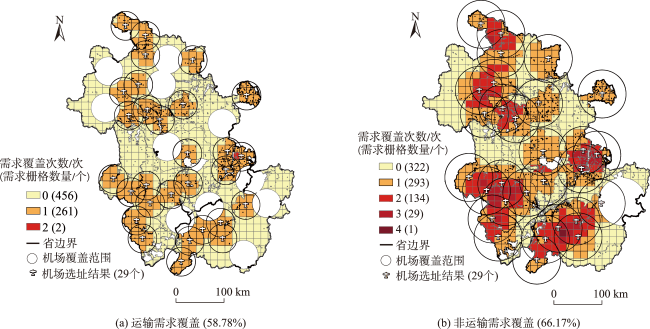
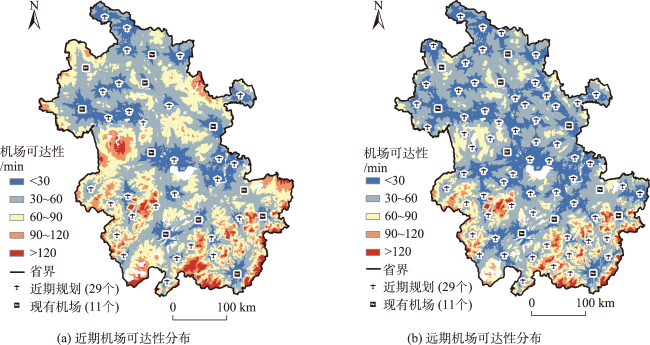
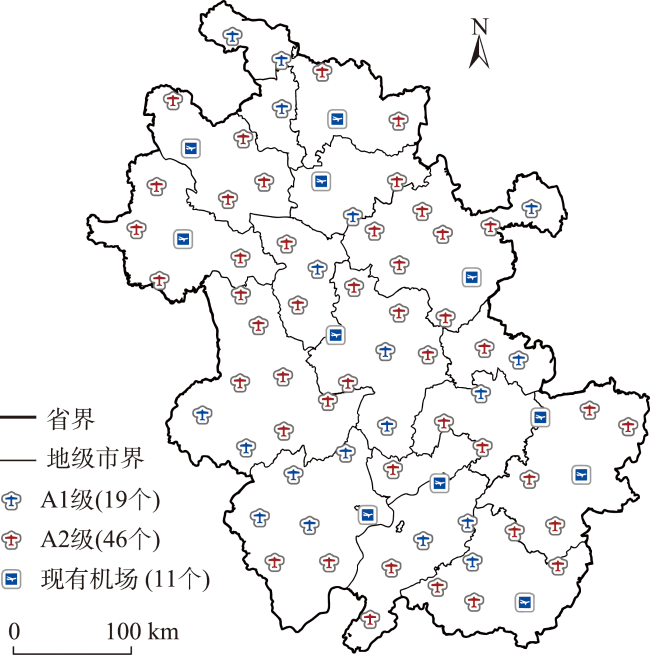
目前通用机场建设是我国通航产业发展的重点,合理的通用机场布局是后续通航产业发展的基础,因此本文构建多维需求分析-布局选址-功能定位研究框架,为区域通用机场布局规划提供科学性方法。本文首先构建通用机场运输需求及非运输需求影响指标体系,采用组合赋权法获得通用机场区域运输需求及非运输需求分布;其次改进多边形支配点集法为通用机场多维功能需求最大覆盖问题提供候选设施区位,以最大化多维功能需求覆盖和改善机场可达性为目标构建通用机场布局规划模型,设计NSGA-Ⅲ算法进行求解;最后提出基于k-means聚类的通用机场功能定位方法,实现通用机场差异化功能定位。以某地区为实例,实验结果显示,在近期规划中当通用机场数量增加29个,区域运输需求覆盖率达58.78%,非运输需求覆盖率达66.17%;在远期规划中,当通用机场数量增加64个,运输需求覆盖率达89.20%,非运输需求覆盖率达97.57%,基本覆盖通用机场多维功能需求。在近期和远期规划中,该地区通用机场1 h通勤区域占比由目前28.73%分别提升至60.63%和78.35%。本文根据远期布局方案确定通用机场等级及功能,使得机场功能定位与多维功能需求分布相适应,为通用机场的规划和建设提供理论依据。

姜雨 , 刘猛猛 , 李智超 , 薛清文 , 戴垚宇 . 满足多维功能需求的通用机场区域布局研究[J]. 地球信息科学学报, 2024 , 26(5) : 1296 -1314 . DOI: 10.12082/dqxxkx.2024.230549
With the development of the low-altitude economy, many provinces have released general airport layout plans, and the construction of general airports has reached its climax. Reasonable layout and functional positioning of general airports are the foundation for the development of the general aviation industry. However, there is still a lack of methods for generating scientific and reasonable airport layout. Therefore, it is urgently necessary to develop a scientific method for layout planning and functional positioning of general airports. Moreover, the existing research has not fully considered the spatial diversity of multi-dimensional demand of general airports, resulting in a one-sided general airport layout plan which is decoupled from functional positioning. To address these problems, this paper aims to construct a research framework for multi-dimensional demand analysis, layout planning, and functional positioning, and generate layout planning of general airports based on multi-dimensional functional demand. First, the demand for transportation and non-transportation functions of general airports is a systematically analyzed. Combining with real data, the impact index system for transportation and non-transportation demand is constructed based on an econometric model and characteristics of non-transportation functions. Then, a combined weighting method is used to overlay the impact indicators to obtain the distribution of regional transportation and non-transportation demand. Second, the improved Polygon Intersection Point Set method is employed to discretize the continuous facility sitting problem based on multi-dimensional functional demand coverage assumptions. After that, the multi-dimensional functional demand-oriented general airport layout planning models are constructed. The NSGA-III algorithm is designed to solve the multi-objective model. Finally, the k-means clustering-based general airport functional positioning model is proposed. An example region is selected to carry out general airport layout planning. The results show that in the near-term planning, when the number of general aviation airports increases by 29, the regional transportation demand coverage reaches 58.78% and the non-transportation demand coverage reaches 66.17%. In the long-term planning, when the number of general aviation airports increases by 64, the transportation demand coverage reaches 89.20% and the non-transportation demand coverage reaches 97.57%, which basically achieves a complete coverage of the multi-dimensional functional demand in the region. The 1h commuting area share of general aviation in the region is increased from the current 28.73% to 60.63% and 78.35% in the near-term and long-term planning, respectively. Finally, the grade and function of general aviation airports are determined based on a long-term layout scheme, which ensures the compatibility between functional positioning and the multi-dimensional functional demand distribution, providing a theoretical basis for the planning and construction of general aviation airports.
表1 速度赋值Tab.1 Speed assignment |
| 分类 | 分级/土地类型 | 速度/(km/h) |
|---|---|---|
| 公路 | 高速公路 | 120 |
| 一级公路 | 100 | |
| 二级公路 | 80 | |
| 三级公路 | 40 | |
| 四级等外公路 | 30 | |
| 铁路 | 高速铁路 | 200 |
| 普速铁路 | 120 | |
| 土地利用 | 城市、村庄 | 30 |
| 草地、未利用土地 | 20 | |
| 耕地 | 15 | |
| 林地 | 5 | |
| 水域 | 0 |
表2 速度修正判断矩阵Tab. 2 Judgment matrix of speed adjustment |
| 起伏度 ( 邻域) | 坡度/( ) | ||
|---|---|---|---|
| 15~25 | |||
| <100 m | 1.00 | 0.90 | 0.85 |
| 100~200 m | 0.90 | 0.85 | 0.80 |
| >200 m | 0.85 | 0.80 | 0.70 |
表3 Logistic回归结果Tab. 3 Logistic regression results |
| 解释变量 | 回归系数 | 标准误差 | 瓦尔德 | 自由度 | 显著性 |
|---|---|---|---|---|---|
| 人口密度 | 0.005 | 0.001 | 1.234 | 1 | 0.235 |
| 人均GDP | 0.000 | 0.000 | 0.243 | 1 | 0.563 |
| 交通可达性 | 0.036 | 0.035 | 5.724 | 1 | 0.025 |
| 旅游指数 | -0.124 | 0.211 | 3.441 | 1 | 0.195 |
| 第二产业占比 | 0.055 | 0.013 | 2.890 | 1 | 0.068 |
| 第三产业占比 | 0.056 | 0.053 | 1.774 | 1 | 0.196 |
| 常数项 | -2.240 | 1.524 | 3.251 | 1 | 0.201 |
表4 多元线性回归结果Tab. 4 Multiple linear regression results |
| 解释变量 | 原始回归系数 | 标准误差 | 标准化回归系数 | t | 显著性 | VIF |
|---|---|---|---|---|---|---|
| 人口密度 | 451.210 | 155.544 | 0.329 | 2.743 | 0.002 | 1.657 |
| 人均GDP | 3.156 | 1.064 | 0.340 | 2.292 | 0.031 | 1.965 |
| 交通可达性 | 935.440 | 591.154 | 0.157 | 1.310 | 0.253 | 2.016 |
| 旅游收入 | 216.220 | 66.451 | 0.257 | 2.075 | 0.039 | 1.347 |
| 第二产业比重 | 37.549 | 4 121.112 | 0.002 | 0.009 | 0.998 | 2.968 |
| 第三产业比重 | -2 043.465 | 3 994.112 | -0.062 | -0.395 | 0.723 | 2.213 |
| 常数项 | 186 434.127 | 321 124.244 | - | 0.545 | 0.697 | - |
表5 交通运输和非运输需求相关指标及数据来源Tab. 5 Indicators and data sources related to transportation and non-transportation demand |
| 需求指标 | 数据类型 | 时间/年 | 来源 |
|---|---|---|---|
| 交通运输需求相关指标 | 人均GDP空间分布数据 | 2019 | 中国科学院资源环境科学与数据中心 (https://www.resdc.cn/DOI/doi.aspx?DOIid=32) |
| 1 km土地利用遥感数据 | 2020 | 中国科学院资源环境科学与数据中心 (https://www.resdc.cn/DOI/DOI.aspx?DOIID=54) | |
| 地形高程空间分布数据 | 2020 | 中国科学院资源环境科学与数据中心 (https://www.resdc.cn/data.aspx?DATAID=337) | |
| 人口网格数据 | 2020 | GPWv4修订版[28] | |
| 交通网络数据 | 2020 | 全国地理信息资源目录服务系统 (https://www.webmap.cn/main.do?method=index) | |
| 旅游收入数据 | 2020 | 该地区各县级单位统计公报 (http://tjj.ah.gov.cn/ssah/qwfbjd/tjgb/sjtjgbao/index.html) | |
| 省级以上旅游景区数 | 2022 | 该地区风景名胜区名录 (https://lyj.ah.gov.cn/ahlq/zrbhq/40542321.html) | |
| 非运输需求相关指标 | 耕地覆盖率、森林覆盖率、洪涝易损性数据 | 2020 | 该地区规划部门1 km 土地利用数据处理得到 |
| 农业、林业产值 | 2020 | 该地区各县级单位统计公报(http://tjj.ah.gov.cn/ssah/qwfbjd/tjgb/sjtjgbao/index.html) | |
| 林分组成、森林易燃风险等级数据 | 2020 | GLC_FCS30全球30 m精细地表覆盖数据处理得到(https://data.casearth.cn/thematic/glc_fcs30/88) | |
| 地质灾害风险等级数据 | 2020 | 该地区地质环境检测总站绘制的地质灾害易发程度分区图加工得到(https://www.ahdzhj.com/) | |
| 汛期降水量数据 | 2020 | 国家地球系统科学数据中心(https://www.geodata.cn/) |
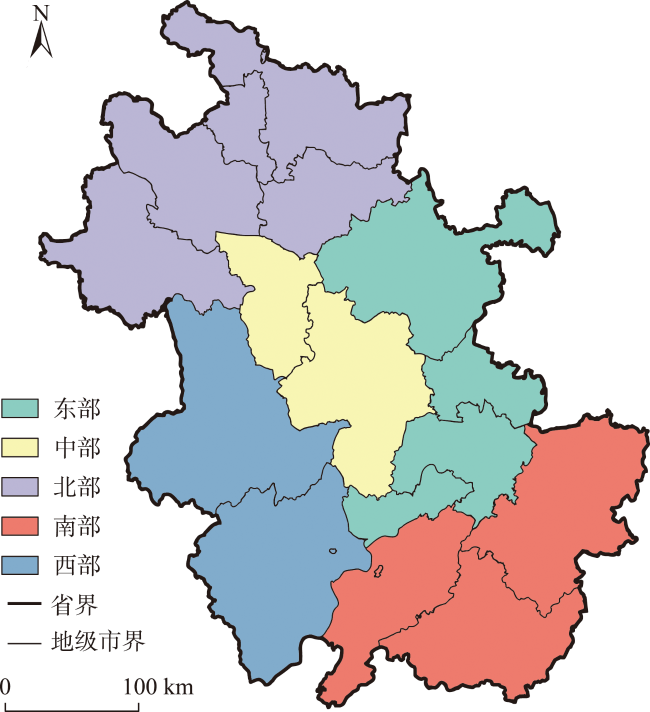
表6 5个算例需求对象及PIPS点统计Tab. 6 Five cases of demand objects and PIPS point statistics (个) |
| 算例 | 需求对象 | 运输需求对象 | 非运输需求对象 | 初始候选点数 | PIPS点数 |
|---|---|---|---|---|---|
| 中部地区 | 102 | 96 | 102 | 5 871 | 416 |
| 东部地区 | 160 | 141 | 160 | 9 582 | 726 |
| 北部地区 | 212 | 186 | 212 | 10 124 | 790 |
| 西部地区 | 161 | 153 | 161 | 16 261 | 1 124 |
| 南部地区 | 171 | 143 | 144 | 9 428 | 695 |
表7 交通运输需求指标统计Tab. 7 Transportation demand indicators statistics |
| 需求对象编号 | 人口密度/(人/km2) | 人均GDP/元 | 旅游收入/万元 | 机场可达性/min |
|---|---|---|---|---|
| 1 | 166.51 | 1 268.58 | 169.34 | 138.59 |
| 2 | 433.81 | 2 163.77 | 296.55 | 71.02 |
| 3 | 480.37 | 3 001.51 | 350.40 | 59.41 |
| … | … | … | … | … |
| 708 | 736.82 | 1 956.35 | 115.82 | 78.74 |
表8 非运输需求指标统计Tab.8 Statistics of non-transport demand indicators |
| 需求对象编号 | 耕地覆盖率 /% | 农业产值 /万元 | 森林覆盖率 /% | 林业产值 /万元 | 林分组成 /种 | 森林易燃风险等级 | 地质风险 等级 | 降水量 /mm | 洪涝易损性 |
|---|---|---|---|---|---|---|---|---|---|
| 1 | 10.71 | 133.779 5 | 88.84 | 26.166 8 | 3 | 1.31 | 5.00 | 3 810.55 | 1.11 |
| 2 | 83.26 | 159.823 0 | 2.26 | 31.781 3 | 3 | 1.00 | 3.00 | 3 396.62 | 1.90 |
| … | … | … | … | … | … | … | … | … | … |
| 708 | 83.11 | 414.565 0 | 0.00 | 48.589 5 | 0 | 0.00 | 1.00 | 3 465.14 | 2.17 |
表9 交通运输需求影响指标权重Tab. 9 Weighting of impact indicators for transport demand |
| 评价指标 | 层次分析法权重 | 熵值法权重 | 组合权重 |
|---|---|---|---|
| 人口密度 | 0.477 8 | 0.232 2 | 0.379 5 |
| 人均GDP | 0.071 4 | 0.384 3 | 0.196 5 |
| 旅游收入 | 0.113 0 | 0.302 5 | 0.188 8 |
| 交通可达性 | 0.337 8 | 0.081 0 | 0.235 1 |
表10 非运输需求影响指标权重Tab. 10 Weighting of impact indicators for non-transport demand |
| 评价指标 | 层次分析法权重 | 熵值法权重 | 组合权重 |
|---|---|---|---|
| 耕地覆盖率 | 0.166 7 | 0.013 0 | 0.136 0 |
| 农业产值 | 0.083 3 | 0.411 3 | 0.148 9 |
| 森林覆盖率 | 0.148 4 | 0.053 3 | 0.129 4 |
| 林业产值 | 0.062 3 | 0.411 3 | 0.132 1 |
| 林分组成 | 0.039 3 | 0.015 8 | 0.034 6 |
| 森林易燃风险等级 | 0.166 7 | 0.060 3 | 0.145 4 |
| 地质灾害风险等级 | 0.166 7 | 0.018 2 | 0.137 0 |
| 汛期降水量 | 0.111 1 | 0.005 7 | 0.090 0 |
| 洪涝易损性 | 0.055 6 | 0.011 1 | 0.046 7 |
表12 某地区通用机场布局方案汇总Tab. 12 Summary of the layout of general-purpose airports in the region |
| 区域 | 通用机场数p/个 | ( )/% | /min | ( )/% | |
|---|---|---|---|---|---|
| 北部地区 | 15 | 85.61 | 19.88 | 96.00 | 0 |
| 中部地区 | 9 | 93.00 | 22.00 | 100.00 | 2 |
| 东部地区 | 13 | 91.12 | 25.26 | 98.84 | 2 |
| 西部地区 | 14 | 83.05 | 36.93 | 97.25 | 1 |
| 南部地区 | 13 | 91.52 | 41.77 | 97.26 | 4 |
| 某地区 | 64 | 89.20 | 29.52 | 97.57 | 9 |
表13 某地区不同阶段机场可达性对比Tab. 13 Comparison of airport accessibility at different stages in the region |
| 机场可达性统计 | 现有机场 | 近期规划 | 远期规划 |
|---|---|---|---|
| 全省均值/min | 84.19 | 56.26 | 44.44 |
| 0.5 h通达范围占比/% | 5.53 | 17.78 | 31.61 |
| 1 h通达范围占比/% | 28.73 | 60.63 | 78.35 |
| 2 h通达范围占比/% | 83.15 | 96.97 | 98.57 |
表14 通用机场多维功能需求覆盖案例Tab. 14 Case of multidimensional functional demand coverage for general airports |
| 地区 | 编号 | 短途运输 | 通航旅游 | 农业生产 | 林业生产 | 应急救援 |
|---|---|---|---|---|---|---|
| 北部 | 1 | 113.01 | 5.16 | 1 409.96 | 326.16 | 324.87 |
| 北部 | 2 | 145.72 | 78.84 | 1 340.50 | 205.03 | 227.85 |
| 北部 | 3 | 227.60 | 17.70 | 2 375.27 | 185.79 | 563.84 |
| … | … | … | … | … | … | … |
| 西部 | 16 | 257.02 | 156.50 | 358.43 | 1 177.00 | 1 211.98 |
| 西部 | 17 | 215.16 | 12.51 | 970.02 | 254.92 | 473.72 |
| … | … | … | … | … | … | … |
| 东部 | 64 | 186.51 | 50.71 | 985.52 | 402.35 | 734.64 |
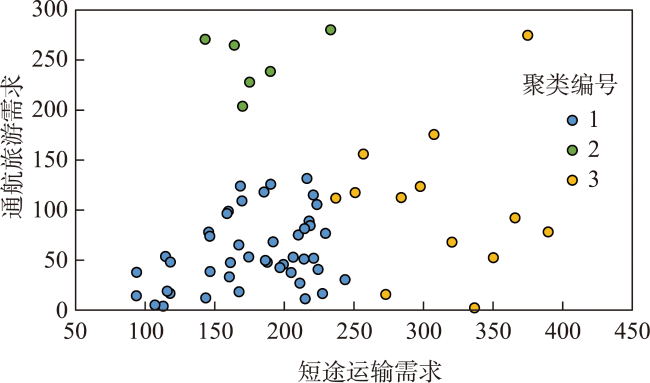
表16 功能定位聚类中心及优先级排序Tab. 16 Functional orientation clustering centers and priority ranking |
| 聚类编号 | 1 | 2 | 3 | 4 | 5 |
|---|---|---|---|---|---|
| 短途运输 | 178 | 209 | 201 | 197 | 238 |
| 通航旅游 | 121 | 62 | 63 | 80 | 138 |
| 农业生产 | 937 | 333 | 1 634 | 922 | 314 |
| 林业生产 | 778 | 672 | 268 | 307 | 1 152 |
| 应急救援 | 1 026 | 700 | 436 | 560 | 1 176 |
| 机场数量 | 4 | 8 | 13 | 28 | 11 |
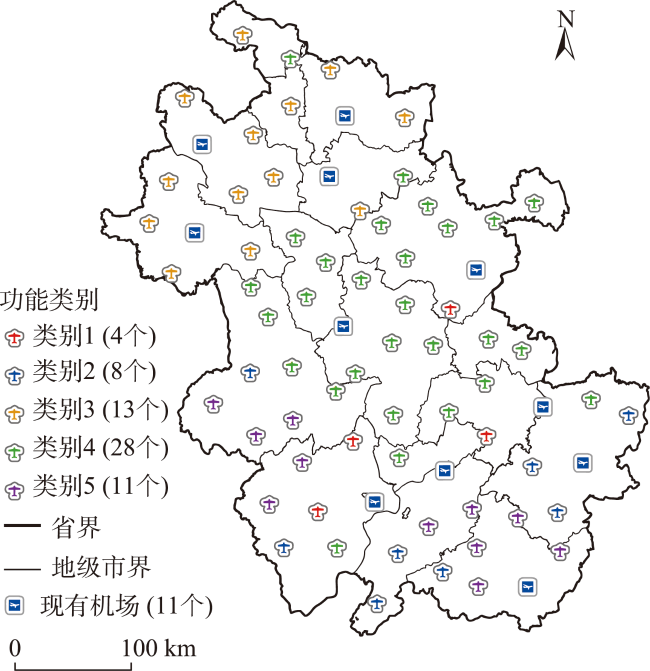
表17 通用机场功能定位分类Tab. 17 Classification of functional positioning of general aviation airports |
| 通用机场 分类 | 主导功能 | 增量功能 |
|---|---|---|
| 1 | 通航旅游 | 农业生产、林业生产、应急救援 |
| 2 | 短途运输 | 应急救援 |
| 3 | 农业生产 | 短途运输、林业生产 |
| 4 | 通航旅游 | 农业生产 |
| 5 | 短途运输、通航旅游 | 林业生产、应急救援 |
| [1] |
林友芳, 尹康, 党毅, 等. 基于时空LSTM的OD客运需求预测[J]. 北京交通大学学报, 2019, 43(1):114-121.
[
|
| [2] |
|
| [3] |
吴文婕, 张小雷, 杨兆萍, 等. 基于社会需求与交通可达性的新疆通勤机场布局研究[J]. 干旱区地理, 2017, 40(5):1097-1104.
[
|
| [4] |
|
| [5] |
|
| [6] |
陈欣, 袁建, 戴靓. 基于空间计量模型的机场网络溢出效应研究[J]. 交通运输系统工程与信息, 2019, 19(4):211-217.
[
|
| [7] |
郭昕曜, 景国勋, 王远声, 等. 中国通用航空应急救援能力的测度评估方法及其应用研究[J]. 安全与环境学报, 2023, 23(5):1383-1389.
[
|
| [8] |
张波, 黄涛, 杨凤田. 通用航空工业市场的培育瓶颈与运营模式[J]. 宏观经济管理, 2019(1):78-84.
[
|
| [9] |
何昕, 宫献鑫. 基于启发式算法的通用机场初步布局研究[J]. 常州工学院学报, 2016, 29(6):26-29.
[
|
| [10] |
周岩, 邵荃, 王浩. 非运输型A2级通用机场布局规划方法[J]. 科学技术与工程, 2019, 19(33):397-402.
[
|
| [11] |
邵梦雪, 邵荃, 叶涛. 西部地区A1级通用机场扩展布局规划方法[J]. 科学技术与工程, 2019, 19(27):397-402.
[
|
| [12] |
皮骏, 王凯, 齐福强. 通用航空应急救援点选址布局优化研究[J]. 消防科学与技术, 2022, 41(2):270-274.
[
|
| [13] |
|
| [14] |
|
| [15] |
|
| [16] |
张喆. 基于连续需求的区域最大覆盖设施选址问题的研究[D]. 北京: 北京交通大学, 2019.
[
|
| [17] |
|
| [18] |
吴钦钦, 王珂, 樊文有, 等. 基于连续空间需求的公共图书馆最大覆盖选址方法——以武汉市主城区为例[J]. 地理与地理信息科学, 2020, 36(1):27-34,99.
[
|
| [19] |
赵冰, 曹允春. 多机场临空经济区差异化发展经验及对北京临空经济区的启示[J]. 企业经济, 2018, 37(2):176-182.
[
|
| [20] |
杨新湦, 王倩. 机场群综合分类评价方法研究[J]. 现代电子技术, 2017, 40(16):135-139.
[
|
| [21] |
|
| [22] |
|
| [23] |
汪延彬, 何瑞东, 王娅妮, 等. 基于成本距离的铁路客运站交通可达性空间特征研究——以甘肃省为例[J]. 安徽师范大学学报(自然科学版), 2022, 45(1):58-63,77.
[
|
| [24] |
|
| [25] |
|
| [26] |
王小杰, 夏军强, 李启杰, 等. 长江中下游各省市洪涝灾情时空变化及影响因素[J]. 水资源保护, 2023, 39(2):78-86.
[
|
| [27] |
|
| [28] |
Center for International Earth Science Information Network-CIESIN-Columbia University. 2018. Gridded population of the world, version 4 (GPWv4): population density adjusted to match 2015 revision UN WPP country totals, revision 11. Palisades, New York: NASA Socioeconomic Data and Applications Center (SEDAC). DOI: 10.7927/H4F47M65
|
/
| 〈 |
|
〉 |
