
应用群落生态学方法的发达地区乡村土地覆被格局与动态研究
|
程东亚(1994—),男,安徽亳州人,博士生,研究方向为城乡发展。E-mail: wwwcdongya@yeah.net |
收稿日期: 2023-10-31
修回日期: 2023-12-31
网络出版日期: 2024-05-21
基金资助
国家自然科学基金项目(42071224)
国家社会科学基金后期资助项目(21FSHB014)
教育部人文社会科学基金项目(20YJCZH069)
Research on Land Cover Patterns and Dynamics in Developed Rural Areas Using Community Ecology Methods
Received date: 2023-10-31
Revised date: 2023-12-31
Online published: 2024-05-21
Supported by
National Natural Science Foundation of China(42071224)
Later-stage project of National Social Science Foundation of China(21FSHB014)
Humanities and Social Science Foundation of the Ministry of Education of China(20YJCZH069)
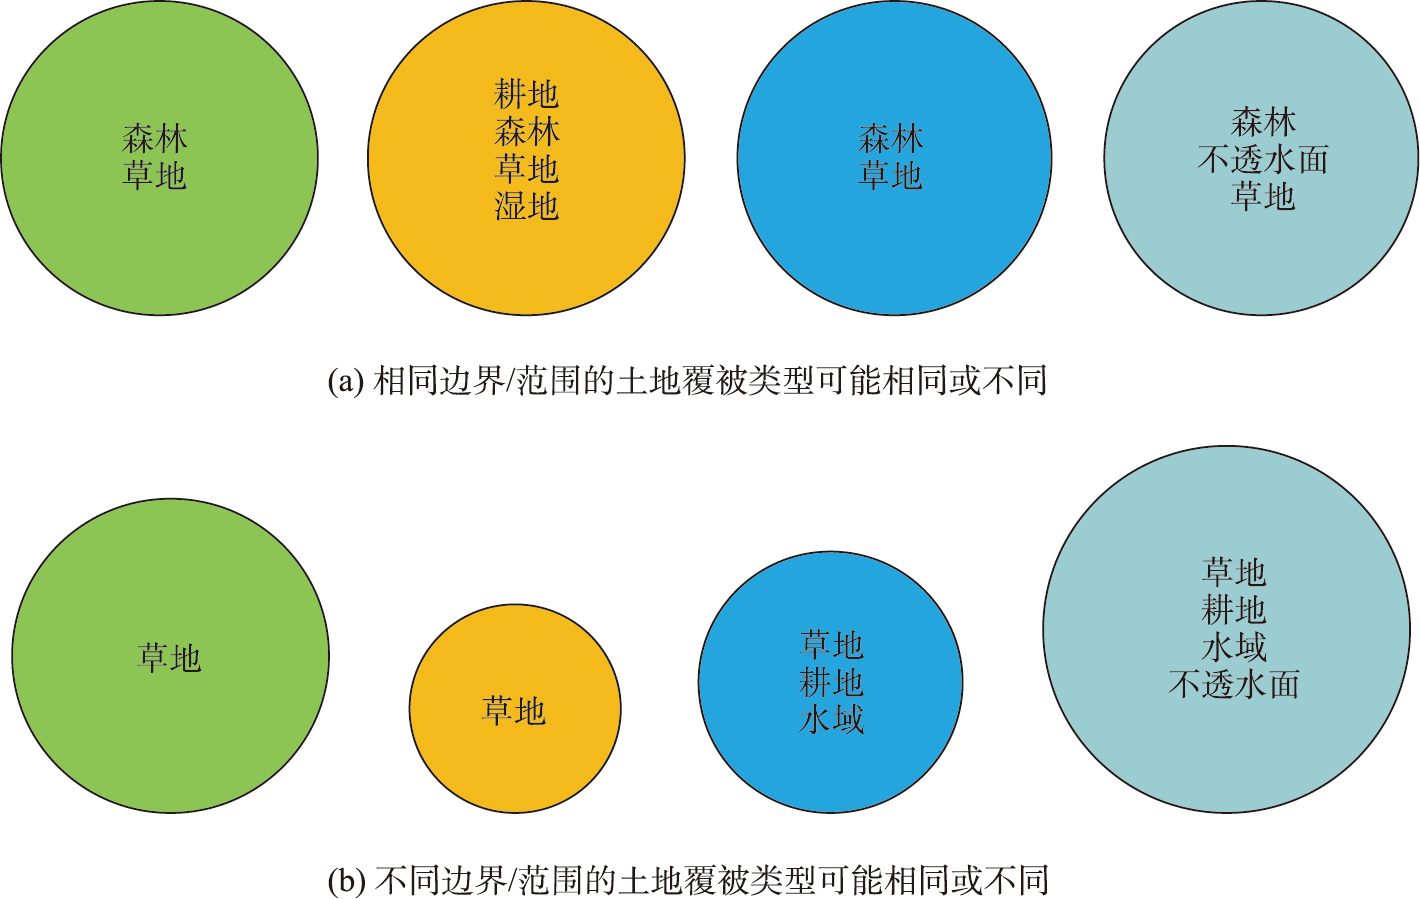
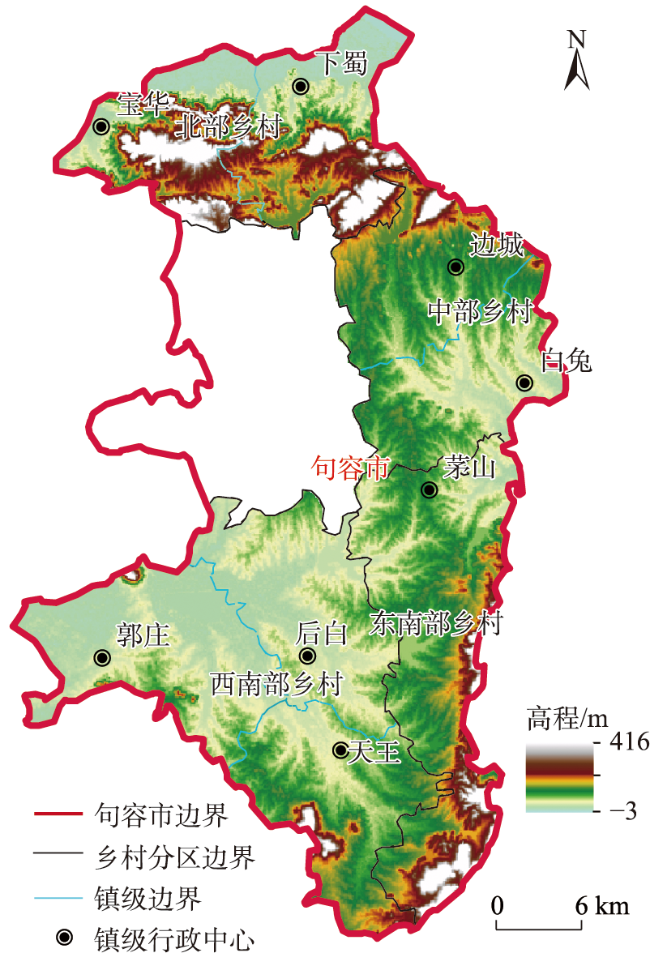
以新的视角解析土地覆被变化特征,对深入认识土地覆被具有重要价值。本文以群落生态学相关理论和方法为基础,构建了其在土地覆被/土地利用中的研究框架。基于该研究框架,本文以江苏镇江句容市乡村地区为研究区,解析了研究区2000—2020年土地覆被变化与动态过程。研究结果认为:① 土地覆被整体由具体的土地覆被类型组成,可以从边界性、集合性、交互性3个角度认识和理解土地覆被,不同土地覆被类型相互作用可以通过生态位、生态位分化、竞争等角度认识和理解; ② 研究区土地覆被整体变化来看: 2000—2020年等级-多度表现为相似的趋势,期间土地覆被香农-维纳指数上升。1 km×1 km土地覆被空间自相关结果来看: 2000—2020年研究区土地覆被丰富度高-高(High-High)类型分布有减少趋势,北部乡村最大优势度低-低(Low-Low)类型分布相对较多,同时北部乡村香农-维纳指数高-高(High-High)类型分布也相对较多; ③ 群落生态学研究方法在未来土地覆被/土地利用研究中的作用:等级-多度可以反映土地覆被/土地利用主导类型,丰富度采用小单元观测可以反映土地覆被/土地利用种类数量空间差异,优势度可以反映某种土地覆被/土地利用类型的地位和作用,香农-维纳指数可以反映土地覆被/土地利用综合多样性和复杂性。本研究结果能为土地覆被/土地利用研究提供一种新的研究范式和思路,也能为发达地区乡村发展提供参考和启示。
程东亚 , 张小林 , 李红波 , 陈欣蔚 . 应用群落生态学方法的发达地区乡村土地覆被格局与动态研究[J]. 地球信息科学学报, 2024 , 26(5) : 1315 -1334 . DOI: 10.12082/dqxxkx.2024.230644
Analyzing the characteristics of land cover changes from a new perspective holds significant value for a better understanding of land cover and land use. In this study, we proposed a research framework of land cover and land use based on the relevant theories and methods from community ecology. Based on this framework, we analyzed the land cover changes in the rural area of Jurong City, Zhejiang, Jiangsu Province during the period of 2000-2020. The results showed that: (1) The entire land cover consists of specific land cover types, which can be recognized and characterized from three aspects: boundary, aggregation, and interaction. The interaction of different land cover types can be recognized and understood from aspects of niche, niche differentiation, and competition. Specifically, there were niches in various land cover types, niche differentiation was fundamental to land cover distribution, and competition drove the land cover evolution; (2) For the overall land cover change in the study area, rank-abundance showed a similar trend, with the Shannon-Wiener index of land cover increasing during 2000-2020. Through the spatial autocorrelation analysis of the 1 km×1 km land cover, the distribution of high-high type of richness in the study area showed a decreasing trend from 2000 to 2020, the distribution of low-low type of maximum dominance in the northern rural areas was relatively large, and the distribution of high-high type of Shannon-Wiener index in the northern rural areas was also relatively large. During 2000-2020, the overall land cover rank-abundance in the study area showed a relatively stable evolution, with an overall Shannon-Wiener index increase of 0.14. At the scale of 1 km×1 km, the richness, maximum dominance, and Shannon-Wiener index had their own characteristics, indicating that it is necessary to observe land cover change at small scales and small units; (3) By exploring the role of community ecology methods in future land cover and land use research, we found that rank-abundance can reflect the dominant type of land cover and land use, richness can highlight the spatial difference of land cover and land use type by using small unit observations, dominance can indicate the status and role of a certain land cover and land use type, and Shannon-Wiener index can quantify the comprehensive diversity and complexity of land cover and land use. For future studies of land cover and land use, this paper suggests the use of small-scale and small-unit grid for changes in land cover and land use analysis to find out the change characteristics distinct from the past. The results of this study can provide new research paradigms and ideas for land cover and land use studies, serving as a reference and inspiration for rural development in developed areas.
Key words: land cover; community ecology; rank-abundance; richness; dominance; Shannon-Wiener index; pattern; dynamic; rural area; developed area
表1 群落生态学方法在土地覆被研究中的应用Tab. 1 Application of community ecology methods in land cover research |
| 方法 | 生态学中内涵 | 本文使用的思路 | 公式 | 变量说明 | 公式编号 |
|---|---|---|---|---|---|
| 等级-多度 | 一般是指相对多度与多度等级的联系,体现了群落等级位序和均匀性特点[21-22] | 土地覆被等级-多度曲线呈现快速下降曲线,说明单一土地覆被类型作为主导,土地覆被均匀性低。土地覆被等级-多度曲线相对平缓,则说明土地覆被均匀程度高,其主导类型相对不明显 | |||
| 丰 富 度 | 丰富度是指一定范围或区域内物种种类的多少[21-22] | 土地覆被存在类型差异,必然具有不同土地覆被丰富度。土地覆被丰富度越高,则表示土地覆被类别越齐全,反之则表示土地覆被类别稀少 | |||
| 优 势 度 | 生态学中优势度可以理解为物种在群落中的优势地位[21⇓⇓-24] | 某个土地覆被类型优势度越高,则说明其对整体影响较大,其计算公式参考文献[23]—[24]得出。根据生态学中优势种、亚优势种、伴生种、偶见种的特点[25-26],不同土地利用类型地位和作用的分类如表2。需要说明的是,如果某个范围内存在2个及以上土地覆被类型优势度相等且最大,此时称为其他类 | YSDi表示特定范围内i个土地覆被类型的优势度;ACSi表示i个土地覆被类型所占据的面积;AC表示所有土地覆被类型占据的面积总和 | (1)[23-24] | |
| 香农-维纳指数 | 生态学中香农-维纳指数和辛普森指数可以反映生物群落综合多样性,指数越大则说明群落内物种多样性越高[21-22] | 土地覆被多样性用等级-多度、丰富度、优势度观测相对直观,但缺少综合性表征结构变化。Shannon多样性指数和Simpson多样性可以反映土地覆被的综合多样性水平,多样性指数越大则说明土地覆被多样性越高。香农-维纳指数公式参考文献[21]—[22]得出 | XShannon表示香农-维纳指数;Pi代表第i个土地覆被类型所占据的比例; s表示土地覆被类型数量 | (2)[21-22] | |
| 辛普森指数 |
表2 土地覆被类型中优势类、亚优势类、伴生类等划分标准Tab.2 Classification criteria of dominant type, subdominant type and auxiliary type, etc. among land cover types |
| 取值范围 | YSDi≥ 50% | 10%≤ YSDi<50% | 1%≤ YSDi<10% | YSDi<1% |
|---|---|---|---|---|
| 分类 | 优势类 | 亚优势类 | 伴生类 | 偶见类 |
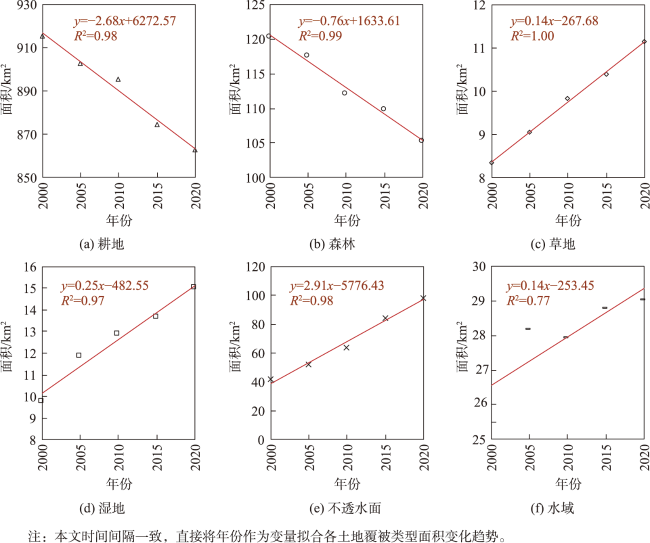
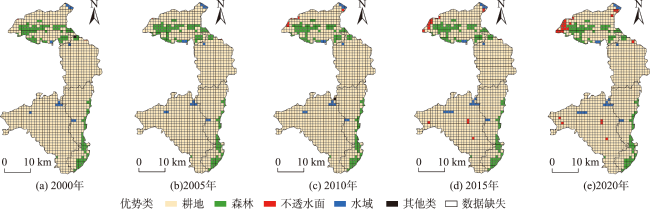
图3 2000—2020年江苏镇江句容市乡村地区不同土地覆被面积变化趋势Fig. 3 Change trend of different land cover area in rural areas of Jurong City, Zhenjiang, Jiangsu Province during 2000-2020 |
表3 2000—2020年江苏镇江句容市乡村地区不同阶段土地覆被面积变化表Tab.3 Change of land cover area at different stages in rural areas of Jurong City, Zhenjiang, Jiangsu Province during 2000-2020 (km2) |
| 土地覆被类型 | 2000—2005年 | 2005—2010年 | 2010—2015年 | 2015—2020年 | 2000—2020年 |
|---|---|---|---|---|---|
| 耕地 | -12.84 | -7.42 | -20.72 | -11.89 | -52.87 |
| 森林 | -2.69 | -5.48 | -2.32 | -4.53 | -15.02 |
| 草地 | 0.70 | 0.78 | 0.54 | 0.77 | 2.79 |
| 湿地 | 2.13 | 1.02 | 0.76 | 1.36 | 5.27 |
| 不透水面 | 10.40 | 11.33 | 20.87 | 13.99 | 56.59 |
| 水域 | 2.30 | -0.23 | 0.87 | 0.24 | 3.18 |
| 其他 | 0.00 | 0.01 | 0.00 | 0.05 | 0.06 |
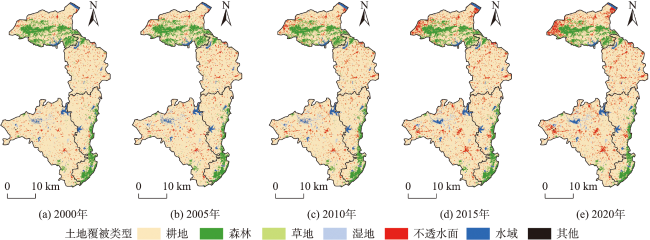
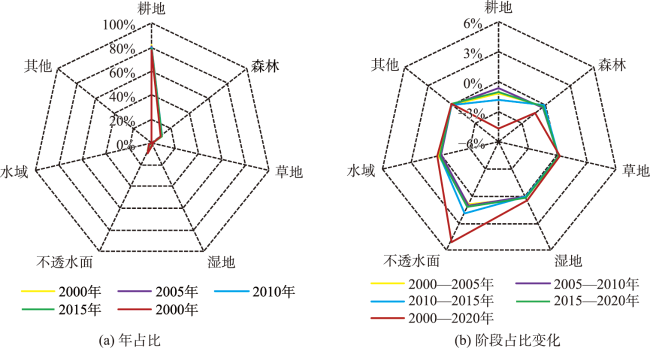
图5 2000—2020年江苏镇江句容市乡村地区土地覆被年占比和阶段占比变化Fig. 5 Percentage of annual and stage changes of land cover in rural areas of Jurong City, Zhenjiang, Jiangsu Province during 2000-2020 |
表4 2000—2020年江苏镇江句容市乡村地区不同土地覆被类型动态度Tab.4 Dynamics of different land cover types in rural areas of Jurong City, Zhenjiang, Jiangsu Province during 2000-2020 |
| 土地覆被 类型 | 变化时段 | 动态度/% | 土地覆被 类型 | 变化时段 | 动态度/% | 土地覆被 类型 | 变化时段 | 动态度/% |
|---|---|---|---|---|---|---|---|---|
| 耕地 | 2010—2015年 | -0.46 | 森林 | 2005—2010年 | -0.93 | 草地 | 2005—2010年 | 1.72 |
| 2000—2020年 | -0.29 | 2015—2020年 | -0.82 | 2000—2005年 | 1.69 | |||
| 2000—2005年 | -0.28 | 2000—2020年 | -0.62 | 2000—2020年 | 1.67 | |||
| 2015—2020年 | -0.27 | 2000—2005年 | -0.45 | 2015—2020年 | 1.48 | |||
| 2005—2010年 | -0.16 | 2010—2015年 | -0.41 | 2010—2015年 | 1.10 | |||
| 土地覆被 类型 | 变化时段 | 动态度/% | 土地覆被 类型 | 变化时段 | 动态度/% | 土地覆被 类型 | 变化时段 | 动态度/% |
| 湿地 | 2000—2005年 | 4.38 | 不透 水面 | 2000—2020年 | 6.80 | 水域 | 2000—2005年 | 1.78 |
| 2000—2020年 | 2.70 | 2010—2015年 | 6.59 | 2010—2015年 | 0.62 | |||
| 2015—2020年 | 1.99 | 2000—2005年 | 5.00 | 2000—2020年 | 0.62 | |||
| 2005—2010年 | 1.71 | 2005—2010年 | 4.36 | 2015—2020年 | 0.17 | |||
| 2010—2015年 | 1.18 | 2015—2020年 | 3.32 | 2005—2010年 | -0.16 |
表5 2000—2020年江苏镇江句容市乡村地区不同土地覆被类型优势度和分类变化Tab. 5 Change trend of dominance and classification of different land cover types in rural areas of Jurong City, Zhenjiang, Jiangsu Province during 2000-2020 |
| 土地覆被类型 | 属性 | 年份 | ||||
|---|---|---|---|---|---|---|
| 2000年 | 2005年 | 2010年 | 2015年 | 2020年 | ||
| 耕地 | 优势度/% | 81.65 | 80.50 | 79.84 | 77.99 | 76.93 |
| 分类 | 优势类 | 优势类 | 优势类 | 优势类 | 优势类 | |
| 森林 | 优势度/% | 10.72 | 10.48 | 10.00 | 9.79 | 9.39 |
| 分类 | 亚优势类 | 亚优势类 | 亚优势类 | 伴生类 | 伴生类 | |
| 草地 | 优势度/% | 0.75 | 0.81 | 0.88 | 0.93 | 0.99 |
| 分类 | 偶见类 | 偶见类 | 偶见类 | 偶见类 | 偶见类 | |
| 湿地 | 优势度/% | 0.87 | 1.06 | 1.15 | 1.22 | 1.34 |
| 分类 | 偶见类 | 伴生类 | 伴生类 | 伴生类 | 伴生类 | |
| 不透水面 | 优势度/% | 3.71 | 4.64 | 5.65 | 7.51 | 8.76 |
| 分类 | 伴生类 | 伴生类 | 伴生类 | 伴生类 | 伴生类 | |
| 水域 | 优势度/% | 2.31 | 2.51 | 2.49 | 2.57 | 2.59 |
| 分类 | 伴生类 | 伴生类 | 伴生类 | 伴生类 | 伴生类 | |
表6 2000—2020年江苏镇江句容市乡村地区整体土地覆被香农-维纳指数Tab.6 Shannon-Wiener index of land cover in rural areas of Jurong City, Zhenjiang, Jiangsu Province during 2000-2020 |
| 多样性指数 | 年份 | ||||
|---|---|---|---|---|---|
| 2000年 | 2005年 | 2010年 | 2015年 | 2020年 | |
| 香农-维纳指数 | 0.69 | 0.73 | 0.76 | 0.81 | 0.84 |
| 多样性指数 | 时间阶段 | ||||
| 2000—2005年 | 2005—2010年 | 2010—2015年 | 2015—2020年 | 2000—2020年 | |
| 香农-维纳指数 阶段变化 | 0.04 | 0.02 | 0.05 | 0.03 | 0.14 |
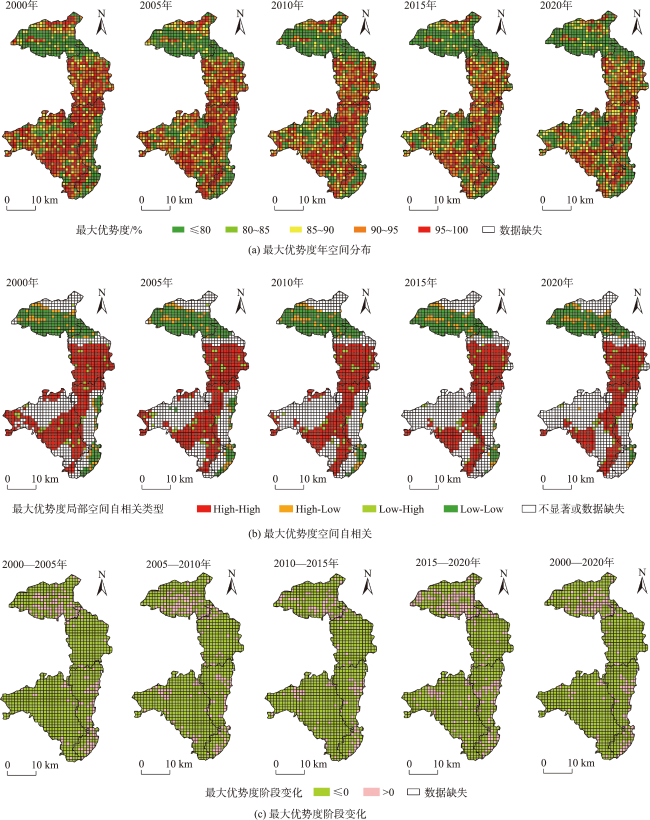
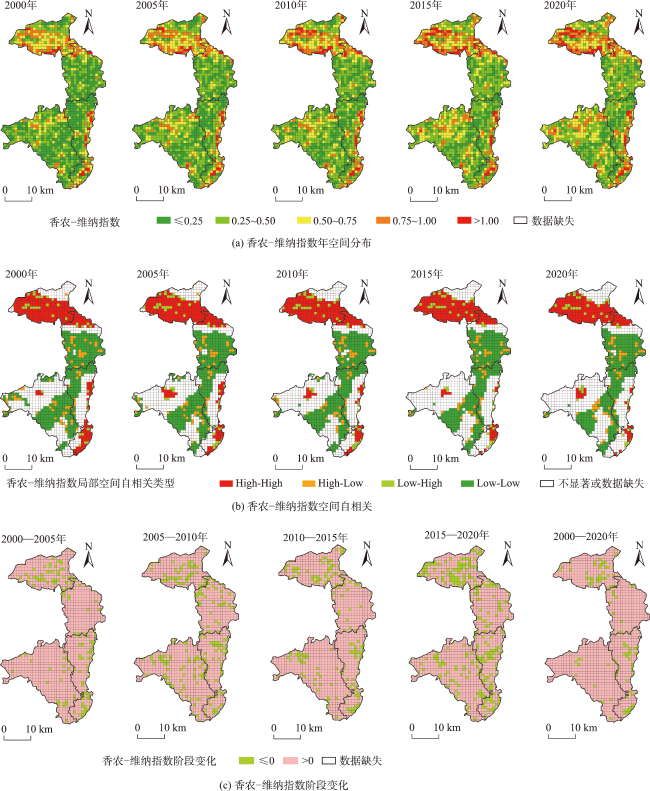
图8 2000—2020年江苏镇江句容市乡村地区土地覆被最大优势度年空间分布、空间自相关、阶段变化(1 km×1 km)Fig.8 Annual spatial distribution, spatial autocorrelation and stage change of maximum dominance of land cover in rural areas of Jurong City, Zhenjiang, Jiangsu Province during 2000-2020 (1 km×1 km) |
表7 群落生态学方法在土地覆被/土地利用研究中的用途总结Tab.7 A summary of the role of community ecology methods in land cover and land use research |
| 方法 | 整体(2000—2020年) | 1 km×1 km(2000—2020年) | 建议未来在土地覆被/土地利用研究中的用途 | 用途的其他说明 | |||
|---|---|---|---|---|---|---|---|
| 关键特征 | 规律 | 关键特征 | 规律 | ||||
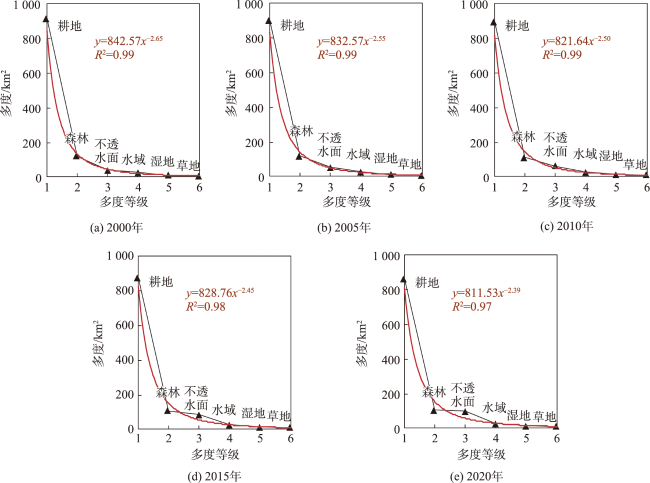
| 土地 覆被 等级- 多度 | 土地覆被多度等级未发生变化,等级-多度拟合曲线呈现幂曲线趋势 | 土地覆被多度等级一直未变,说明土地覆被内部结构相对稳定。等级-多度曲线呈现幂曲线趋势,说明土地覆被具有主导类型 | 多度等级反映土地覆被/土地利用内部结构的相对稳定性。等级-多度曲线反映土地覆被/土地利用主导类型 | 多度建议采用土地覆被/土地利用占比或面积表示 | |||
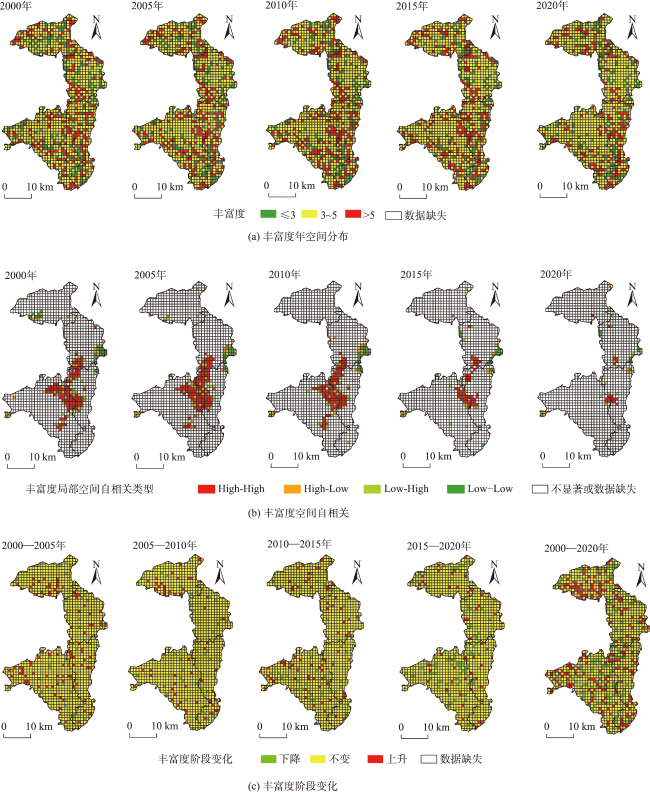
| 土地 覆被 丰富 度 | 东南部乡村和西南部乡村交界区土地覆被丰富度高-高(High-High)类型分布较多 | 说明区域土地覆被种类数量并非均质分布,存在种类数量偏多区域 | 反映土地覆被/土地利用种类数量多少,采小单元观测可以发现种类数量空间差异 | 通常情况下,建议采用小单元观测 | |||
| 土地 覆被 优势 度 | 初年到末年,耕地和森林优势度下降,其他土地覆被类型优势度总体有所上升 | 表明耕地和森林在区域土地覆被中的地位和作用总体有所下降 | 多数观测单元最大优势度均处于下降趋势 | 表明多数区域优势度最大的土地覆被类型地位和作用有降低趋势,其他土地覆被类型的地位和作用有上升趋势 | 反映某种土地覆被/土地利用类型地位和作用 | 小单元分析过程中,建议采用该单元内某土地覆被类型最大优势度观测,建议结合表2分析 | |
| 土地 覆被 香农- 维纳 指数 | 初年到末年,香农-维纳指数上升 | 表明整体土地覆被综合多样性表现为上升趋势,区域土地覆被分布越来越复杂 | 多数观测单元土地覆被-香农维纳指数上升 | 表明多数区域小范围内土地覆被变化越来越复杂 | 可以反映综合多样性,说明土地覆被变化复杂性 | ||
| 土地 覆被 辛普 森指 数 | 可以反映综合多样性,说明土地覆被变化复杂性 | ||||||
| [1] |
钱大文, 颜长珍, 修丽娜. 青藏高原木里矿区及其周边土地覆被变化及景观格局脆弱性响应[J]. 冰川冻土, 2020, 42(4):1334-1343.
[
|
| [2] |
[
|
| [3] |
李秀彬. 全球环境变化研究的核心领域──土地利用/土地覆被变化的国际研究动向[J]. 地理学报, 1996, 51(6):553-558.
[
|
| [4] |
王绍强, 陈育峰. USGCRP土地覆被研究的最新动向[J]. 地理科学进展, 1998, 17(1):52-57.
[
|
| [5] |
范泽孟. 基于SSP-RCP不同情景的京津冀地区土地覆被变化模拟[J]. 地理学报, 2022, 77(1):228-244.
[
|
| [6] |
张军民, 李昱桥, 荣城. 漓江流域2000—2020年土地利用和覆被变化时空分异特征[J]. 水土保持通报, 2022, 42(2):250-258.
[
|
| [7] |
仝冉, 杨雅萍, 陈晓娜. 多源30 m分辨率土地覆被数据在蒙古高原的一致性分析和精度评价[J]. 地球信息科学学报, 2022, 24(12):2420-2434.
[
|
| [8] |
王志杰, 代磊. 黔中喀斯特山地城市土地利用/覆被变化及其生态效应评价——以贵阳市花溪区为例[J]. 生态学报, 2021, 41(9):3429-3440.
[
|
| [9] |
李宏达, 高小红, 汤敏. 基于决策融合的SPOT-6影像土地覆被分类研究[J]. 地球信息科学学报, 2021, 23(5):928-937.
[
|
| [10] |
刘福红, 叶许春, 郭强, 等. 鄱阳湖流域不同土地覆被碳水利用效率时空变化及其与气候因子的相关性[J]. 生态学报, 2021, 41(2):694-706.
[
|
| [11] |
|
| [12] |
|
| [13] |
|
| [14] |
|
| [15] |
|
| [16] |
|
| [17] |
王超, 常勇, 侯西勇, 等. 基于土地利用格局变化的胶东半岛生境质量时空演变特征研究[J]. 地球信息科学学报, 2021, 23(10):1809-1822.
[
|
| [18] |
韩会然, 杨成凤, 宋金平. 北京市土地利用变化特征及驱动机制[J]. 经济地理, 2015, 35(5):148-154,197.
[
|
| [19] |
黄端, 李仁东, 邱娟, 等. 武汉城市圈土地利用时空变化及政策驱动因素分析[J]. 地球信息科学学报, 2017, 19(1):80-90.
[
|
| [20] |
谢平. 浅析物种概念的演变历史[J]. 生物多样性, 2016, 24(9):1014-1019.
[
|
| [21] |
小曼努埃尔·C. 莫里斯(Manuel C. Molles Jr.). 认识生态:第6版[M].孙振钧译, 北京: 科学技术文献出版社, 2019.
[
|
| [22] |
(英)贝根(Begon,M.), (新西)汤森(Townsend,C.R.), (英)哈珀(Harper,J.L). 生态学—从个体到生态系统:第四版[M].李博等译, 北京: 高等教育出版社, 2016.
[
|
| [23] |
邹运鼎, 丁程成, 毕守东, 等. 李园节肢动物群落与各亚群落之间在均匀度、优势度、优势集中性上的关系[J]. 安徽农业大学学报, 2005, 32(4):79-81.
[
|
| [24] |
张文, 张建利, 莫本田, 等. 喀斯特山地草地植物群落物种优势度及优势种分析[J]. 安徽农业科学, 2011, 39(29):17966-17969.
[
|
| [25] |
李紫晶, 莎娜, 史亚博, 等. 内蒙古西鄂尔多斯地区半日花荒漠群落特征及其分类[J]. 植物生态学报, 2019, 43(9):806-816.
[
|
| [26] |
张涛, 赵天亚, 栾静, 等. 基于物种分布模型分析环境因子对海州湾偶见种资源分布的影响[J]. 海洋学报, 2023, 45(7):69-78.
[
|
| [27] |
句容市统计局. 2022年句容市国民经济和社会发展统计公报[R]. 镇江: 句容市统计局, 2023.
[Statistics Bureau of Jurong City. Statistical bulletin on the economic and social development of Jurong City in 2022[R]. Zhenjiang: Statistics Bureau of Jurong City, 2023.]
|
| [28] |
|
| [29] |
程东亚, 李旭东. 贵州高原地形空间分布格局及其利用分析[J]. 高原科学研究, 2019, 3(3):61-74.
[
|
/
| 〈 |
|
〉 |
