
应用时空滤波模型的亚洲内部国际人口迁移流影响因素分析及短期预测
|
叶绮霖(2000— ),女,广东佛山人,硕士生,研究方向为空间数据分析。E-mail: 1150185384@qq.com |
收稿日期: 2024-01-03
修回日期: 2024-04-23
网络出版日期: 2024-05-24
基金资助
国家自然科学基金项目(42371435)
国家自然科学基金项目(41771417)
Analysis of Influential Factors and Short-term Forecast of International Migration Flows in Asia Using Eigenvector Space-Time Filtering Models
Received date: 2024-01-03
Revised date: 2024-04-23
Online published: 2024-05-24
Supported by
National Natural Science Foundation of China(42371435)
National Natural Science Foundation of China(41771417)
亚洲是国际人口迁移的活跃区域。除区域社会经济因素外,迁移流之间的时空依赖也不可忽视。本文基于1990—2020年6个时期亚洲国家双边移民流量数据,采用零膨胀负二项回归以及与之相结合的特征向量空间滤波和时空滤波模型(时空同期和时空滞后),分析亚洲内部国际人口迁移的影响因素,并对2020—2025年人口迁移流进行预测。结果初步表明: ① 亚洲国际人口迁移流存在显著的时空自相关,且同期邻近迁移流比过去邻近迁移流影响更大,加入表征时空依赖的特征向量能够有效提高模型拟合能力; ② 人口规模、经济水平、战乱情况以及邻近性是影响亚洲国际人口迁移流的主要因素,在1990—2020年,人口规模效应先减后增,经济差异驱动力则先强后弱,因战乱死亡人数仍具有较强的推力,地理距离的阻碍作用在减小,语言邻近和经济合作依然对人口迁移具有显著的促进作用; ③ 综合时空同期和时空滞后2种模型的预测结果,2020—2025年巴基斯坦和印度之间、印度 沙特、巴基斯坦 阿富汗和叙利亚 约旦的迁移趋势明显; ④ 根据2种时空滤波模型的结果,2020—2025年亚洲国际人口迁移流总量约为1.8×10⁷人。揭示亚洲内部国际人口迁移的时空依赖特性和其他规律有助于准确预测未来人口迁移趋势,同时为国家经济社会发展的宏观政策制定等提供科学决策参考。

关键词: 国际人口迁移流; 零膨胀负二项回归模型; 时空依赖; 特征向量时空滤波模型; 时空同期结构; 时空滞后结构; 人口迁移预测模型; 亚洲
叶绮霖 , 蒲英霞 , 叶翠 . 应用时空滤波模型的亚洲内部国际人口迁移流影响因素分析及短期预测[J]. 地球信息科学学报, 2024 , 26(6) : 1374 -1389 . DOI: 10.12082/dqxxkx.2024.240003
With the continuous advancement of the globalization process, communication and cooperation among countries and regions around the world are becoming increasingly closer, and the scale of international migration flows is also expanding. Asia stands out as an active region for international migration, with a large portion of migratory movements occurring within its borders. In addition to the social and economic factors of the origin and destination regions, spatial and temporal dependence among migration flows is crucial in understanding international migration dynamics, indicating that migration is influenced by neighboring and past migration flows. Different from other kinds of data (e.g., regional GDP), migration flows between different regions often contain many zero values, necessitating specific methods for handling them. Additionally, spatial and temporal dependence among migration flows can be categorized into space-time contemporaneous and lagged structures, with the former reflecting the links to the preceding location and the instantaneous neighboring locations, and the latter pertaining to the preceding location and the preceding neighboring locations. Based on the bilateral migration data of Asian countries in six periods from 1990 to 2020, this study utilizes eigenvector space-time filtering models, along with contemporaneous and lagged dependent structures, as well as eigenvector spatial filtering models and zero-inflated negative binomial regression models, to explore the influential factors of the international migration flows within Asia and their changes during 1990-2020. Finally, this study aims to forecast international flows within Asia between 2020 and 2025 based on two types of space-time filtering models. Preliminary results indicate significant space-time autocorrelation of international migration flows within Asia, with neighboring migration flows exerting a greater influence over the same time period compared to the past. Incorporating eigenvectors to represent spatial and temporal dependence effectively improves the goodness-of-fit of the models. Main factors affecting international migration flows within Asia include population size, economic level, war situation, and proximity. During the 30 years (1990-2020), the influence of population size fluctuated, economic disparities initially increased before weakening, wars continued to drive emigration, geographical barriers decreased, and factors like language proximity and economic cooperation significantly influenced migration. Looking ahead from 2020 to 2025, migration trends are evident between Pakistan and India, as well as from India to Saudi Arabia, from Pakistan to Afghanistan and from Syria to Jordan. Combining the forecasting results of the two eigenvector space-time filtering models, the mean value of the total volume of international migration flows within Asia from 2020 to 2025 is projected to be approximately 1.8×10⁷. India emerges as a major country for international migration. Understanding the spatial and temporal dependence and other characteristics of international migration within Asia is crucial for accurately forecasting future migration flows and providing scientific reference for policy making.
表1 变量名称及数据来源Tab. 1 Variable description and data sources |
| 指标类型 | 指标名称 | 变量名称 | 变量说明 | 数据来源 |
|---|---|---|---|---|
| 人口统计指标 | 人口总数 | Opop/Dpop | 迁出国/迁入国人口总数(万人) | 联合国人口司 |
| 劳动力占比 | Olabor/Dlabor | 迁出国/迁入国劳动年龄(15~64岁)的人口占总人口的百分比 | ||
| 经济发展水平指标 | 人均GDP | OGDP/DGDP | 迁出国/迁入国人均GDP(现价美元) | 世界银行 |
| 第二产业占比 | Osecond/Dsecond | 迁出国/迁入国第二产业占总增加值的百分比 | ||
| 第三产业占比 | Othird/Dthird | 迁出国/迁入国第三产业占总增加值的百分比 | ||
| 战乱情况指标 | 战乱死亡人数 | Oward/Dward | 迁出国/迁入国不同时期的战乱死亡人数(人) | UCDP数据库 |
| 邻近性指标 | 空间邻近性 | ODdist | 迁出国与迁入国首都之间的大地距离(km) | CEPII数据库 |
| 语言邻近性 | ODlan | 虚拟变量,若迁出国和迁入国的官方语言相同则为1,否则为0 | ||
| 经济合作邻近性 | ODtrade | 迁出国与迁入国的双边贸易总和(美元) | 联合国商品贸易统计数据库 |
表2 亚洲内部国际迁移流的四种不同模型结果(计数模型部分)Tab. 2 Four different model results of international migration flows in Asia (count models) |
| 变量 | 零膨胀负二项模型 | 空间滤波模型 | 时空滤波模型 | |||||||
|---|---|---|---|---|---|---|---|---|---|---|
| 时空同期模型 | 时空滞后模型 | |||||||||
| Esti | SE | Esti | SE | Esti | SE | Esti | SE | |||
| Intercept | 7.553*** | 0.654 | 4.786*** | 0.919 | -10.680*** | 1.076 | -4.367*** | 0.986 | ||
| Opop | 0.558*** | 0.007 | 0.470*** | 0.008 | 0.450*** | 0.009 | 0.518*** | 0.009 | ||
| Dpop | 0.461*** | 0.008 | 0.544*** | 0.009 | 0.544*** | 0.009 | 0.636*** | 0.009 | ||
| Olabor | -1.321*** | 0.108 | -0.973*** | 0.167 | -0.239 | 0.194 | 0.632*** | 0.180 | ||
| Dlabor | -0.185 | 0.126 | -0.290* | 0.173 | 1.260*** | 0.193 | -0.370** | 0.181 | ||
| OGDP | -0.102*** | 0.013 | -0.059*** | 0.016 | -0.058*** | 0.017 | -0.005 | 0.017 | ||
| DGDP | 0.488*** | 0.011 | 0.414*** | 0.015 | 0.371*** | 0.017 | 0.476*** | 0.016 | ||
| Osecond | -0.204*** | 0.039 | 0.062 | 0.044 | 0.432*** | 0.044 | -0.090* | 0.047 | ||
| Dsecond | -0.390*** | 0.031 | -0.495*** | 0.040 | -0.043 | 0.040 | -0.517*** | 0.039 | ||
| Othird | 0.020 | 0.044 | 0.157*** | 0.054 | 0.220*** | 0.063 | -0.052 | 0.067 | ||
| Dthird | -1.239*** | 0.047 | -0.961*** | 0.059 | -0.217*** | 0.061 | -0.886*** | 0.062 | ||
| Oward | 0.047*** | 0.004 | 0.059*** | 0.004 | 0.043*** | 0.005 | 0.074*** | 0.005 | ||
| Dward | 0.007*** | 0.001 | 0.001 | 0.001 | -0.004*** | 0.001 | 0.003** | 0.001 | ||
| ODdist | -1.199*** | 0.014 | -1.278*** | 0.019 | -1.163*** | 0.020 | -1.279*** | 0.022 | ||
| ODtrade | 0.019*** | 0.001 | 0.011*** | 0.001 | 0.010*** | 0.001 | 0.010*** | 0.001 | ||
| ODlan | 0.722*** | 0.034 | 0.998*** | 0.056 | 0.819*** | 0.056 | 1.135*** | 0.051 | ||
| 特征向量数/个 | - | 127 | 327 | 222 | ||||||
| 对数似然值 | -89 680.02 | -79 811.68 | -77 718.25 | -79 530.22 | ||||||
| AIC | 179 426.04 | 160 197.35 | 156 810.50 | 160 014.44 | ||||||
| BIC | 179 672.60 | 162 341.40 | 161 942.80 | 163 577.90 | ||||||
注:***、**和*分别表示0.01、0.05和0.1的显著性水平;Esti、SE分别表示估计系数和标准误。 |
表3 亚洲内部国际人口迁移流6个时期的空间滤波模型结果(计数模型部分)Tab. 3 The results from eigenvector spatial filtering models of six different time periods of international migration flows in Asia (count models) |
| 变量 | 1990—1995年 | 1995—2000年 | 2000—2005年 | 2005—2010年 | 2010—2015年 | 2015—2020年 | |||||||||||
|---|---|---|---|---|---|---|---|---|---|---|---|---|---|---|---|---|---|
| Esti | SE | Esti | SE | Esti | SE | Esti | SE | Esti | SE | Esti | SE | ||||||
| Intercept | -15.405*** | 2.210 | -4.999** | 2.541 | -13.718*** | 2.726 | -5.956** | 2.362 | -7.050** | 2.801 | -25.618*** | 3.835 | |||||
| Opop | 0.559*** | 0.019 | 0.519*** | 0.020 | 0.482*** | 0.022 | 0.487*** | 0.021 | 0.456*** | 0.022 | 0.502*** | 0.027 | |||||
| Dpop | 0.618*** | 0.019 | 0.597*** | 0.021 | 0.547*** | 0.022 | 0.408*** | 0.023 | 0.303*** | 0.023 | 0.465*** | 0.028 | |||||
| Olabor | 2.337*** | 0.393 | -0.131 | 0.427 | 0.654 | 0.419 | -1.151*** | 0.434 | 0.719 | 0.506 | 3.958*** | 0.598 | |||||
| Dlabor | -1.105*** | 0.402 | -1.112** | 0.436 | -0.377 | 0.466 | 0.391 | 0.386 | -0.384 | 0.452 | 1.758*** | 0.524 | |||||
| OGDP | -0.049 | 0.040 | -0.133*** | 0.041 | -0.186*** | 0.041 | -0.320*** | 0.040 | 0.072 | 0.050 | -0.157*** | 0.061 | |||||
| DGDP | 0.555*** | 0.030 | 0.441*** | 0.039 | 0.362*** | 0.037 | 0.291*** | 0.038 | 0.072 | 0.049 | 0.003 | 0.059 | |||||
| Osecond | -0.002 | 0.068 | -0.056 | 0.116 | 0.278* | 0.146 | -0.161 | 0.129 | -1.697*** | 0.164 | -0.867*** | 0.230 | |||||
| Dsecond | -0.360*** | 0.057 | 0.251** | 0.098 | 0.904*** | 0.135 | 1.407*** | 0.105 | 0.973*** | 0.161 | 0.351* | 0.211 | |||||
| Othird | 0.880*** | 0.072 | 1.291*** | 0.168 | 1.630*** | 0.199 | 0.627*** | 0.143 | -1.546*** | 0.259 | -0.644 | 0.396 | |||||
| Dthird | 0.574*** | 0.073 | 0.409** | 0.160 | 0.419** | 0.180 | 1.058*** | 0.159 | 3.063*** | 0.240 | 1.772*** | 0.397 | |||||
| Oward | 0.063*** | 0.009 | 0.022* | 0.012 | 0.090*** | 0.012 | 0.021 | 0.013 | 0.051*** | 0.012 | 0.039*** | 0.014 | |||||
| Dward | 0.020*** | 0.003 | -0.005 | 0.003 | 0.010*** | 0.003 | -0.013*** | 0.003 | -0.001 | 0.003 | 0.003 | 0.004 | |||||
| ODdist | -1.786*** | 0.042 | -1.734*** | 0.045 | -1.639*** | 0.046 | -1.354*** | 0.038 | -1.089*** | 0.049 | -1.066*** | 0.055 | |||||
| ODtrade | 0.016*** | 0.002 | 0.017*** | 0.002 | 0.029*** | 0.003 | 0.074*** | 0.001 | 0.167*** | 0.003 | 0.046*** | 0.004 | |||||
| ODlan | 1.459*** | 0.122 | 0.981*** | 0.128 | 0.463*** | 0.128 | 0.836*** | 0.115 | 1.281*** | 0.139 | 0.931*** | 0.150 | |||||
| 特征向量数/个 | 127 | ||||||||||||||||
注:***、**和*分别表示0.01、0.05和0.1的显著性水平;Esti、SE分别表示估计系数和标准误。 |
表4 4种模型对2010—2015年和2015—2020年亚洲内部国际人口迁移流总量的拟合结果Tab. 4 Fitted values of total international migration in Asia for 2010-2015 and 2015-2020 from four models |
| 时间/年 | 人口迁移量/人 | 模型 | ||||
|---|---|---|---|---|---|---|
| 零膨胀负二项 | 空间滤波 | 时空同期 | 时空滞后 | |||
| 2010—2015 | 实际总量 | 28 215 016 | ||||
| 拟合值 | 25 606 174 | 26 227 717 | 26 558 371 | 26 222 705 | ||
| 2015—2020 | 实际总量 | 22 714 585 | ||||
| 拟合值 | 26 915 301 | 27 691 568 | 22 044 790 | 22 640 657 | ||
表5 特征向量时空滤波模型对2020—2025年亚洲内部国际人口迁移总量预测结果Tab. 5 Forecasted values of total international migration in Asia for 2020-2025 using eigenvector space-time filtering models |
| 人口迁移量/人 | 时空同期模型 | 时空滞后模型 |
|---|---|---|
| 平均预测值 | 18 305 629 | 17 625 054 |
| 标准误差 | 1 968 564 | 2 348 358 |
表6 亚洲内部国际人口迁移2015年和2020年解释变量均值(对数化)与时空滤波模型系数结果Tab. 6 Mean values of explanatory variables (logarithmic) for 2015 and 2020 and coefficients of two eigenvector space-time filtering models for international migration in Asia |
| 变量 | 2015年均值 (对数化) | 2020年均值 (对数化) | 时空同期模型 | 时空滞后模型 | |||
|---|---|---|---|---|---|---|---|
| Esti | SE | Esti | SE | ||||
| Opop | 16.546 | 16.390 | 0.450*** | 0.009 | 0.518*** | 0.009 | |
| Dpop | 16.546 | 16.390 | 0.544*** | 0.009 | 0.636*** | 0.009 | |
| Olabor | 4.197 | 4.154 | -0.239 | 0.194 | 0.632*** | 0.180 | |
| Dlabor | 4.197 | 4.154 | 1.260*** | 0.193 | -0.370** | 0.181 | |
| OGDP | 15.479 | 14.933 | -0.058*** | 0.017 | -0.005 | 0.017 | |
| DGDP | 15.479 | 14.933 | 0.371*** | 0.017 | 0.476*** | 0.016 | |
| Osecond | 3.405 | 3.436 | 0.432*** | 0.044 | -0.090* | 0.047 | |
| Dsecond | 3.405 | 3.436 | -0.043 | 0.040 | -0.517*** | 0.039 | |
| Othird | 4.006 | 3.908 | 0.220*** | 0.063 | -0.052 | 0.067 | |
| Dthird | 4.006 | 3.908 | -0.217*** | 0.061 | -0.886*** | 0.062 | |
| Oward | -7.978 | -7.346 | 0.043*** | 0.005 | 0.074*** | 0.005 | |
| Dward | -7.978 | -7.346 | -0.004*** | 0.001 | 0.003** | 0.001 | |
| ODtrade | 11.984 | 8.569 | 0.010*** | 0.001 | 0.010*** | 0.001 | |
注:***、**和*分别表示0.01、0.05和0.1的显著性水平; Esti、SE分别表示估计系数和标准误。 |
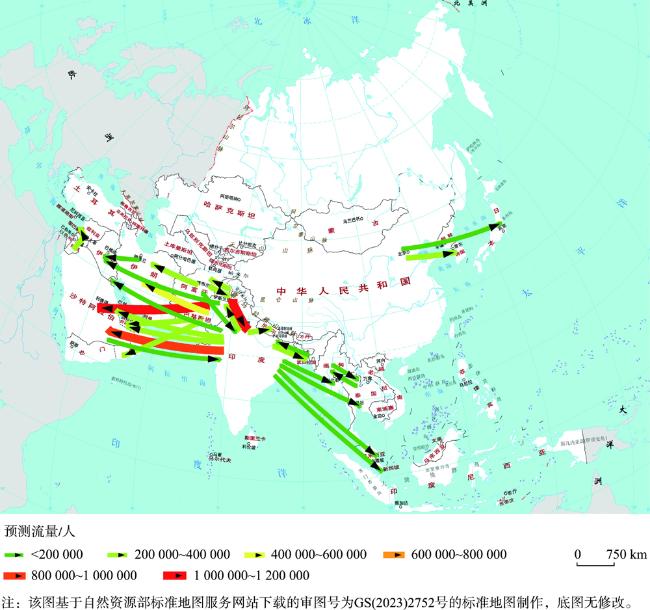
图1 2020—2025年亚洲国际人口迁移流预测结果前30条的空间格局(时空同期滤波模型)Fig. 1 Spatial pattern of the forecasted top 30 international migration flows in Asia for 2020-2025 using the space-time contemporaneous filtering model |
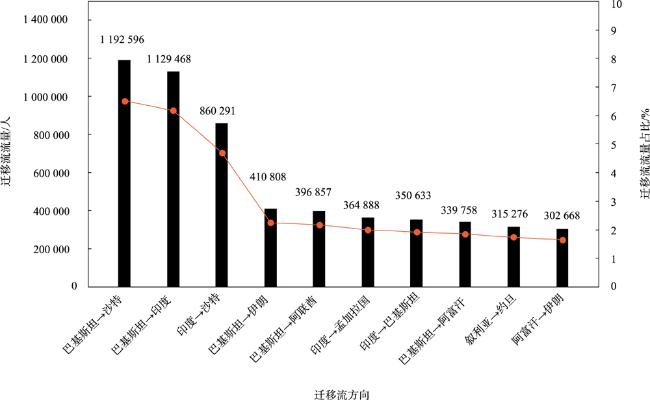
图3 2020—2025年亚洲国际人口迁移流预测结果前10名(时空同期滤波模型)Fig. 3 Forecasted top 10 international migration flows in Asia for 2020-2025 using the space-time contemporaneous filtering model |
表7 2020—2025年亚洲迁入总量预测结果前十位国家Tab. 7 Top 10 countries with forecasted total immigration in Asia from 2020 to 2025 |
| 时空同期模型 | 时空滞后模型 | ||||
|---|---|---|---|---|---|
| 国家 | 预测均值/人 | 标准误差/人 | 国家 | 预测均值/人 | 标准误差/人 |
| 沙特 | 2 558 132 | 498 615 | 印度 | 2 356 584 | 831 270 |
| 印度 | 2 165 196 | 778 521 | 巴基斯坦 | 1 183 233 | 566 675 |
| 阿联酋 | 1 085 902 | 574 853 | 黎巴嫩 | 1 054 088 | 336 902 |
| 伊朗 | 897 776 | 450 206 | 中国 | 1 043 012 | 222 228 |
| 孟加拉国 | 870 622 | 266 425 | 阿联酋 | 880 394 | 640 287 |
| 巴基斯坦 | 746 236 | 290 608 | 沙特 | 731 951 | 683 992 |
| 中国 | 738 290 | 166 045 | 泰国 | 679 166 | 450 292 |
| 约旦 | 653 566 | 251 045 | 约旦 | 628 327 | 267 167 |
| 泰国 | 608 101 | 303 596 | 日本 | 606 402 | 200 395 |
| 韩国 | 587 207 | 209 470 | 伊朗 | 469 098 | 531 770 |
表8 2020—2025年亚洲迁出总量预测结果前十位国家Tab. 8 Top 10 countries with forecasted total emigration in Asia from 2020 to 2025 |
| 时空同期模型 | 时空滞后模型 | ||||
|---|---|---|---|---|---|
| 国家 | 预测均值/人 | 标准误差/人 | 国家 | 预测均值/人 | 标准误差/人 |
| 巴基斯坦 | 4 509 955 | 856 907 | 印度 | 3 896 327 | 843 928 |
| 印度 | 3 771 111 | 634 607 | 巴基斯坦 | 2 748 513 | 1 104 889 |
| 叙利亚 | 976 623 | 796 468 | 叙利亚 | 1 894 109 | 921 629 |
| 阿富汗 | 910 766 | 348 349 | 阿富汗 | 1 315 259 | 417 643 |
| 孟加拉国 | 773 031 | 894 166 | 孟加拉国 | 1 045 111 | 923 951 |
| 泰国 | 704 723 | 159 647 | 印度尼西亚 | 617 570 | 152 090 |
| 中国 | 576 710 | 266 094 | 伊拉克 | 613 063 | 391 688 |
| 缅甸 | 547 684 | 263 463 | 黎巴嫩 | 600 382 | 599 601 |
| 伊朗 | 519 383 | 229 816 | 伊朗 | 567 636 | 580 148 |
| 伊拉克 | 441 008 | 347 104 | 缅甸 | 493 033 | 410 482 |
| [1] |
|
| [2] |
王国霞, 秦志琴, 程丽琳. 20世纪末中国迁移人口空间分布格局——基于城市的视角[J]. 地理科学, 2012, 32(3):273-281.
[
|
| [3] |
曾嵘, 魏一鸣, 范英, 等. 人口、资源、环境与经济协调发展系统分析[J]. 系统工程理论与实践, 2000, 20(12):1-6.
[
|
| [4] |
张晓青. 国际人口迁移理论述评[J]. 人口学刊, 2001, 23(3):41-45.
[
|
| [5] |
|
| [6] |
|
| [7] |
|
| [8] |
|
| [9] |
|
| [10] |
|
| [11] |
|
| [12] |
|
| [13] |
|
| [14] |
|
| [15] |
|
| [16] |
|
| [17] |
|
| [18] |
|
| [19] |
|
| [20] |
|
| [21] |
董理, 张启春. 我国地方政府公共支出规模对人口迁移的影响——基于动态空间面板模型的实证研究[J]. 财贸经济, 2014(12):40-50.
[
|
| [22] |
李建学, 蒲英霞, 刘大伟. 中国省际人口迁移短期预测分析[J]. 地理与地理信息科学, 2021, 37(2):54-62.
[
|
| [23] |
|
| [24] |
|
| [25] |
|
| [26] |
|
| [27] |
|
| [28] |
|
| [29] |
|
| [30] |
|
| [31] |
汪建昌. 中国国际移民政策变迁研究:内在逻辑与未来走向[J]. 江海学刊, 2021(3):131-137,255.
[
|
| [32] |
|
| [33] |
|
| [34] |
刘晔, 王晓歌, 管靖, 等. 1990—2015年亚洲内部人口迁移格局及影响因素[J]. 地理学报, 2022, 77(10):2409-2425.
[
|
| [35] |
|
| [36] |
|
| [37] |
|
| [38] |
|
| [39] |
|
| [40] |
|
| [41] |
|
| [42] |
|
| [43] |
|
| [44] |
|
| [45] |
|
| [46] |
张晓青, 王雅丽, 任嘉敏. 1990—2013年国际人口迁移特征、机制及影响研究[J]. 人口与发展, 2014, 20(4):20-27.
[
|
| [47] |
沈国兵, 徐源晗, 袁征宇. 新冠疫情全球蔓延对我国就业的影响及机制分析[J]. 经济问题探索, 2021(12):1-12.
[
|
| [48] |
陈红艳, 喻忠磊, 张华. 中国国际人口迁移的空间格局及影响因素[J]. 人口与发展, 2016, 22(6):12-24.
[
|
| [49] |
范力达. 全球化背景下的国际间人口迁移研究[J]. 人口学刊, 2003, 25(3):21-24.
[
|
| [50] |
吕越, 马明会, 李杨. 共建“一带一路”取得的重大成就与经验[J]. 管理世界, 2022, 38(10):44-55,95,56.
[
|
/
| 〈 |
|
〉 |