
松嫩典型黑土区耕地黑土层厚度数字制图方法比较
|
郭俊辉(1999— ),男,河南平顶山人,硕士生,研究方向为数字土壤制图。E-mail: guojunhui@issas.ac.cn |
收稿日期: 2023-11-15
修回日期: 2024-02-01
网络出版日期: 2024-05-24
基金资助
中国科学院战略性先导科技专项(XDA28010100)
中国科学院战略性先导科技专项(XDA28010102)
国家自然科学基金项目(42071072)
国家自然科学基金项目(42271369)
国家重点研发计划项目(2021YFD1500202)
Comparison of Digital Mapping Methods for the Thickness of Black Soil Layer of Cultivated Land in Typical Black Soil Area of Songnen Plain
Received date: 2023-11-15
Revised date: 2024-02-01
Online published: 2024-05-24
Supported by
The Strategic Forerunner Technological Projects of Chinese Academy of Sciences(XDA28010100)
The Strategic Forerunner Technological Projects of Chinese Academy of Sciences(XDA28010102)
National Natural Science Foundation of China(42071072)
National Natural Science Foundation of China(42271369)
National Key Research and Development Program of China(2021YFD1500202)
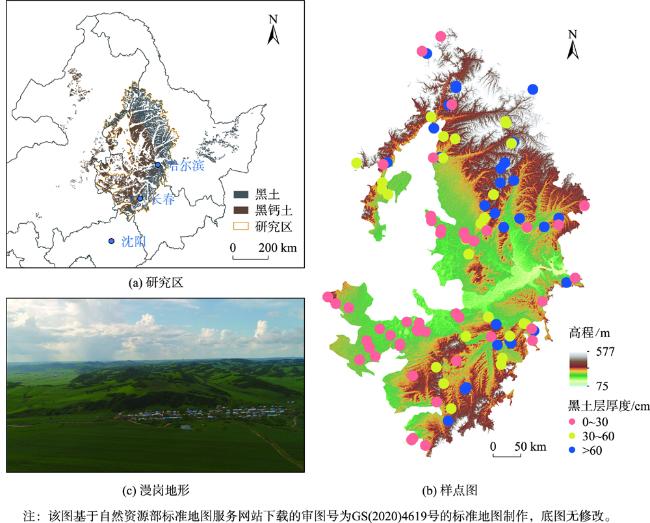
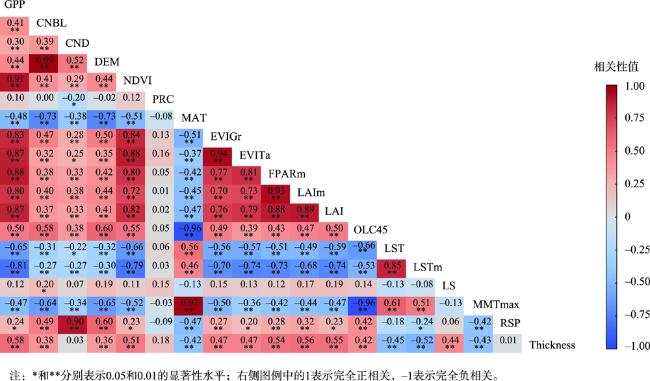
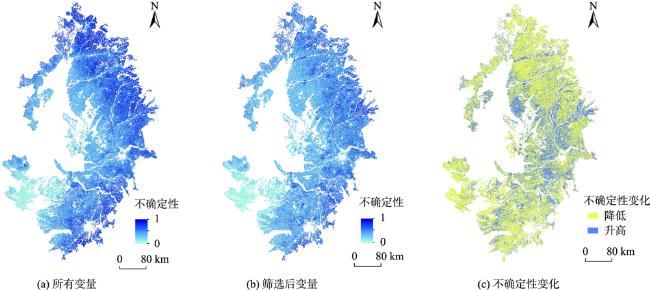
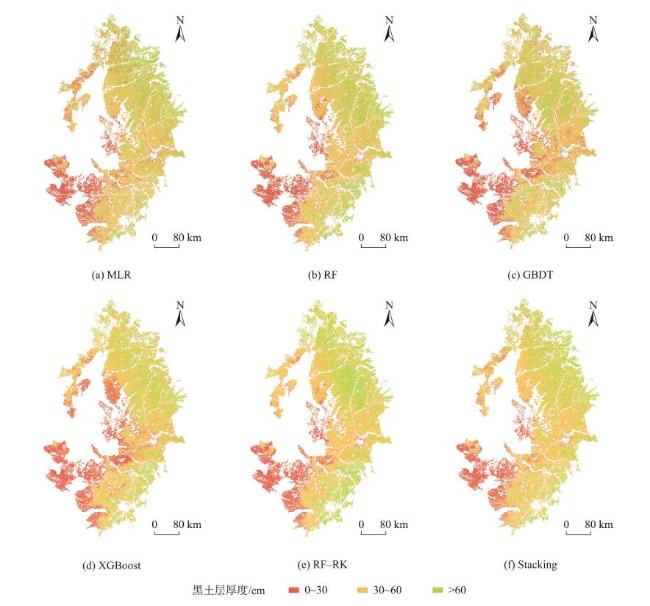
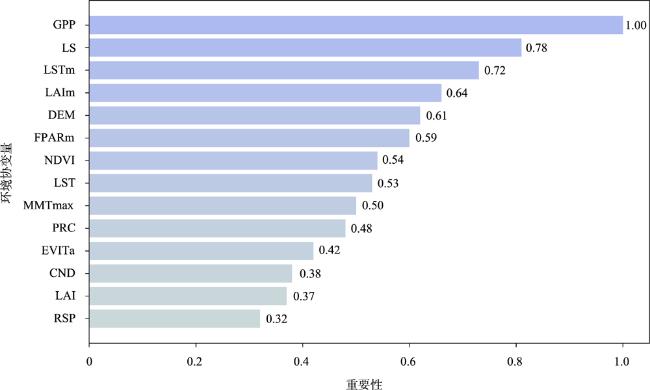
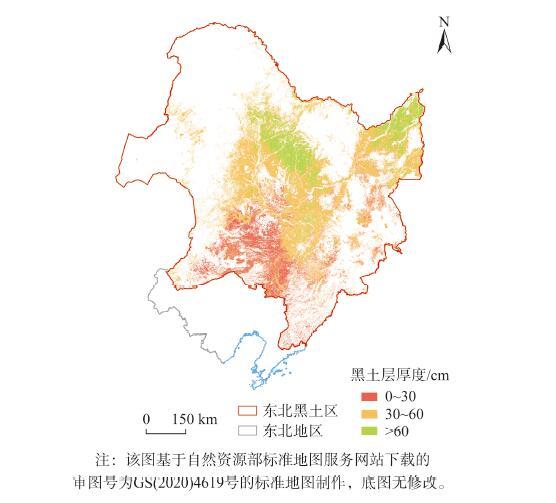
黑土层厚度与农田土壤肥力和质量密切相关,准确刻画东北松嫩典型黑土区耕地黑土层厚度的空间分布对黑土地保护和农业可持续发展具有重要意义。然而,常用的预测模型在平原漫岗地区进行数字制图具有较大的难度,如何准确预测黑土层厚度的空间分布特征是亟待解决的问题。选取东北地区松嫩典型黑土区作为研究区,以研究区内106个剖面点和45个环境因子为基础数据,通过因子重要性排序和相关性剔除法筛选变量,利用多元线性回归(Multiple Linear Regression,MLR)、随机森林(Random Forest,RF)、梯度提升树(Gradient Boosting Decsion Tree,GBDT)、极端梯度提升(Extreme Gradient Boosting,XGBoost)、随机森林回归克里格(Random Forest-Regression Kriging,RF-RK)和堆叠泛化模型(Stacking)对黑土层厚度进行空间预测制图,评估不同模型预测精度并研究影响黑土层厚度空间分布的最优协变量,并基于较优模型绘制东北黑土区耕地黑土层厚度分级图。结果表明: ① Stacking组合多种模型的优点,预测性能表现最佳(R2=0.47,MAE=21.02 cm,RMSE=27.12 cm),其次是RF-RK和RF; ② 通过变量筛选剔除低贡献度的环境变量后,不同模型的R2平均提高0.11,其中MLR提升幅度最大为0.32; ③ 不同模型预测的松嫩典型黑土区黑土层厚度空间分布趋势基本一致,60 cm以上的黑土层主要分布在研究区的东北部和东南部,而30 cm以下的黑土层主要分布在研究区的西南部。在平原漫岗地区,RF-RK和Stacking可以作为黑土层厚度预测的有效方法,总初级生产力(GPP)、坡度坡长因子(LS)和地表温度最大值合 成(LSTm)是模型中最重要的解释变量,且黑土层厚度的空间分布信息能为黑土区耕地黑土保护和农业可持续发展提供数据支持。

郭俊辉 , 刘峰 , 徐胜祥 , 高璐璐 , 赵治东 , 胡文友 , 于东升 , 赵玉国 . 松嫩典型黑土区耕地黑土层厚度数字制图方法比较[J]. 地球信息科学学报, 2024 , 26(6) : 1452 -1468 . DOI: 10.12082/dqxxkx.2024.230682
The thickness of black soil layer is closely related to the soil fertility and quality of agricultural soils. Accurately describing the spatial distribution of the thickness of the cultivated black soil layer in the typical black soil area of Songnen in Northeast China is of great significance. It contributes to the protection of black soil and promotes the sustainable development of agriculture. However, the commonly used predictive models are difficult to apply when trying to map digital soils in flat areas. How to accurately predict the spatial distribution characteristics of the thickness of black soil layer is an urgent problem that needs to be solved. The typical black soil area of Songnen in Northeast China was selected as the research area. Based on the basic data of 106 profile points and 45 environmental factors in the study area, the variables were screened by factor importance ranking and correlation elimination method. Multiple Linear Regression (MLR), Random Forest (RF), Gradient Boosting Decision Tree (GBDT), Extreme Gradient Boosting (XGBoost), Random Forest-Regression Kriging (RF-RK), and Stacking methods were used to predict the thickness of black soil layer. The predictive accuracy of different models was evaluated and the optimal covariates influencing the spatial distribution of the thickness of black soil layer were studied. Based on the best model, the black soil layer thickness classification map of farmland in the black soil area of northeast China was drawn. Our results showed that the Stacking method combined the advantages of several models, and its prediction performance was the best (R2=0.47, MAE=21.02 cm, RMSE=27.12 cm), followed by RF-RK and RF. After eliminating the environmental variables with low contribution through variable screening, the R2 of different models increased by an average of 0.11, with a maximum increase of 0.32 in MLR. The spatial distribution trend of the thickness of black soil layer predicted by different models was generally consistent. The black soil layer above 60 cm was mainly distributed in the northeast and southeast of the study area, while the black soil layer below 30 cm was mainly distributed in the southwest of the study area. In the plain area, RF-RK and Stacking can be used as effective methods for predicting the thickness of black soil layer. Gross Primary Productivity (GPP), Slope Length and Steepness Factor(LS), and Land Surface Temperature Maximum (LSTm) were the most important explanatory variables in the model. The spatial distribution information of the thickness of black soil layer can provide data support for black soil protection and agricultural sustainable development in the black soil region.
表1 环境变量基本信息Tab. 1 Basic information of environmental variables |
| 环境变量 | 初始分辨率/m | 简称 | |
|---|---|---|---|
| 地形因子 | 高程(Elevation) | 90 | DEM |
| 坡度(Slope) | 90 | Slope | |
| 坡向(Aspect) | 90 | Aspect | |
| 谷深(Valley Depth) | 90 | VD | |
| 坡度坡长因子(Slope Length and Steepness Factor) | 90 | LS | |
| 平面曲率(Plan Curvature) | 90 | PLC | |
| 剖面曲率(Profile Curvature) | 90 | PRC | |
| 地形起伏度(Topographic Relief) | 90 | TR | |
| 相对坡度位置(Relative Slope Position) | 90 | RSP | |
| 河网基准面(Channel Network Base Level) | 90 | CNBL | |
| 通道网络距离(Channel Distance Network) | 90 | CND | |
| 地形湿度指数(Topographic Wetness Index) | 90 | TWI | |
| 气候因子 | 年平均降雨量(Mean Annual Precipitation) | 1 000 | MAP |
| 年平均气温(Mean Annual Temperature) | 1 000 | MAT | |
| 月均气温最大值(Mean Month Temperature Maximum) | 1 000 | MMTmax | |
| 月均气温最小值(Mean Month Temperature Minimum) | 1 000 | MMTmin | |
| 遥感因子 | 近红外波段值(Near Infrared Band) | 30 | NIR |
| 总初级生产力(Gross Primary Productivity) | 500 | GPP | |
| 归一化植被指数(Normalized Difference Vegetation Index) | 250 | NDVI | |
| 增强植被指数(Enhanced Vegetation Index) | 250 | EVI | |
| 地表温度(Land Surface Temperature) | 1 000 | LST | |
| 地表温度最大值合成(Land Surface Temperature Maximum) | 1 000 | LSTm | |
| 光合有效辐射(Fraction of Photosynthetically Active Radiation) | 500 | FPAR | |
| 光合辐射最大值合成(Fraction of Photosynthetically Active Radiation Maximum) | 500 | FPARm | |
| 叶面积指数(Leaf Area Index) | 500 | LAI | |
| 叶面积指数最大值合成(Leaf Area Index Maximum) | 500 | LAIm | |
| EVI活跃累积量(EVI Active Accumulation) | 250 | EVIAa | |
| EVI振幅(EVI Amplitude) | 250 | EVIA | |
| EVI 基准值(EVI Base Value) | 250 | EVIBv | |
| EVI成长速率(EVI Growth Rate) | 250 | EVIGr | |
| EVI剩余累积量(EVI Remainder Accumulation) | 250 | EVIRa | |
| EVI总累积量(EVI Total Accumulation) | 250 | EVITa | |
| EVI最大值(EVI Maximum) | 250 | EVIm | |
| EVI标准差(EVI Standard Deviation) | 250 | EVISd | |
| 生长时间(Growth Tme) | 250 | GT | |
| 土壤因子 | 砂粒含量(Sand) | 1 000 | Sand |
| 粉粒含量(Silt) | 1 000 | Silt | |
| 二级岩性分类(Lithology) | 1 000 | Lithology | |
| 土壤类型(Soiltype) | 1 000 | Soiltype | |
| 土地利用类型(Landcover) | 1 000 | Landcover | |
| 地貌类型(Geomorphy) | 1 000 | Geomorphy | |
| 其他变量 | 纬度坐标(Latitude Coordinates) | - | LC |
| 倾斜45°纬度坐标(Oblique 45° Latitude Coordinates) | - | OLC45 | |
| 到主要河流距离(Distance to the River) | - | DtRiver | |
| 到主要道路距离(Distance to the Road) | - | DtRoad | |
表2 黑土层厚度描述性统计结果Tab. 2 Descriptive statistical results of the thickness of black soil layer |
| 黑土层类型 | 土层厚度/m | 样点数量/个 | 占比/% | 平均值 | 标准差 | 偏度 | 峰度 | 变异系数/% |
|---|---|---|---|---|---|---|---|---|
| 无 | 0 | 20 | 19 | 0 | 0 | - | - | - |
| 薄层 | 0~30 | 26 | 25 | 21.87 | 5.28 | -0.79 | 0.53 | 24.15 |
| 中层 | 30~60 | 28 | 26 | 47.96 | 8.84 | -0.23 | -1.19 | 18.44 |
| 厚层 | >60 | 32 | 30 | 90.55 | 27.80 | 1.24 | 0.91 | 30.70 |
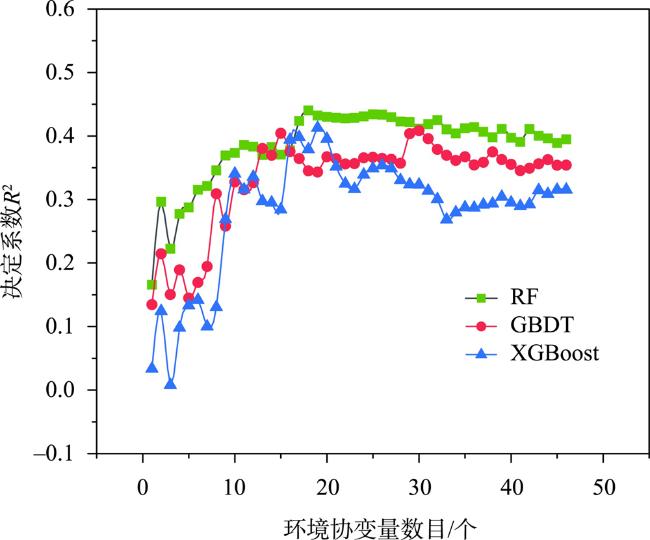
表3 变量筛选前后不同模型的预测性能Tab. 3 Predictive performance of different models before and after variable selection |
| 模型 | 所有变量 | 筛选后变量 | |||||
|---|---|---|---|---|---|---|---|
| R2 | MAE/cm | RMSE/cm | R2 | MAE/cm | RMSE/cm | ||
| MLR | 0.07 | 25.14 | 36.13 | 0.39 | 22.42 | 29.13 | |
| RF | 0.40 | 22.64 | 28.96 | 0.44 | 22.09 | 27.99 | |
| GBDT | 0.36 | 23.21 | 29.85 | 0.41 | 22.67 | 28.83 | |
| XGBoost | 0.29 | 23.92 | 31.50 | 0.43 | 22.57 | 28.33 | |
| RF-RK | 0.42 | 22.17 | 28.61 | 0.46 | 21.86 | 27.59 | |
| Stacking | 0.40 | 22.45 | 28.96 | 0.47 | 21.02 | 27.12 | |
表4 不同模型预测的黑土层厚度描述性统计及分级图面积占比Tab. 4 Descriptive statistics of the thickness of black soil layer predictions by different models and area proportion on graded maps |
| 模型 | 描述性统计 | 面积占比/% | ||||
|---|---|---|---|---|---|---|
| 平均值/cm | 标准差/cm | 变异系数/% | 薄层(0~30 cm) | 中层(30~60 cm) | 厚层(>60 cm) | |
| MLR | 48.30 | 24.05 | 49.79 | 20.61 | 49.88 | 29.50 |
| RF | 49.44 | 21.00 | 42.48 | 15.73 | 54.43 | 29.84 |
| GBDT | 45.87 | 25.84 | 56.33 | 26.05 | 46.72 | 27.23 |
| XGBoost | 45.50 | 24.95 | 54.83 | 24.08 | 51.35 | 24.57 |
| RF-RK | 49.63 | 22.77 | 45.88 | 17.23 | 50.03 | 32.74 |
| Stacking | 49.16 | 20.89 | 42.49 | 16.17 | 55.75 | 28.08 |
| [1] |
韩晓增, 李娜. 中国东北黑土地研究进展与展望[J]. 地理科学, 2018, 38(7):1032-1041.
[
|
| [2] |
张兴义, 隋跃宇, 宋春雨. 农田黑土退化过程[J]. 土壤与作物, 2013, 2(1):1-6.
[
|
| [3] |
李保国, 刘忠, 黄峰, 等. 巩固黑土地粮仓保障国家粮食安全[J]. 中国科学院院刊, 2021, 36(10):1184-1193.
[
|
| [4] |
刘登高, 张小川, 崔永, 等. 东北黑土地保护问题的调查报告[J]. 中国农业资源与区划, 2004, 25(4):16-19.
[
|
| [5] |
刘凯, 魏明辉, 戴慧敏, 等. 东北黑土区黑土层厚度的时空变化[J]. 地质与资源, 2022, 31(3):434-442,394.
[
|
| [6] |
张兴义, 刘晓冰. 中国黑土研究的热点问题及水土流失防治对策[J]. 水土保持通报, 2020, 40(4):340-344.
[
|
| [7] |
朱阿兴, 杨琳, 樊乃卿, 等. 数字土壤制图研究综述与展望[J]. 地理科学进展, 2018, 37(1):66-78.
[
|
| [8] |
张甘霖, 史舟, 朱阿兴, 等. 土壤时空变化研究的进展与未来[J]. 土壤学报, 2020, 57(5):1060-1070.
[
|
| [9] |
|
| [10] |
|
| [11] |
|
| [12] |
|
| [13] |
|
| [14] |
庞龙辉, 刘峰, 赵霞, 等. 青海省表层土壤属性数字制图[J]. 土壤通报, 2019, 50(3):505-513.
[
|
| [15] |
|
| [16] |
|
| [17] |
|
| [18] |
|
| [19] |
|
| [20] |
谭星. 山地丘陵区耕地土壤养分数字化制图研究[D]. 重庆: 西南大学, 2017.
[
|
| [21] |
|
| [22] |
周洋, 赵小敏, 郭熙. 基于多源辅助变量和随机森林模型的表层土壤全氮分布预测[J]. 土壤学报, 2022, 59(2):451-460.
[
|
| [23] |
马重阳, 孙越琦, 巫振富, 等. 基于不同模型的区域尺度耕地表层土壤有机质空间分布预测[J]. 土壤通报, 2021, 52(6):1261-1272.
[
|
| [24] |
|
| [25] |
金昭, 吕建树. 基于机器学习模型的区域土壤重金属空间预测精度比较研究[J]. 地理研究, 2022, 41(6):1731-1747.
[
|
| [26] |
刘芳, 张红旗. 中国八个重要农业区土地利用结构及时空变化分析[J]. 资源科学, 2011, 33(2):294-301.
[
|
| [27] |
中华人民共和国农业农村部. 东北黑土地保护规划纲要(2017—2030年)[Z].
[ Ministry of Agriculture and Rural Affairs of the People's Republic of China. Northeast black land protection plan outline (2017-2030)[Z]. ]
|
| [28] |
韩晓增, 邹文秀. 东北黑土地保护利用研究足迹与科技研发展望[J]. 土壤学报, 2021, 58(6):1341-1358.
[
|
| [29] |
|
| [30] |
|
| [31] |
翟瑞常, 辛刚, 张之一. 中国土系志·黑龙江卷[M]. 北京: 科学出版社, 2020.
[
|
| [32] |
隋跃宇, 焦晓光, 李建维. 中国土系志·吉林卷[M]. 北京: 科学出版社, 2019.
[
|
| [33] |
王秋兵, 韩春兰, 孙福军, 孙仲秀. 中国土系志·辽宁卷[M]. 北京: 科学出版社, 2020.
[
|
| [34] |
王秋兵, 韩春兰, 孙福军, 孙仲秀. 中国土系志·内蒙古卷[M]. 北京: 科学出版社, 2021.
[
|
| [35] |
Soil Survey Staff. Soil taxonomy: A basic system of soil classification for making and interpreting soil surveys.
[ M. Natural Resources Conservation Service. U.S. Department of Agriculture Handbook 436. 2nd edition. 1999.
|
| [36] |
范昊明, 蔡强国, 陈光, 等. 世界三大黑土区水土流失与防治比较分析[J]. 自然资源学报, 2005, 20(3):387-393.
[
|
| [37] |
|
| [38] |
|
| [39] |
|
| [40] |
|
| [41] |
|
| [42] |
|
| [43] |
|
| [44] |
王世航, 卢宏亮, 赵明松, 等. 基于不同特征挖掘方法结合广义提升回归模型估测安徽省土壤pH[J]. 应用生态学报, 2020, 31(10):3509-3517.
[
|
| [45] |
|
| [46] |
|
| [47] |
|
| [48] |
|
| [49] |
张智韬, 王海峰,
[
|
| [50] |
|
| [51] |
赵明松, 刘斌寅, 卢宏亮, 等. 基于地理加权回归的地形平缓区土壤有机质空间建模[J]. 农业工程学报, 2019, 35(20):102-110.
[
|
| [52] |
|
| [53] |
张哲寰, 赵海卿, 李春霞, 等. 松嫩平原土地沙化现状与动态变化[J]. 地质与资源, 2008, 17(3):202-207,234.
[
|
| [54] |
张晓平, 梁爱珍, 申艳, 等. 东北黑土水土流失特点[J]. 地理科学, 2006, 26(6):687-692.
[
|
| [55] |
满卫东, 王宗明, 刘明月, 等. 1990-2013年东北地区耕地时空变化遥感分析[J]. 农业工程学报, 2016, 34(7):1-10.
[
|
| [56] |
|
| [57] |
李冠稳, 高小红, 肖能文, 等. 特征变量选择和回归方法相结合的土壤有机质含量估算[J]. 光学学报, 2019, 39(9):0930002.
[
|
| [58] |
|
| [59] |
|
| [60] |
黎恩丹, 杨勤科, 庞国伟, 等. 青藏高原坡度坡长因子(LS)空间格局及影响因素分析[J]. 水土保持学报, 2023, 37(1):133-139.
[
|
| [61] |
王世岩, 杨永兴, 杨波. 三江平原典型湿地土壤温度变化及其影响因子分析[J]. 地理研究, 2003, 22(3):389-396.
[
|
| [62] |
王俊雅, 刘峰, 宋效东, 等. 基于地表温度的干旱平缓区土壤属性制图[J]. 土壤通报, 2018, 49(6):1270-1278.
[
|
/
| 〈 |
|
〉 |