
人视街景图像和机器学习结合的城市街道适老性水平空间效应研究
|
李海薇(1996— ),女,广东佛山人,博士生,主要从事城市人居环境与人群健康福祉、基于地理大数据的空间感知等研究。E-mail: haiwei@stu.scau.edu.cn |
收稿日期: 2023-12-21
修回日期: 2024-02-22
网络出版日期: 2024-05-24
基金资助
国家自然科学基金青年项目(51808229)
广州市科技计划项目(202201010046)
Spatial Distribution Characteristics and Influencing Factors of Age-friendly Urban Streets Based on Human-centered Streetview Images
Received date: 2023-12-21
Revised date: 2024-02-22
Online published: 2024-05-24
Supported by
National Natural Science Foundation of China for Youths(51808229)
Science and Technology Program of Guangzhou, China(202201010046)
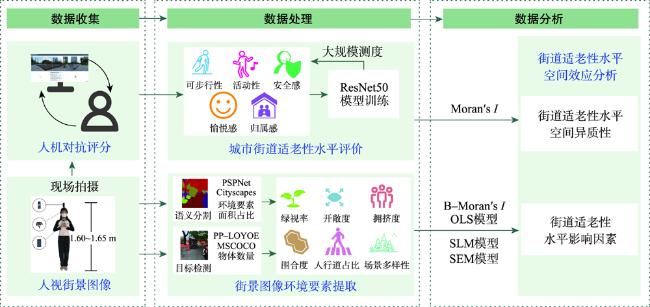
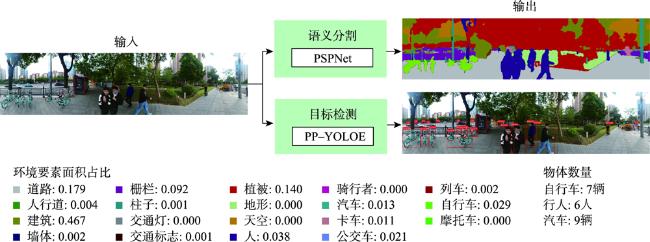
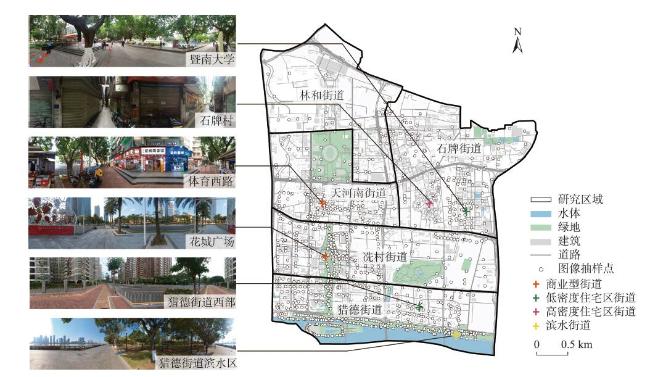
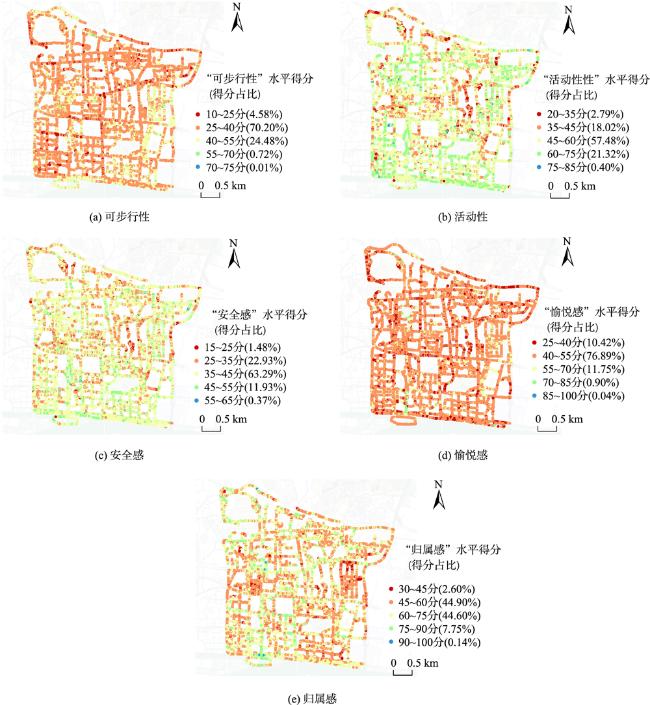
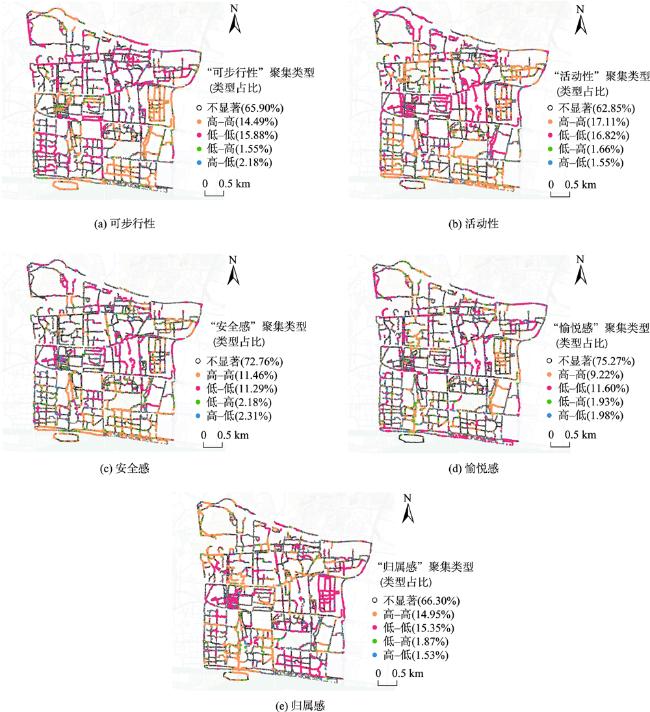
城市街道与老年人的日常活动密切相关,探讨街道环境适老性水平的空间分布特征及其关键影响因素,对老年友好型城市公共空间建设有重要指导作用。然而,既有研究难以贴近真实的人本视角、快速、大规模且精准地评估街道适老性水平的地理空间效应。因此,本研究从人行视角采集街景图像,结合语义分割和目标检测技术提取环境要素,利用人机对抗众包评价与残差神经网络50(ResNet50)技术测度街道环境适老性水平,采用莫兰指数(Moran's I)、普通最小二乘回归模型(OLS)、空间滞后模型(SLM)和空间误差模型(SEM)综合分析街道适老性水平的地理空间异质性及其影响因素;最后,选取了老龄化程度明显、街道环境多样的广州天河核心区为例进行实证研究。研究发现: ① 本研究结合了人视街景图像、机器学习和空间统计学方法,能够快速、有效地开展街道适老性水平评价,揭示其空间效应特征和关键影响因素; ② 街道适老性水平指标在研究区存在中等偏高程度的空间聚集性,商业型街道和靠近住宅区的街道、滨水街道差异大。水平较高的是商业型街道和靠近低密度住宅区的街道,较低的是靠近高密度住宅区的街道。老年人在滨水街道的活动性和安全感高,但愉悦感低;对靠近住宅区街道的归属感低; ③ 不同街道环境要素对适老性水平的影响存在差异。绿视率、开敞度和围合度对街道适老性水平的影响较强,拥挤度、人行道占比与场景多样性几乎无影响。研究有助于为精细化、具身性的城市街道适老化空间研究与实践提供参考和理论依据。

李海薇 , 陈崇贤 , 刘欣宜 , 吴伊童 , 陈斯璐 . 人视街景图像和机器学习结合的城市街道适老性水平空间效应研究[J]. 地球信息科学学报, 2024 , 26(6) : 1469 -1485 . DOI: 10.12082/dqxxkx.2024.230758
With the acceleration of population aging, the urban built environment for the elderly faces severe challenges. Urban street environments, one of the most frequently used places by the elderly, require high-quality construction, which is vital for realizing an age-friendly society. However, few studies have focused on the spatial effects and influencing factors of urban street environment quality for the elderly from a large-scale and human perspective, resulting in difficult practical applications. Therefore, this study took Tianhe district, Guangzhou as a study area, using machine learning and deep learning technology to evaluate the urban street environment quality for the elderly and analyze its spatial distribution and influencing mechanisms. Based on 14 916 human-centric street view images taken by panoramic cameras, semantic segmentation and object detection techniques were used to extract environmental elements. Greenness, openness, crowdedness, enclosure, sidewalk ratio, and scene diversity were obtained finally as explanatory variables in this study. A human-machine adversarial scoring system was constructed for the age-friendly street environment quality assessment. Twenty-two elderly volunteers were invited to rate their sense of walkability, vitality, security, belonging, and pleasure from 1 000 randomly selected images. A residual neural network 50 (ResNet50) was used to predict the urban street environment quality in the Tianhe district based on street view images and crowd-sourced data. The spatial autocorrelation was measured by global and Local Moran's I. Ordinary Least Square regression model (OLS), Spatial Lag Model (SLM), and Spatial Error Model (SEM) were established to analyze the influence mechanisms. Results show that: (1) Using human-centric street view images, machine learning, and spatial statistics methods, this study conducted a fast, large-scale, and precise age-friendly street environment quality assessment and accounted for spatial heterogeneity to identify its key influencing factors; (2) There was a moderate degree of spatial aggregation of different street environment qualities for the elderly in the Tianhe district. For older people, commercial streets and streets near low-density residential areas were associated with higher levels of walkability, activity, sense of safety, and pleasure. Although waterfront streets had higher levels of activity and security, the level of pleasure was low. Streets near high-density residential areas were found to have lower levels of activity level, sense of safety, and pleasure. The sense of belonging was higher in commercial streets and lower in streets close to residential areas; (3) The effects of environmental factors on different street environment quality indexes for the elderly were different. Greenness, openness, and enclosure were important factors while visual crowdedness, sidewalks, and scene diversity played a weak role. Greenness had a positive effect on activity level and sense of safety, but a negative effect on pleasure and sense of belonging. Openness was positively correlated with walkability, pleasure, and sense of belonging, and negatively correlated with activity levels. Enclosure had negative effects on all indicators, especially the sense of belonging. These results reveal the spatial association, heterogeneity, and influencing mechanisms of the street environment quality for the elderly based on human-centric street view images, machine learning, and deep learning techniques on a large urban scale. It shows a feasible paradigm to analyze the street environment for the elderly, providing practical implications to build resilient streets more conducive to an age-friendly society. It's of great value for policy-making, urban planning, and management.
表1 解释变量指标定义和计算方式Tab. 1 Definitions and formulas for the explanatory variables |
| 指标 | 定义 | 公式 | 编号 | 解释 |
|---|---|---|---|---|
| 绿视率 | 绿视率是指植被在人视野中占的面积比例 | (1) | Gi表示第i张图像中植被像素占总像素的比例; Vi表示植被的像素数量;ni表示总像素数量 | |
| 开敞度 | 人视野中可见的天空的比例,影响人们视野的开放性和对自然光的感知 | (2) | Oi表示第i张图像中天空像素占总像素的比例; Si表示天空的像素数量 | |
| 拥挤度 | 与街道的自行车和行人有关,反映了街道区域的拥挤程度 | (3) | Vi是第i张图像中行人和自行车的总数; pi表示行人的数量;bi表示自行车数量 | |
| 围合度 | 街道空间视觉上由建筑物、 墙体、树木等垂直元素界定 的程度 | (4) | Ei表示第i张图像中街道在视觉上被街道墙和相应 的水平元素包围的程度;Vi表示植被的像素数量; Ti表示地形像素的数量;BUi表示建筑像素的数量, Wi表示墙面像素的数量;Fi表示栅栏像素的数量, Pi表示杆子像素的数量 | |
| 人行道占比 | 人行道与道路的比率 | (5) | Wi代表第i张图像中人行道占比;PEi表示人行道像素 的数量;Ri表示道路像素的数量 | |
| 场景多样性 | 街道元素的相对多样性 | (6) | Ri表示第i张图像中街景元素的丰富程度; d表示每张图片中街景元素类型的数量 |
表2 城市街道适老性水平指标Tab. 2 Indexes of age-friendly urban streets evaluation |
| 指标 | 问题描述 |
|---|---|
| 可步行性 | 该环境是否适宜步行 |
| 活动性 | 该环境是否能满足您的日常活动需求 |
| 安全感 | 该环境是否给您带来足够的安全感 |
| 愉悦感 | 该环境是否让您感到愉悦 |
| 归属感 | 该环境是否能让您产生归属感 |
表3 研究区域街道环境适老性水平基本情况Tab. 3 Descriptive statics of age-friendly urban streets evaluation indexes in the study area |
| 指标 | 均值 | 中位数 | 标准差 |
|---|---|---|---|
| 可步行性 | 35.71 | 42.05 | 6.88 |
| 活动性 | 52.54 | 61.67 | 9.14 |
| 安全感 | 38.69 | 44.69 | 5.81 |
| 愉悦感 | 47.89 | 54.34 | 6.90 |
| 归属感 | 61.15 | 69.80 | 9.21 |
表4 城市街道空间要素与适老性水平的双变量全局莫兰指数Tab. 4 B-Moran’s I results of urban street environmental elements and age-friendly indexes |
| 可步行性 | 活动性 | 安全感 | 愉悦感 | 归属感 | |
|---|---|---|---|---|---|
| 绿视率 | 0.017*** | 0.456*** | 0.273*** | -0.064*** | -0.221*** |
| 开敞度 | 0.208*** | -0.060*** | 0.048*** | 0.165*** | 0.208*** |
| 拥挤度 | -0.097*** | -0.055*** | -0.091*** | -0.067*** | 0.080*** |
| 围合度 | -0.074*** | 0.104*** | 0.028*** | -0.118*** | -0.252*** |
| 人行道占比 | 0.007* | -0.014*** | 0.004 | 0.000 | -0.029*** |
| 场景多样性 | 0.049*** | 0.026*** | 0.070*** | 0.042*** | 0.107*** |
注:*、**、***分别表示变量在90%、95%、99%置信水平上显著。 |
表5 OLS、SLM和SEM模型结果Tab. 5 Results of OLS, SLM, and SEM |
| 变量 | 可步行性 | 活动性 | 安全感 | 愉悦感 | 归属感 | ||||||||||||||
|---|---|---|---|---|---|---|---|---|---|---|---|---|---|---|---|---|---|---|---|
| VIF | 模型1 OLS | 模型2 SLM | 模型3 SEM | 模型4 OLS | 模型5 SLM | 模型6 SEM | 模型7 OLS | 模型8 SLM | 模型9 SEM | 模型10 OLS | 模型11 SLM | 模型2 SEM | 模型13- OLS | 模型14 SLM | 模型15 SEM | ||||
| 绿视率 | 1.224 | 0.874* | -10.608 | -1.706*** | 49.112*** | 48.445*** | 34.743*** | 18.270*** | 12.668*** | 17.173*** | -5.024*** | -4.161*** | -7.536*** | -12.249*** | -6.340*** | -9.247*** | |||
| 开敞度 | 1.598 | 31.373*** | 12.683*** | 18.940*** | -8.824*** | -8.064*** | -7.903*** | 5.004*** | 1.943* | 1.137 | 15.577*** | 5.526*** | 9.333*** | 11.569*** | 1.046 | 10.691*** | |||
| 拥挤度 | 1.104 | -0.201*** | -0.142*** | -0.184*** | 0.102*** | 17.574*** | 0.108*** | -0.090*** | -0.059*** | -0.669*** | -0.204*** | -0.149*** | 0.173*** | 0.108*** | 0.058*** | 0.108*** | |||
| 围合度 | 1.886 | -0.341 | -1.601** | -1.986*** | -9.151*** | -9.173*** | -5.828*** | -3.178*** | -2.178*** | -3.405*** | -5.373*** | -4.047*** | -3.574*** | -25.698*** | -20.253*** | -24.567*** | |||
| 人行道 占比 | 1.022 | 1.036*** | 0.728*** | 0.660*** | -0.325 | -0.358 | -0.417 | -0.219 | -0.338* | -0.377* | 0.518* | 0.221 | 0.093 | -1.367*** | -1.158*** | -0.859*** | |||
| 场景多 样性 | 1.180 | 0.079* | -0.103*** | -0.171*** | -0.061* | 0.070 | -0.082** | 0.268*** | 0.204*** | 0.206*** | -0.030 | -0.051 | -0.173** | 0.249*** | 0.156*** | 0.212*** | |||
| R2 | 0.098 | 0.437 | 0.443 | 0.544 | 0.642 | 0.677 | 0.208 | 0.334 | 0.342 | 0.080 | 0.344 | 0.351 | 0.266 | 0.517 | 0.539 | ||||
| 调整后 的R2 | 0.098 | 0.544 | 0.208 | 0.080 | 0.266 | ||||||||||||||
| AIC | 100 320.0 | 94 658.8 | 94 603.1 | 98 601.2 | 95 577.6 | 94 638.3 | 93 203.9 | 91 209.5 | 91 150.4 | 100 703.0 | 96 741.1 | 96 653.6 | 106 089.0 | 100 950.0 | 100 547.0 | ||||
| Rho | 0.677*** | 0.461*** | 0.466*** | 0.609*** | 0.623*** | ||||||||||||||
| Lambda | 0.696*** | 0.632*** | 0.505*** | 0.629*** | 0.684*** | ||||||||||||||
| LogL | -50 153.1 | -47 321.4 | -47 294.5 | -49 293.6 | -47 780.8 | -47 312.2 | -46 594.9 | -45 596.7 | -45 568.2 | -50 344.3 | -48 362.6 | -48 319.8 | -53 037.4 | -50 466.9 | -50 266.4 | ||||
注:*、**、***分别表示变量在90%、95%、99%置信水平上显著。 |
| [1] |
|
| [2] |
周燕珉, 林婧怡. 我国养老社区的发展现状与规划原则探析[J]. 城市规划, 2012, 36(1):46-51.
[
|
| [3] |
韩瑞娜, 杨东峰, 魏越. 街道空间对老年人日常活动的影响初探[J]. 西部人居环境学刊, 2023, 38(1):37-44.
[
|
| [4] |
贾巍杨. 社区适老性评价指标体系研究初探[J]. 城市规划, 2016, 40(8):65-70.
[
|
| [5] |
金俊, 齐康, 白鹭飞, 等. 基于宜居目标的旧城区微空间适老性调查与分析——以南京市新街口街道为例[J]. 中国园林, 2015, 31(3):91-95.
[
|
| [6] |
魏越, 杨东峰. 基于街景图片的邻里目的地建成环境适老性评价——以大连市为例[J]. 建筑学报, 2022(S1):24-30.
[
|
| [7] |
|
| [8] |
|
| [9] |
陈崇贤, 罗玮菁, 李海薇, 等. 居住区景观环境与老年人健康关系研究进展[J]. 南方建筑, 2021(3):22-28.
[
|
| [10] |
岳亚飞, 杨东峰, 徐丹. 城市蓝绿空间对老年心理健康影响机制的探究与检验[J]. 风景园林, 2022, 29(12):71-77.
[
|
| [11] |
魏越, 杨东峰. 邻里目的地建成环境对老年日常活动机会的影响——基于感知和参与视角[J]. 地理科学进展, 2023, 42(1):89-103.
[
|
| [12] |
李康康, 杨东峰. 影响老年人公交出行便捷性的个体与建成环境要素[J]. 交通运输系统工程与信息, 2023, 23(2):161-167.
[
|
| [13] |
|
| [14] |
|
| [15] |
蒲英霞, 葛莹, 马荣华, 等. 基于ESDA的区域经济空间差异分析——以江苏省为例[J]. 地理研究, 2005, 24(6):965-974.
[
|
| [16] |
张金茜, 巩杰, 马学成, 等. 基于GeoDA的甘肃白龙江流域景观破碎化空间关联性[J]. 生态学杂志, 2018, 37(5):1476-1483.
[
|
| [17] |
|
| [18] |
|
| [19] |
吉宇琴, 姜会明. 新时代老龄化与养老资源适配度时空差异及其影响因素分析[J]. 地理科学, 2022, 42(5):851-862.
[
|
| [20] |
毕向阳, 李沫. 在公平与效率之间:对北京市养老资源的空间分析[J]. 社会, 2020, 40(3):117-147.
[
|
| [21] |
|
| [22] |
|
| [23] |
|
| [24] |
|
| [25] |
李心雨, 闫浩文, 王卓, 等. 街景图像与机器学习相结合的道路环境安全感知评价与影响因素分析[J]. 地球信息科学学报, 2023, 25(4):852-865.
[
|
| [26] |
刘伦, 王辉. 城市研究中的计算机视觉应用进展与展望[J]. 城市规划, 2019, 43(1):117-124.
[
|
| [27] |
龙瀛, 唐婧娴. 城市街道空间品质大规模量化测度研究进展[J]. 城市规划, 2019, 43(6):107-114.
[
|
| [28] |
|
| [29] |
|
| [30] |
|
| [31] |
张雪诺, 杨超. 居住小区生活圈服务设施适老性评价[J]. 城市交通, 2022, 20(4):35-46.
[
|
| [32] |
王杰, 秦磊, 孙溢. 社区养老服务设施的空间布局与优化研究——以扬州市广陵区为例[J]. 经营与管理, 2023(1):115-123.
[
|
| [33] |
|
| [34] |
|
| [35] |
|
| [36] |
|
| [37] |
|
| [38] |
|
| [39] |
谭新建. 科研院所建成环境主观评价方法研究——以中国林业科学研究院为例[J]. 北京林业大学学报(社会科学版), 2015, 14(4):73-77.
[
|
| [40] |
赵万民, 李长东, 尤家曜. 城市公园适老运动环境影响要素聚类研究[J]. 中国园林, 2021, 37(5):50-55.
[
|
| [41] |
|
| [42] |
|
| [43] |
|
| [44] |
|
| [45] |
|
| [46] |
|
| [47] |
|
| [48] |
广州市统计局. 广州人口普查年鉴2020[EB/OL]. http://tjj.gz.gov.cn/stats_newtjyw/tjsj/pcsj/d7crkpc/content/post _8711587.html.
[ Municipal Bureau of Statistics. Guangzhou Census Yearbook in 2020[EB/OL]. http://tjj.gz.gov.cn/stats_newtjyw/tjsj/pcsj/d7crkpc/content/post _8711587.html. ]
|
| [49] |
|
| [50] |
|
| [51] |
|
| [52] |
|
| [53] |
韩林飞, 肖春瑶. 自然友好的亲生物型养老建筑设计研究[J]. 科技导报, 2021, 39(8):68-76.
[
|
| [54] |
岳玉娟, 鲁亮, 刘起勇. 广州市蚊虫密度与土地覆盖类型关系研究[J]. 中国媒介生物学及控制杂志, 2016, 27(2):99-102.
[
|
| [55] |
董慰, 娄健坤, 董禹. 社区可步行性对老年人地方依恋及就地养老意愿影响研究——以哈尔滨市香坊老工业区为例[J]. 上海城市规划, 2020(6):30-35.
[
|
/
| 〈 |
|
〉 |