
中国城市技术转移网络演化的内生机制及空间差异研究
|
李晓瑞(1998― ),女,山东枣庄人,硕士生,主要从事区域经济和城市网络等领域的研究。E-mail: lixiaorui20008@163.com |
Copy editor: 蒋树芳
收稿日期: 2024-01-31
修回日期: 2024-03-12
网络出版日期: 2024-06-25
基金资助
国家自然科学基金项目(42371209)
山东省自然科学基金面上项目(ZR2023MD049)
Endogenous Mechanisms and Spatial Differences of the Evolution of Urban Technology Transfer Network in China
Received date: 2024-01-31
Revised date: 2024-03-12
Online published: 2024-06-25
Supported by
National Natural Science Foundation of China(42371209)
Shandong Provincial Natural Science Foundation General Project(ZR2023MD049)
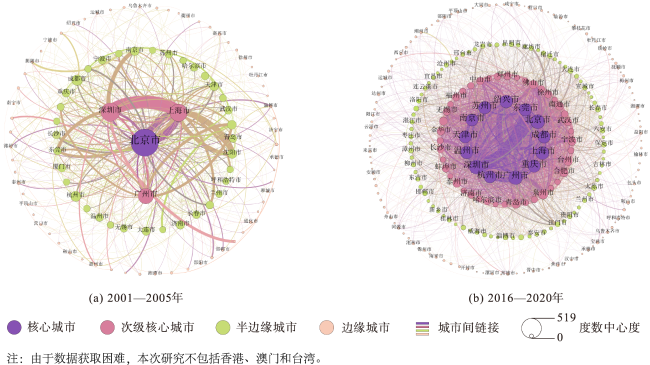
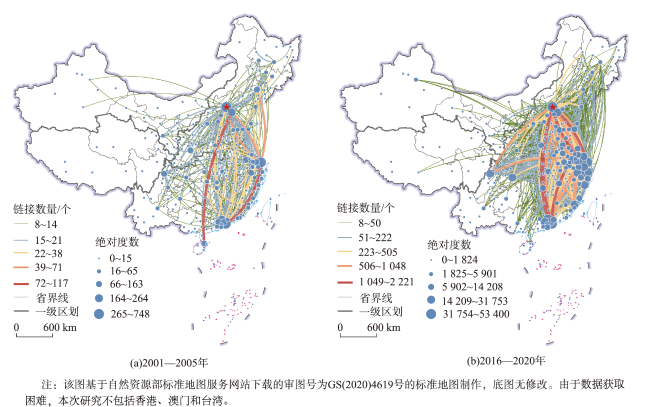
技术知识成为新时期区域创新发展的关键要素,探究技术转移网络生长发育内在机制对于提高区域创新活力具有重要意义。本文基于2001—2020年中国专利权转移数据构建了4个时段的城市技术转移网络,并采用社会网络分析法和随机行动者模型,研究了中国城市技术转移网络演化的内生机制及空间差异。研究发现: ① 中国城市技术转移网络的演化格局具有明显的“核心—边缘”结构特征。网络整体表现出较强的极化特征,但这种极化性有逐渐下降的态势。同时围绕着核心城市,大量涌现的三方关系在影响链接关系形成的同时,也进一步促成了网络局部等级的分化; ② 内生结构动力是中国城市技术转移网络生长发育的关键因素。互惠链接和网络闭合构成了城市技术转移网络演化的微观基础;偏好依附是强化城市技术转移网络链接关系的关键力量; ③ 中国城市技术转移网络演化的内生机制具有明显的空间异质性特征。东部南方区城市技术转移网络具有较强的动态性,互惠链接、网络闭合和偏好依附成为技术转移网络生长发育的内生结构动力;东部北方区网络演化速率呈现出下降的趋势,互惠链接和偏好依附促成了网络链接格局的形成;西北内陆和青藏高原区网络演化速率趋于上升,但网络密度小,仅有互惠效应显著。

李晓瑞 , 盛科荣 , 王传阳 . 中国城市技术转移网络演化的内生机制及空间差异研究[J]. 地球信息科学学报, 2024 , 26(7) : 1672 -1687 . DOI: 10.12082/dqxxkx.2024.240068
Technological knowledge has become the key element of regional innovation and development in the new era. Exploring the inherent mechanism of the growth and development of technology transfer network is of great significance to improve the vitality of regional innovation. However, the endogenous mechanisms and spatial differences of technology transfer network evolution is rarely studied. This study aims to gain a better understanding of the growth and development process of urban technology transfer networks in China and their spatial differences. First, this paper takes 282 cities of China as research units. Second, information on patent transferred data is subjected to ownership linkage mode to construct the urban technology transfer network, resulting in a panel dataset of 282 cities in China in 2001—2020. Finally, stochastic actor-oriented models for the evolution of networks are constructed to study the evolution of technology transfer networks and spatial heterogeneity. Results show that: (1) The evolution pattern of urban technology transfer network in China presents a "core-periphery" structure. The network exhibits strong polarization characteristics, but it is decreasing gradually. The increasingly complex tripartite relationship between cities is an important feature of network evolution. These tripartite relations not only affect the formation of link relations but also promote the differentiation of local levels of the network; (2) Endogenous structural factors are the key factors for the growth and development of urban technology transfer network in China. Reciprocity and network closure constitute the micro basis of the evolution of urban technology transfer network. Path dependence is a key force in strengthening the link relationship between urban technology transfer networks; (3) The endogenous mechanism of the evolution of urban technology transfer network in China has obvious spatial heterogeneity. In the southern region of eastern China, the urban technology transfer network has strong dynamics. Reciprocity, network closure, and path dependence have become the endogenous driving forces for the growth and development of technology transfer networks. In the northern region of eastern China, the evolution rate of the network shows a downward trend. Reciprocity and path dependence contribute to the formation of network link pattern. In the northwest inland and the Qinghai-Tibet Plateau, the network evolution rate tends to increase, but the network density is small, and only the reciprocity effect is significant. This paper will deepen the understanding of the evolution law of urban networks and provide a scientific reference for China's urban innovation and development policy.
表1 SAOMs中的网络效应及描述Tab. 1 Network effects and descriptions in SAOMs |
| 网络效应[SIENA代码] | 公式 | 公式编号 | 示意图 | 描述 |
|---|---|---|---|---|
| 密度效应[density] | (1) | 城市技术转移网络关系是否为随机过程的结果 | ||
| 互惠效应[recip] | (2) | 城市间是否存在互惠链接关系 | ||
| 传递性闭合[transTrip] | (3) | 城市网络链接关系是否具有传递性闭合倾向 | ||
| 循环性闭合[cycle3] | (4) | 城市网络链接关系是否具有循环闭合 倾向 | ||
| 结构平衡效应[balance] | (5) | 链接结构相似的城市间是否更倾向于建立联系 | ||
| 入度聚敛效应[inPopSqrt] | (6) | 入度值较高的城市是否倾向于接收更多关系 | ||
| 出度聚敛效应[OutPopSqrt] | (7) | 出度值较高的城市是否倾向于接收更多关系 | ||
| 多维邻近性[X Prox] | (8) | 多维邻近网络是否影响城市间的链接 关系 | ||
| 发送者效应[egoX] | (9) | 属性值X较高的城市是否更倾向于发送关系 | ||
| 接收者效应[altX] | (10) | 属性值X较高的城市是否更倾向于接收关系 | ||
| 趋同效应[simX] | (11) | 属性值X相似的城市间是否倾更向于建立联系 | ||
| 趋同效应[sameX] | (12) | 类型X相同的城市间是否更倾向于建立联系 |
表2 中国城市技术转移网络三方组统计数量Tab. 2 The number of triad in the urban technology transfer network in China |
| 三方关系 | 数量/个 | |||||
|---|---|---|---|---|---|---|
| 类型 | 示例 | 2001—2005年 | 2006—2010年 | 2011—2015年 | 2016—2020年 | |
| 003 | A,B,C | 3 521 400 | 3 184 846 | 2 442 983 | 1 104 436 | |
| 012 | A→B,C | 134 329 | 329 501 | 635 325 | 768 334 | |
| 102 | A↔B,C | 27 006 | 102 373 | 244 062 | 343 032 | |
| 021D | A←B→C | 2 588 | 7 663 | 22 494 | 65 015 | |
| 021U | A→B←C | 1 341 | 8 275 | 39 899 | 119 601 | |
| 021C | A→B→C | 3 386 | 15 017 | 51 212 | 121 140 | |
| 111D | A↔B←C | 2 128 | 16 492 | 79 247 | 274 775 | |
| 111U | A↔B→C | 3 665 | 15 371 | 56 557 | 154 595 | |
| 030T | A→B←C,A→C | 154 | 1 202 | 7 182 | 42 421 | |
| 030C | A←B←C,A→C | 31 | 327 | 1 709 | 6 615 | |
| 201 | A↔B↔C | 1 262 | 10 216 | 61 068 | 231 554 | |
| 120D | A←B→C,A↔C | 90 | 799 | 7 531 | 54 362 | |
| 120U | A→B←C,A↔C | 102 | 809 | 4 596 | 30 204 | |
| 120C | A→B→C,A↔C | 149 | 1 314 | 9 611 | 56 762 | |
| 210 | A→B↔C,A↔C | 251 | 2 815 | 23 512 | 193 100 | |
| 300 | A↔B↔C,A↔C | 78 | 940 | 10 972 | 132 014 | |
表3 基准模型回归结果Tab.3 Regression results from benchmark models |
| 网络效应 | 模型1 | 模型2 | 模型3 | 模型4 | 模型5 |
|---|---|---|---|---|---|
| 内生结构效应 | |||||
| 密度效应(density) | -3.401 9*** (0.094 7) | -2.164 8*** (0.033 8) | -3.193 9*** (0.033 8) | -3.464 9*** (0.091 7) | -4.360 1*** (0.143 0) |
| 互惠效应(reciprocity) | 1.232 3*** (0.081 5) | 2.801 6*** (0.078 9) | 1.963 2*** (0.111 8) | 1.612 7*** (0.116 6) | 1.270 7*** (0.103 9) |
| 传递性闭合(transTrip) | 0.493 5*** (0.033 3) | 0.480 0*** (0.032 5) | 0.279 6*** (0.023 5) | ||
| 循环性闭合(cycle3) | -0.331 7*** (0.059 4) | -0.313 1*** (0.054 4) | -0.206 2*** (0.036 7) | ||
| 结构平衡效应(balance) | -0.044 6*** (0.005 1) | -0.045 7*** (0.004 8) | -0.024 7*** (0.004 8) | ||
| 入度聚敛效应(inPopSqrt) | 0.042 5 (0.101 2) | 0.089 3 (0.104 0) | 0.430 5*** (0.063 1) | ||
| 出度聚敛效应(outPopSqrt) | -0.066 9 (0.094 0) | -0.085 7 (0.097 9) | -0.273 1*** (0.099 1) | ||
| 网络协变量效应 | |||||
| 地理邻近(Dist) | 1.233 3*** (0.098 4) | 1.305 1*** (0.111 9) | 1.439 7*** (0.106 1) | ||
| 文化邻近(Culprox) | 0.587 8*** (0.101 4) | 0.663 8*** (0.107 1) | 0.522 2*** (0.102 3) | ||
| 组织邻近(Orgprox) | -0.086 2 (0.092 9) | -0.235 0*** (0.082 8) | -0.195 9* (0.100 0) | ||
| 行动者—关系效应 | |||||
| 经济接收者效应(GDP alt) | 0.036 8*** (0.002 6) | 0.018 3*** (0.003 2) | |||
| 经济发送者效应(GDP ego) | 0.038 3*** (0.003 1) | 0.019 6*** (0.003 8) | |||
| 经济趋同效应(GDP sim) | 1.105 1*** (0.211 5) | 1.064 1*** (0.240 3) | |||
| 知识接收者效应(know alt) | 1.388 7*** (0.129 4) | 0.970 1*** (0.154 2) | |||
| 知识发送者效应(know ego) | 1.949 4*** (0.151 6) | 1.596 2*** (0.148 7) | |||
| 知识趋同效应(know same) | -0.734 9*** (0.126 7) | -0.947 6*** (0.122 1) | |||
| 政治接收者效应(capital alt) | -0.432 8*** (0.073 1) | -0.129 9* (0.072 7) | |||
| 政治发送者效应(capital ego) | -0.369 1*** (0.087 8) | -0.193 8*** (0.093 1) | |||
| 政治趋同效应(capital same) | 0.073 0 (0.080 2) | 0.194 9*** (0.088 6) | |||
| 网络演化速率 | |||||
| rate period 1 | 7.891 4*** (0.824 4) | 4.139 4*** (0.357 5) | 28.538 2*** (7.398 5) | 35.222 9*** (11.719 6) | 24.153 2*** (4.968 5) |
| rate period 2 | 11.201 2*** (1.157 1) | 5.361 4*** (0.441 3) | 11.789 1*** (1.429 7) | 12.948 1*** (1.651 1) | 17.301 2*** (2.324 8) |
| rate period 3 | 31.681 6*** (3.657 8) | 10.082 2*** (0.753 7) | 10.011 5*** (0.652 5) | 10.511 5*** (0.697 2) | 16.459 0*** (1.393 8) |
注:括号中数值为标准误差,*、**和***分别代表在10%、5%和1%的水平上显著。 |
表4 空间异质性检验结果Tab. 4 Results of spatial heterogeneity test |
| 网络效应 | 模型1 | 模型2 | 模型3 | |||||
|---|---|---|---|---|---|---|---|---|
| 东部南方区 | 东部北方区 | 西北内陆和青藏高原区 | ||||||
| Estimate | S.E. | Estimate | S.E. | Estimate | S.E. | |||
| 内生结构效应 | ||||||||
| 密度效应(density) | -4.981 5*** | 0.145 0 | -5.538 8*** | 0.190 9 | -3.269 0*** | 0.330 1 | ||
| 互惠效应(reciprocity) | 0.998 1*** | 0.107 3 | 1.226 2*** | 0.161 2 | 1.133 6*** | 0.210 2 | ||
| 传递性闭合(transTrip) | 0.256 2*** | 0.022 8 | 0.199 9 | 0.067 5 | 0.053 1 | 0.116 7 | ||
| 循环性闭合(cycle3) | -0.221 0*** | 0.050 6 | 0.101 6 | 0.119 8 | 0.191 3 | 0.170 8 | ||
| 结构平衡效应(balance) | -0.021 3*** | 0.004 1 | -0.024 0*** | 0.007 3 | -0.014 7 | 0.038 7 | ||
| 入度聚敛效应(inPopSqrt) | 0.398 4*** | 0.089 5 | 0.640 4*** | 0.066 5 | 0.057 2 | 0.219 8 | ||
| 出度聚敛效应(outPopSqrt) | -0.098 8 | 0.141 6 | -0.443 8*** | 0.116 5 | 0.538 3 | 0.341 4 | ||
| 网络协变量效应 | ||||||||
| 地理邻近(Dist) | 1.601 2*** | 0.098 8 | 1.976 0*** | 0.123 1 | 1.288 6*** | 0.193 5 | ||
| 文化邻近(Culprox) | 0.440 5*** | 0.085 7 | 0.334 9*** | 0.142 6 | 0.947 1*** | 0.200 0 | ||
| 组织邻近(Orgprox) | -0.193 8** | 0.077 6 | -0.694 8*** | 0.152 5 | 0.025 5 | 0.165 8 | ||
| 行动者—关系效应 | ||||||||
| 经济接收者效应(GDP alt) | 0.013 6*** | 0.004 1 | 0.047 7*** | 0.007 6 | 0.025 2*** | 0.009 1 | ||
| 经济发送者效应(GDP ego) | 0.024 3*** | 0.004 2 | 0.039 5*** | 0.008 3 | 0.019 1*** | 0.009 7 | ||
| 经济趋同效应(GDP sim) | 1.199 5*** | 0.265 8 | 2.629 3*** | 0.535 2 | 0.861 0 | 0.645 9 | ||
| 知识接收者效应(know alt) | 1.143 7*** | 0.204 1 | 0.783 6*** | 0.185 8 | 0.293 1 | 0.265 8 | ||
| 知识发送者效应(know ego) | 2.188 2*** | 0.175 9 | 1.735 9*** | 0.209 8 | 0.226 8 | 0.310 6 | ||
| 知识趋同效应(know same) | -0.983 4*** | 0.147 4 | -0.878 1*** | 0.161 4 | -0.443 8*** | 0.190 6 | ||
| 政治接收者效应(capital alt) | -0.100 9 | 0.088 7 | -0.104 0 | 0.143 2 | 0.279 2 | 0.244 5 | ||
| 政治发送者效应(capital ego) | -0.258 8*** | 0.101 6 | 0.103 6 | 0.154 4 | 1.032 7*** | 0.284 3 | ||
| 网络演化速率 | ||||||||
| rate period 1 | 50.416 2*** | 12.770 7 | 21.639 0*** | 5.044 6 | 2.821 2*** | 0.790 4 | ||
| rate period 2 | 17.064 2*** | 2.029 0 | 15.517 6*** | 3.624 0 | 6.209 8*** | 1.334 9 | ||
| rate period 3 | 19.251 1*** | 1.469 6 | 10.799 9*** | 2.219 8 | 9.231 9*** | 1.618 0 | ||
注: *、**和***分别代表在10%、5%和1%的水平上显著。 |
表5 稳健性检验结果Tab.5 Robustness test results |
| 网络效应 | 调整网络数据 | 替换网络 | 样本截尾 | |||
|---|---|---|---|---|---|---|
| 模型1 | 模型2 | 模型3 | 模型4 | |||
| 内生结构效应 | ||||||
| 密度效应(density) | -4.684 5*** (0.196 0) | -4.415 7*** (0.179 3) | -5.068 7*** (0.175 3) | -3.043 6*** (0.119 9) | ||
| 互惠效应(reciprocity) | 1.462 6*** (0.149 7) | 1.418 4*** (0.125 5) | 1.403 1*** (0.130 5) | 1.096 1*** (0.096 4) | ||
| 传递性闭合(transTrip) | 0.501 3*** (0.056 4) | 0.292 5*** (0.025 3) | 0.299 8*** (0.035 4) | 0.266 6*** (0.021 1) | ||
| 循环性闭合(cycle3) | -0.302 4*** (0.055 7) | -0.204 8*** (0.040 1) | -0.276 2*** (0.066 2) | -0.220 5*** (0.037 7) | ||
| 结构平衡效应(balance) | -0.074 5*** (0.023 0) | -0.026 0*** (0.005 2) | -0.013 4*** (0.004 4) | -0.020 4*** (0.003 7) | ||
| 入度聚敛效应(inPopSqrt) | 0.404 2*** (0.118 9) | 0.498 6*** (0.059 8) | 0.535 5*** (0.065 0) | 0.263 1*** (0.069 3) | ||
| 出度聚敛效应(outPopSqrt) | -0.522 9*** (0.164 3) | -0.329 8*** (0.108 8) | 0.003 2 (0.129 1) | -0.199 5** (0.086 5) | ||
| 网络协变量效应 | ||||||
| 地理邻近(Dist) | 1.764 4*** (0.154 7) | 1.480 0*** (0.129 2) | 1.376 7*** (0.120 5) | 1.306 9*** (0.085 7) | ||
| 文化邻近(Culprox) | 0.695 4*** (0.140 2) | 0.439 7*** (0.124 7) | 0.501 4*** (0.118 5) | 0.542 1*** (0.086 8) | ||
| 组织邻近(Orgprox) | -0.298 8* (0.152 7) | -0.134 5 (0.120 8) | -0.129 0 (0.116 1) | -0.217 3** (0.102 5) | ||
| 行动者—关系效应 | ||||||
| 经济接收者效应(GDP alt) | 0.024 2*** (0.005 3) | 0.016 9*** (0.004 2) | 0.007 5* (0.004 3) | 0.020 8*** (0.003 2) | ||
| 经济发送者效应(GDP ego) | 0.023 8*** (0.007 8) | 0.015 4*** (0.004 7) | 0.035 4*** (0.004 9) | 0.022 8*** (0.003 9) | ||
| 经济趋同效应(GDP sim) | 1.607 2*** (0.415 2) | 1.138 7*** (0.292 7 | 1.138 7*** (0.292 7 | 0.880 5*** (0.141 4) | ||
| 知识接收者效应(know alt) | 1.191 0*** (0.203 8) | 0.985 4*** (0.213 4) | 0.513 0*** (0.171 2) | 0.588 1*** (0.104 9) | ||
| 知识发送者效应(know ego) | 1.653 4*** (0.233 8) | 1.787 9*** (0.196 2) | 1.734 5*** (0.177 9) | 0.884 2*** (0.097 0) | ||
| 知识趋同效应(know same) | -0.951 4*** (0.162 4) | -1.143 1*** (0.167 3) | -0.806 1*** (0.130 3) | -0.512 6*** (0.070 7) | ||
| 政治接收者效应(capital alt) | -0.238 5** (0.112 8) | -0.162 7* (0.094 4) | -0.166 2* (0.088 9) | -0.204 1*** (0.069 5) | ||
| 政治发送者效应(capital ego) | -0.367 5** (0.166 5) | -0.332 2*** (0.116 5) | -0.218 6* (0.115 6) | -0.249 6*** (0.087 2) | ||
| 政治趋同效应(capital same) | 0.171 4 (0.133 5) | 0.158 4 (0.109 2) | 0.197 2** (0.096 5) | 0.004 6 (0.099 8) | ||
| 网络演化速率 | ||||||
| rate period 1 | 9.550 9*** (1.214 9) | 21.528 3*** (3.640 9) | 14.658 1*** (3.109 1) | 29.930 2*** (6.498 8) | ||
| rate period 2 | 7.661 6*** (0.759 4) | 16.884 9*** (1.506 7) | 23.035 4*** (3.494 6) | 33.856 7*** (5.801 2) | ||
| rate period 3 | 6.264 5*** (0.498 6) | - - | 16.507 1*** (1.361 6) | 21.134 5*** (1.653 9) | ||
注:括号中数值为标准误差,*、**和***分别代表在10%、5%和1%的水平上显著。 |
| [1] |
刘承良, 管明明, 段德忠. 中国城际技术转移网络的空间格局及影响因素[J]. 地理学报, 2018, 73(8):1462-1477.
[
|
| [2] |
|
| [3] |
马海涛. 基于知识流动的中国城市网络研究进展与展望[J]. 经济地理, 2016, 36(11):207-213,223.
[
|
| [4] |
刘通, 刘承良. “全球—地方”视角下中国创新网络演化格局与内生机制[J/OL]. 世界地理研究,1-15[2024-02-03].
[
|
| [5] |
滕子优, 朱雪忠, 胡成. 创新主体在城市群知识网络中的角色——基于科学与技术关联视角[J/OL]. 科学学研究:1-18[2023-09-21].
[
|
| [6] |
|
| [7] |
华连连, 刘帅娟, 王建国. 专利视角下的供应链创新网络演化研究[J]. 科研管理, 2021, 42(11):99-109.
[
|
| [8] |
段德忠, 杜德斌, 谌颖, 等. 中国城市创新网络的时空复杂性及生长机制研究[J]. 地理科学, 2018, 38(11):1759-1768.
[
|
| [9] |
|
| [10] |
|
| [11] |
曹湛, 戴靓, 吴康, 等. 全球城市知识合作网络演化的结构特征与驱动因素[J]. 地理研究, 2022, 41(4):1072-1091.
[
|
| [12] |
吕丹, 王. “成渝城市群” 创新网络结构特征演化及其协同创新发展[J]. 中国软科学, 2020(11):154-161.
[
|
| [13] |
|
| [14] |
向希尧, 蔡虹. 组织间跨国知识流动网络结构分析——基于专利的实证研究[J]. 科学学研究, 2011, 29(1):97-105.
[
|
| [15] |
赵巧芝, 张聪, 崔和瑞. 长江经济带地级城市间技术创新关联网络演变特征研究[J]. 技术经济, 2021, 40(12):1-10.
[
|
| [16] |
张杰, 盛科荣, 王传阳. 中国城市间金融网络的空间演化及其影响因素[J]. 热带地理, 2022, 42(6):928-938.
[
|
| [17] |
|
| [18] |
周灿, 曾刚, 尚勇敏. 演化经济地理学视角下创新网络研究进展与展望[J]. 经济地理, 2019, 39(5):27-36.
[
|
| [19] |
陈钰芬, 王科平. 多维邻近性视角下人工智能合作创新网络演化研究[J]. 管理学报, 2023, 20(7):1045-1055.
[
|
| [20] |
桂钦昌, 杜德斌, 刘承良, 等. 基于随机行动者模型的全球科学合作网络演化研究[J]. 地理研究, 2022, 41(10):2631-2647.
[
|
| [21] |
|
| [22] |
戴靓, 纪宇凡, 王嵩, 等. 中国城市知识创新网络的演化特征及其邻近性机制[J]. 资源科学, 2022, 44(7):1494-1505.
[
|
| [23] |
|
| [24] |
戴靓, 曹湛, 马海涛, 等. 中国城市知识合作网络结构演化的影响机制[J]. 地理学报, 2023, 78(2):334-350.
[
|
| [25] |
余谦, 葛梦妮, 马玎. 全球创新网络演化的结构与邻近性影响机理——基于TERGMs的分析[J]. 北京邮电大学学报(社会科学版), 2021, 23(2):56-68.
[
|
| [26] |
|
| [27] |
濮蓉, 陶卓民, 濮元生, 等. 基于电信数据的潜在旅游流网络结构特征及影响因素分析——以江苏省为例[J]. 重庆理工大学学报(自然科学), 2021, 35(4):231-238.
[
|
| [28] |
罗超亮, 符正平, 刘冰, 等. 战略性新兴产业国际贸易网络的演化及动力机制研究[J]. 国际贸易问题, 2022(3):121-139.
[
|
| [29] |
|
| [30] |
|
| [31] |
|
| [32] |
|
| [33] |
|
| [34] |
王庆喜, 胡志学. 多维邻近下浙江城市创新网络演化及其机制研究[J]. 地理科学, 2021, 41(8):1380-1388.
[
|
| [35] |
胡悦, 马静, 李雪燕. 京津冀城市群创新网络结构演化及驱动机制研究[J]. 科技进步与对策, 2020, 37(13):37-44.
[
|
| [36] |
盛科荣, 王云靓, 樊杰. 中国城市网络空间结构的演化特征及机理研究——基于上市公司500强企业网络视角[J]. 经济地理, 2019, 39(11):84-93.
[
|
| [37] |
盛科荣, 杨雨, 张红霞. 中国城市网络的凝聚子群及影响因素研究[J]. 地理研究, 2019, 38(11):2639-2652.
[
|
| [38] |
中国社会科学院语言研究所. 中国语言地图集(第2版)[M]. 北京: 商务印书馆, 2012.
[ Institute of Linguistics, CASS. Language Atlas of China(2nd)[M]. Beijing: The Commercial Press, 2012.]
|
| [39] |
国家统计局. 中国统计年鉴[M]. 北京: 中国统计出版社, 2002—2021.
[ National Bureau of Statistics of China. China statistical yearbook[M]. Beijing: China Statistics Press, 2002—2021.]
|
| [40] |
樊杰, 周侃, 盛科荣, 等. 中国陆域综合功能区及其划分方案[J]. 中国科学:地球科学, 2023, 53(2):236-255.
[
|
| [41] |
盛科荣, 李晓瑞, 孙威, 等. 中国城市网络地位对碳排放效率的影响[J]. 地理学报, 2023, 78(11):2864-2882.
[
|
| [42] |
郭鹏飞, 胡歆韵, 李敬. 中国网络基础设施资本回报率的区域差异与空间收敛性研究[J]. 数量经济技术经济研究, 2022, 39(1):73-93.
[
|
| [43] |
苏佳璐, 李明星, 马泽君, 等. 基于TERGM的跨区域技术协同创新网络演化动力研究[J]. 系统管理学报, 2023, 32(6):1255-1268.
[
|
| [44] |
滕堂伟, 张晶. 多样性、技术网络与城市经济韧性——基于长江经济带城市数据的分析[J]. 同济大学学报(社会科学版), 2023, 34(5):48-59.
[
|
| [45] |
盛科荣, 王传阳, 刘乐, 等. 中国城市知识网络嵌入与科技企业孵化的交互影响研究[J]. 地理研究, 2023, 42(1):34-52.
[
|
| [46] |
谭春辉, 吴晓风, 程凡. “十五” 至 “十二五” 期间国家科技进步奖获奖机构合作网络演化机理分析[J]. 现代情报, 2017, 37(12):131-137.
[
|
| [47] |
|
/
| 〈 |
|
〉 |